-
×
 SATYA 2 - Online Immersion - January 2023 By Tias Little
1 × $225.00
SATYA 2 - Online Immersion - January 2023 By Tias Little
1 × $225.00 -
×
 The Indices Orderflow Masterclass with The Forex Scalpers
1 × $23.00
The Indices Orderflow Masterclass with The Forex Scalpers
1 × $23.00 -
×
 Forecast 2024 Clarification with Larry Williams
1 × $15.00
Forecast 2024 Clarification with Larry Williams
1 × $15.00 -
×
 Master Class Recording 2019 with Oil Trading Academy
1 × $17.00
Master Class Recording 2019 with Oil Trading Academy
1 × $17.00 -
×
 $20 – 52k 20 pips a day challange with Rafał Zuchowicz - TopMasterTrader
1 × $5.00
$20 – 52k 20 pips a day challange with Rafał Zuchowicz - TopMasterTrader
1 × $5.00 -
×
 Sensitivity Analysis in Practice
1 × $6.00
Sensitivity Analysis in Practice
1 × $6.00 -
×
 WondaFX Signature Strategy with WondaFX
1 × $5.00
WondaFX Signature Strategy with WondaFX
1 × $5.00 -
×
 A Game Plan for Investing in the 21st Century with Thomas J.Dorsey
1 × $6.00
A Game Plan for Investing in the 21st Century with Thomas J.Dorsey
1 × $6.00 -
×
![ACD Method [Video (6 MP4s)] with Mark Fisher](https://www.totozon.com/wp-content/uploads/2024/05/ACD-Method-Video-6-MP4s-with-Mark-Fisher.jpg) ACD Method [Video (6 MP4s)] with Mark Fisher
1 × $6.00
ACD Method [Video (6 MP4s)] with Mark Fisher
1 × $6.00 -
×
 Five Trading Trends of 2005 with Dan Denning
1 × $6.00
Five Trading Trends of 2005 with Dan Denning
1 × $6.00 -
×
 Masterclass 5.0 with RockzFX
1 × $5.00
Masterclass 5.0 with RockzFX
1 × $5.00 -
×
 OFA - Intensive Boot Camp 5 Day Course
1 × $6.00
OFA - Intensive Boot Camp 5 Day Course
1 × $6.00 -
×
 Compass Trading System with Right Line Trading
1 × $39.00
Compass Trading System with Right Line Trading
1 × $39.00 -
×
 The A14 Weekly Option Strategy Workshop with Amy Meissner
1 × $23.00
The A14 Weekly Option Strategy Workshop with Amy Meissner
1 × $23.00 -
×
 FestX Main Online video Course with Clint Fester
1 × $5.00
FestX Main Online video Course with Clint Fester
1 × $5.00 -
×
 Trading Against the Crowd with John Summa
1 × $6.00
Trading Against the Crowd with John Summa
1 × $6.00 -
×
 Day Trading Insight with Al Brooks
1 × $10.00
Day Trading Insight with Al Brooks
1 × $10.00 -
×
 Butterfly and Condor Workshop with Aeromir
1 × $15.00
Butterfly and Condor Workshop with Aeromir
1 × $15.00 -
×
 0 DTE Options Trading Workshop with Aeromir Corporation
1 × $15.00
0 DTE Options Trading Workshop with Aeromir Corporation
1 × $15.00 -
×
 Studies in Stock Speculation (Volume I & II) with H.J.Wolf
1 × $6.00
Studies in Stock Speculation (Volume I & II) with H.J.Wolf
1 × $6.00 -
×
 A Grand Supercycle Top Webinar with Steven Hochberg
1 × $6.00
A Grand Supercycle Top Webinar with Steven Hochberg
1 × $6.00 -
×
 High Probability Trading Using Elliott Wave And Fibonacci Analysis withVic Patel - Forex Training Group
1 × $10.00
High Probability Trading Using Elliott Wave And Fibonacci Analysis withVic Patel - Forex Training Group
1 × $10.00 -
×
 How To Read The Market Professionally with TradeSmart
1 × $27.00
How To Read The Market Professionally with TradeSmart
1 × $27.00 -
×
 The 10%ers with Trader Mike
1 × $5.00
The 10%ers with Trader Mike
1 × $5.00 -
×
 Larry Connors Professional Day Trading for Success Program
1 × $62.00
Larry Connors Professional Day Trading for Success Program
1 × $62.00 -
×
 The Art of the Trade: What I Learned (and Lost) Trading the Chicago Futures Markets - Jason Alan Jankovsky
1 × $6.00
The Art of the Trade: What I Learned (and Lost) Trading the Chicago Futures Markets - Jason Alan Jankovsky
1 × $6.00 -
×
 A Comprehensive Guide to Intraday Trading Strategies & Setups Class with Jeff Bierman
1 × $6.00
A Comprehensive Guide to Intraday Trading Strategies & Setups Class with Jeff Bierman
1 × $6.00 -
×
 The Practical Application of Fibonacci Analysis to Investment Markets
1 × $6.00
The Practical Application of Fibonacci Analysis to Investment Markets
1 × $6.00 -
×
 7 DAY INTENSIVE ONLINE TRADER TRAINING PROGRAMME with The Trading Framework
1 × $15.00
7 DAY INTENSIVE ONLINE TRADER TRAINING PROGRAMME with The Trading Framework
1 × $15.00 -
×
 Power Cycle Trading The Ultimate Option Guide: When & How to Use Which Option Strategy For the Best Results - Powercycletrading
1 × $69.00
Power Cycle Trading The Ultimate Option Guide: When & How to Use Which Option Strategy For the Best Results - Powercycletrading
1 × $69.00 -
×
 Stock Investing Strategies with Maria Crawford Scott, John Bajkowski
1 × $6.00
Stock Investing Strategies with Maria Crawford Scott, John Bajkowski
1 × $6.00 -
×
 3 Steps To Supply/Demand + 3 Steps To Market Profile 10% Off Combined Price
1 × $23.00
3 Steps To Supply/Demand + 3 Steps To Market Profile 10% Off Combined Price
1 × $23.00 -
×
 Consistently Profitable Trader with Pollinate Trading
1 × $13.00
Consistently Profitable Trader with Pollinate Trading
1 × $13.00 -
×
 Amibroker CBT Intensive Course with Matt Radtke
1 × $31.00
Amibroker CBT Intensive Course with Matt Radtke
1 × $31.00 -
×
 Who is Afraid of Word Trade Organization with Kent Jones
1 × $6.00
Who is Afraid of Word Trade Organization with Kent Jones
1 × $6.00 -
×
 Global Product with John Stark
1 × $6.00
Global Product with John Stark
1 × $6.00 -
×
 Quantamentals - The Next Great Forefront Of Trading and Investing with Trading Markets
1 × $8.00
Quantamentals - The Next Great Forefront Of Trading and Investing with Trading Markets
1 × $8.00 -
×
 The Orderflow Masterclass with PrimeTrading
1 × $17.00
The Orderflow Masterclass with PrimeTrading
1 × $17.00 -
×
 If You Are So Smart Why Aren’t You Rich with Ben Branch
1 × $6.00
If You Are So Smart Why Aren’t You Rich with Ben Branch
1 × $6.00 -
×
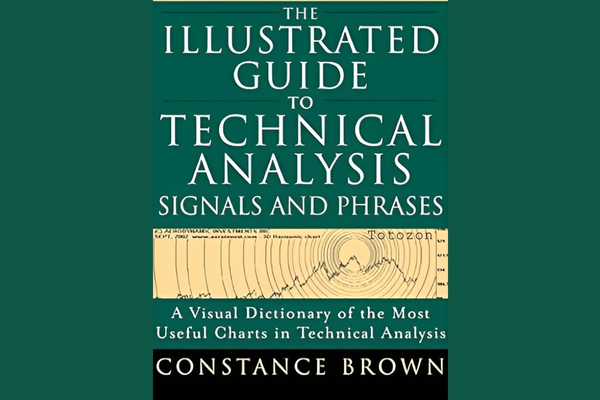 The Illustrated Guide to Technical Analysis Signals and Phrases with Constance Brown
1 × $6.00
The Illustrated Guide to Technical Analysis Signals and Phrases with Constance Brown
1 × $6.00 -
×
 Matrix Spread Options Trading Course with Base Camp Trading
1 × $31.00
Matrix Spread Options Trading Course with Base Camp Trading
1 × $31.00
 with John J.Murphy")
InterMarket Analysis (Ed.2004) with John J.Murphy
$6.00
File Size: Coming soon!
Delivery Time: 1–12 hours
Media Type: Online Course
Content Proof: Watch Here!
You may check content proof of “InterMarket Analysis (Ed.2004) with John J.Murphy” below:
 with John J.Murphy")
InterMarket Analysis (Ed. 2004) with John J. Murphy
In the complex world of financial trading, understanding the relationships between different markets is crucial. John J. Murphy’s “InterMarket Analysis” (Ed. 2004) provides a comprehensive guide to this approach, offering traders invaluable insights into market dynamics. This article explores the key concepts, tools, and techniques from Murphy’s work, helping you leverage InterMarket Analysis for better trading decisions.
What is InterMarket Analysis?
Definition
InterMarket Analysis involves studying the correlations between different financial markets, such as stocks, bonds, commodities, and currencies. By analyzing these relationships, traders can predict market trends and make informed decisions.
Historical Context
The concept of InterMarket Analysis gained popularity in the late 20th century, with John J. Murphy being one of its foremost proponents. His 2004 edition expands on these principles, incorporating modern market dynamics.
Key Concepts in InterMarket Analysis
Market Correlations
Stocks and Bonds
Typically, stocks and bonds have an inverse relationship. When stock prices rise, bond prices often fall, indicating shifts in investor sentiment and economic conditions.
Commodities and Currencies
Commodity prices can significantly impact currency values, particularly for countries that are major exporters or importers. For instance, rising oil prices can strengthen the currencies of oil-exporting nations.
Leading and Lagging Indicators
Leading Indicators
Leading indicators, such as commodity prices and bond yields, often change direction before the broader market. They provide early signals of potential market trends.
Lagging Indicators
Lagging indicators, like stock prices, confirm trends after they have started. These indicators help validate the signals from leading indicators.
Practical Application of InterMarket Analysis
Identifying Trends
Analyzing the relationships between different markets helps identify trends that might not be apparent when looking at a single market. For example, a rise in bond yields might signal future stock market weakness.
Confirming Signals
InterMarket Analysis can confirm signals from other technical indicators. If multiple markets point in the same direction, it increases the likelihood of a valid trend.
Risk Management
Understanding market correlations helps manage risk more effectively. For example, knowing that rising interest rates typically lead to lower stock prices allows traders to adjust their portfolios accordingly.
Techniques for InterMarket Analysis
Chart Patterns
Head and Shoulders
The head and shoulders pattern, a common reversal pattern, can appear across different markets. Analyzing this pattern in related markets can provide additional confirmation of a trend reversal.
Double Tops and Bottoms
Double tops and bottoms are also reversal patterns that signal the end of a trend. Observing these patterns in multiple markets can provide stronger signals.
Correlation Analysis
Positive Correlation
A positive correlation between two markets means they move in the same direction. For example, a positive correlation between stock prices and commodity prices might indicate a strong economy.
Negative Correlation
A negative correlation means two markets move in opposite directions. The inverse relationship between stocks and bonds is a classic example of negative correlation.
Using Technical Indicators
Moving Averages
Moving averages smooth out price data to identify trends. Applying moving averages to multiple markets can highlight broader market trends.
Relative Strength Index (RSI)
The RSI measures the speed and change of price movements. Comparing RSI values across different markets can provide insights into market strength and potential reversals.
Benefits of InterMarket Analysis
Enhanced Market Understanding
InterMarket Analysis offers a deeper understanding of market dynamics, enabling traders to make more informed decisions.
Improved Trading Strategies
Considering multiple markets allows traders to develop more robust trading strategies that account for broader economic trends.
Better Risk Management
Understanding intermarket relationships helps traders anticipate market movements and manage risk more effectively.
Challenges of InterMarket Analysis
Complexity
InterMarket Analysis requires broad knowledge of multiple markets and their interactions, which can be complex and time-consuming.
Data Interpretation
Accurate data interpretation is crucial. Misinterpreting correlations or signals can lead to incorrect trading decisions.
Advanced Techniques in InterMarket Analysis
Algorithmic Trading
Algorithmic trading uses computer programs to execute trades based on predefined criteria. This approach can enhance trading efficiency and accuracy.
Leveraging Data Analytics
Big data and analytics provide deeper insights into market trends and trader behavior. Use advanced analytics tools to refine your trading strategies.
Utilizing Modern Trading Tools
Modern trading platforms offer real-time data, advanced charting capabilities, and automated trading features, making it easier to apply InterMarket Analysis.
Conclusion
John J. Murphy’s “InterMarket Analysis” (Ed. 2004) remains a crucial resource for traders seeking to understand and anticipate market movements. By analyzing the relationships between different financial markets, traders can gain valuable insights, confirm signals, and manage risk more effectively. As with any trading strategy, continuous education and adaptation to changing market conditions are essential.
 with John J.Murphy")
FAQs
1. What is InterMarket Analysis?
InterMarket Analysis studies the relationships between different financial markets to predict market movements.
2. Why is InterMarket Analysis important?
It provides a comprehensive view of market behavior, helping traders identify trends and potential turning points.
3. How can InterMarket Analysis improve trading strategies?
It enhances market understanding, allowing for more informed trading decisions and better risk management.
4. What are the key tools used in InterMarket Analysis?
Key tools include chart patterns, correlation analysis, and technical indicators like moving averages and RSI.
5. What are the challenges of InterMarket Analysis?
The main challenges are its complexity and the need for accurate data interpretation.
Be the first to review “InterMarket Analysis (Ed.2004) with John J.Murphy”
You must be logged in to post a review.
Related products
Forex Trading
Original price was: $4,997.00.$27.00Current price is: $27.00.
Original price was: $497.00.$31.00Current price is: $31.00.
Forex Trading
Original price was: $125.00.$17.00Current price is: $17.00.
Forex Trading
Original price was: $999.00.$15.00Current price is: $15.00.

Forex Trading
The Complete Guide to Multiple Time Frame Analysis & Reading Price Action with Aiman Almansoori
Original price was: $1,399.00.$13.00Current price is: $13.00.

Forex Trading
Original price was: $239.00.$8.00Current price is: $8.00.

Original price was: $1,849.00.$15.00Current price is: $15.00.

Forex Trading
Original price was: $2,995.00.$31.00Current price is: $31.00.
Forex Trading
Original price was: $797.00.$10.00Current price is: $10.00.

Original price was: $497.00.$11.00Current price is: $11.00.

Forex Trading
Original price was: $397.00.$31.00Current price is: $31.00.
Forex Trading
Original price was: $550.00.$5.00Current price is: $5.00.

Original price was: $139.00.$23.00Current price is: $23.00.

Original price was: $895.00.$15.00Current price is: $15.00.

Original price was: $695.00.$41.00Current price is: $41.00.

Original price was: $1,200.00.$23.00Current price is: $23.00.

Original price was: $997.00.$8.00Current price is: $8.00.

Original price was: $799.00.$15.00Current price is: $15.00.
Original price was: $450.00.$23.00Current price is: $23.00.

Forex Trading
Original price was: $499.00.$15.00Current price is: $15.00.

Reviews
There are no reviews yet.