-
×
 Pips&Profit Trading Course
1 × $13.00
Pips&Profit Trading Course
1 × $13.00 -
×
 Atlas Forex Trading Course
1 × $5.00
Atlas Forex Trading Course
1 × $5.00 -
×
 SATYA 2 - Online Immersion - January 2023 By Tias Little
1 × $225.00
SATYA 2 - Online Immersion - January 2023 By Tias Little
1 × $225.00 -
×
 Investing Under Fire with Alan R.Ackerman
1 × $6.00
Investing Under Fire with Alan R.Ackerman
1 × $6.00 -
×
 Redler Ultimate Access
1 × $54.00
Redler Ultimate Access
1 × $54.00 -
×
 Advanced Forex Patterns with Vic Noble & Darko Ali
1 × $39.00
Advanced Forex Patterns with Vic Noble & Darko Ali
1 × $39.00 -
×
 Asset Prices, Booms & Recessions (2nd Ed.) with Willi Semmler
1 × $6.00
Asset Prices, Booms & Recessions (2nd Ed.) with Willi Semmler
1 × $6.00 -
×
 Arjoio’s MMT - Essential Package
1 × $5.00
Arjoio’s MMT - Essential Package
1 × $5.00 -
×
 High Probability Trading Using Elliott Wave And Fibonacci Analysis withVic Patel - Forex Training Group
1 × $10.00
High Probability Trading Using Elliott Wave And Fibonacci Analysis withVic Patel - Forex Training Group
1 × $10.00 -
×
 Futures Trading Mastery 2022 | FREE Top 45 Trading Signals!
1 × $5.00
Futures Trading Mastery 2022 | FREE Top 45 Trading Signals!
1 × $5.00 -
×
 Pro Trader Boot Camp Home Study with Derrick Oldensmith - T3 Live
1 × $31.00
Pro Trader Boot Camp Home Study with Derrick Oldensmith - T3 Live
1 × $31.00 -
×
 ZipTraderU 2022 - Your Map To The Stock Market with ZipTrader
1 × $69.00
ZipTraderU 2022 - Your Map To The Stock Market with ZipTrader
1 × $69.00 -
×
 Measuring Market Risk (2nd Edition) with Kevin Dowd
1 × $6.00
Measuring Market Risk (2nd Edition) with Kevin Dowd
1 × $6.00 -
×
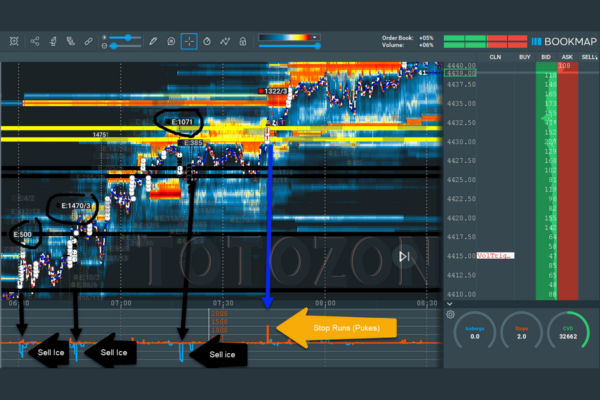
 Order Flow With The Power Of Point Of Control Course and The Imbalance
1 × $6.00
Order Flow With The Power Of Point Of Control Course and The Imbalance
1 × $6.00 -
×
 Forex Trading Systems Elearning Course - Busted Breakout System with Van Tharp
1 × $6.00
Forex Trading Systems Elearning Course - Busted Breakout System with Van Tharp
1 × $6.00 -
×
 Forex Trend Line Strategy with Kelvin Lee
1 × $6.00
Forex Trend Line Strategy with Kelvin Lee
1 × $6.00 -
×
 Forecast 2024 Clarification with Larry Williams
1 × $15.00
Forecast 2024 Clarification with Larry Williams
1 × $15.00 -
×
 WITS Turbo Seminars with Brian James Sklenka
1 × $6.00
WITS Turbo Seminars with Brian James Sklenka
1 × $6.00 -
×
 No BS Day Trading Basic Course
1 × $6.00
No BS Day Trading Basic Course
1 × $6.00 -
×
 Forex Trading Plan - Learn How To Set SMART Trading Goals! with Anas Abba & FXMindTrix Academy
1 × $6.00
Forex Trading Plan - Learn How To Set SMART Trading Goals! with Anas Abba & FXMindTrix Academy
1 × $6.00 -
×
 The Prop Trading Code with Brannigan Barrett - Axia Futures
1 × $23.00
The Prop Trading Code with Brannigan Barrett - Axia Futures
1 × $23.00 -
×
 PiScaled
1 × $6.00
PiScaled
1 × $6.00 -
×
 Crypto Trading Academy with Cheeky Investor - Aussie Day Trader
1 × $13.00
Crypto Trading Academy with Cheeky Investor - Aussie Day Trader
1 × $13.00 -
×
 Profiletraders - Market Profile Day Trading
1 × $15.00
Profiletraders - Market Profile Day Trading
1 × $15.00 -
×
 Plunketts Investment & Securities Industry Almanac 2010 with Jack W.Plunkett
1 × $6.00
Plunketts Investment & Securities Industry Almanac 2010 with Jack W.Plunkett
1 × $6.00 -
×
 All About Bonds, Bond Mutual Funds & Bond ETFs (3rd Ed.) with Esme Faerber
1 × $6.00
All About Bonds, Bond Mutual Funds & Bond ETFs (3rd Ed.) with Esme Faerber
1 × $6.00 -
×
 SI Indicator Course 2023 with Scott Pulcini
1 × $15.00
SI Indicator Course 2023 with Scott Pulcini
1 × $15.00 -
×
 Level II Trading Warfare - The Undergroundtrader's Powerful Weapons for Winning - Jea Yu
1 × $6.00
Level II Trading Warfare - The Undergroundtrader's Powerful Weapons for Winning - Jea Yu
1 × $6.00 -
×
 Indicator Effectiveness Testing & System Creation with David Vomund
1 × $6.00
Indicator Effectiveness Testing & System Creation with David Vomund
1 × $6.00 -
×
 How to Trade the New Single Stock Futures with Jack Bernstein
1 × $6.00
How to Trade the New Single Stock Futures with Jack Bernstein
1 × $6.00 -
×
 Forex Options Trading
1 × $6.00
Forex Options Trading
1 × $6.00 -
×
 Penny Stock Mastery
1 × $31.00
Penny Stock Mastery
1 × $31.00 -
×
 Trader University with Matthew Kratter
1 × $6.00
Trader University with Matthew Kratter
1 × $6.00 -
×
 Butterfly and Condor Workshop with Aeromir
1 × $15.00
Butterfly and Condor Workshop with Aeromir
1 × $15.00 -
×
 WondaFX Signature Strategy with WondaFX
1 × $5.00
WondaFX Signature Strategy with WondaFX
1 × $5.00 -
×
 Quality FX Academy
1 × $5.00
Quality FX Academy
1 × $5.00 -
×
 Trading Masterclass XVII with Wysetrade
1 × $6.00
Trading Masterclass XVII with Wysetrade
1 × $6.00 -
×
 Proven Swing Trading Strat & Multiple Time Frame Analysis - Robert Krausz & Thom Hartle
1 × $6.00
Proven Swing Trading Strat & Multiple Time Frame Analysis - Robert Krausz & Thom Hartle
1 × $6.00 -
×
 The Naked Eye: Raw Data Analytics with Edgar Torres - Raw Data Analytics
1 × $8.00
The Naked Eye: Raw Data Analytics with Edgar Torres - Raw Data Analytics
1 × $8.00 -
×
 ICT Prodigy Trading Course – $650K in Payouts with Alex Solignani
1 × $15.00
ICT Prodigy Trading Course – $650K in Payouts with Alex Solignani
1 × $15.00 -
×
 Advanced Swing Trading with John Crane
1 × $6.00
Advanced Swing Trading with John Crane
1 × $6.00 -
×
 Options Education FULL Course 30+ Hours with Macrohedged
1 × $23.00
Options Education FULL Course 30+ Hours with Macrohedged
1 × $23.00 -
×
 Use the News with Maria Bartiromo
1 × $6.00
Use the News with Maria Bartiromo
1 × $6.00 -
×
 AI For Traders with Trading Markets
1 × $31.00
AI For Traders with Trading Markets
1 × $31.00 -
×
 Practical Applications of Candlestick Charts with Gary Wagner
1 × $6.00
Practical Applications of Candlestick Charts with Gary Wagner
1 × $6.00 -
×
 ND10X - 10X Your Money In 10 Days with Nicola Delic
1 × $23.00
ND10X - 10X Your Money In 10 Days with Nicola Delic
1 × $23.00

Getting New Insights from Old Indicators with Martin Pring
$6.00
File Size: Coming soon!
Delivery Time: 1–12 hours
Media Type: Online Course
Content Proof: Watch Here!
You may check content proof of “Getting New Insights from Old Indicators with Martin Pring” below:

Getting New Insights from Old Indicators with Martin Pring
Introduction to Martin Pring’s Approach
When it comes to technical analysis, Martin Pring is a name that resonates with both seasoned traders and newcomers. His ability to derive new insights from traditional indicators has set him apart in the trading community. This article delves into Pring’s innovative methods for extracting fresh perspectives from established indicators, helping traders enhance their strategies and achieve better results.
Who is Martin Pring?
A Pioneer in Technical Analysis
Martin Pring is a renowned author, educator, and trader who has significantly influenced the field of technical analysis. With decades of experience, he has developed numerous tools and methodologies that have become staples in the trading world.
Contributions to Trading
Pring’s work extends beyond his books and seminars. He has created innovative indicators and analysis techniques that traders around the world rely on to navigate the financial markets.
Understanding Technical Indicators
What are Technical Indicators?
Technical indicators are mathematical calculations based on historical price, volume, or open interest information. They are used by traders to predict future market movements.
Types of Technical Indicators
- Trend Indicators: Identify the direction of the market.
- Momentum Indicators: Measure the speed of price movements.
- Volume Indicators: Analyze trading volume to gauge the strength of a move.
- Volatility Indicators: Assess the rate of price fluctuations.
The Value of Old Indicators
Why Old Indicators Matter
Traditional indicators have stood the test of time because they provide valuable insights into market behavior. Understanding their strengths and limitations is crucial for effective trading.
Examples of Old Indicators
- Moving Averages
- Relative Strength Index (RSI)
- Bollinger Bands
- MACD (Moving Average Convergence Divergence)
Martin Pring’s New Insights
Innovative Use of Moving Averages
Pring has developed new ways to interpret moving averages, such as combining different timeframes to better identify trend changes.
Combining Timeframes
Using short-term and long-term moving averages together can provide a clearer picture of market trends. For example, a crossover of a 50-day moving average with a 200-day moving average is a classic signal of a major trend shift.
Enhanced Relative Strength Index (RSI)
Pring’s approach to RSI involves adjusting the period settings and incorporating it with other indicators to confirm signals.
Adjusting Period Settings
Instead of the traditional 14-day period, Pring suggests experimenting with different periods to better match the market’s current volatility.
Reinterpreting Bollinger Bands
By modifying the standard deviation settings and analyzing the width of the bands, Pring offers deeper insights into market volatility and potential breakout points.
Modifying Standard Deviation
Using a 1.5 or 2.5 standard deviation instead of the typical 2 can highlight different market conditions and potential trade opportunities.
Advanced MACD Interpretations
Pring’s advanced interpretations of MACD focus on the histogram and its relation to price movements, offering a more nuanced view of market momentum.
Focus on Histogram
Analyzing the MACD histogram helps traders identify early signs of trend reversals and momentum shifts.
Applying Pring’s Methods
Step-by-Step Guide
- Identify the Indicator: Choose an indicator to analyze.
- Adjust Parameters: Modify the settings as suggested by Pring.
- Combine Indicators: Use multiple indicators for confirmation.
- Analyze Market Conditions: Consider current market trends and volatility.
- Make Informed Decisions: Use the insights gained to inform your trading strategy.
Practical Examples
Example 1: Moving Averages
Combine a 50-day and a 200-day moving average to identify long-term trends. Look for crossovers as signals for potential buy or sell opportunities.
Example 2: RSI
Adjust the RSI period to 20 days for a more sensitive reading. Combine it with volume indicators to confirm the strength of a trend.
The Importance of Continuous Learning
Staying Updated
The financial markets are constantly evolving. Staying informed about new techniques and continuously refining your approach is essential for success.
Educational Resources
Martin Pring offers a wealth of resources, including books, seminars, and online courses, to help traders stay ahead of the curve.
Conclusion
Martin Pring’s innovative approach to deriving new insights from old indicators provides traders with powerful tools to enhance their trading strategies. By reinterpreting traditional indicators like moving averages, RSI, Bollinger Bands, and MACD, Pring offers fresh perspectives that can lead to more informed trading decisions. Embracing these techniques and continuously learning can significantly improve trading performance.
FAQs
1. What are Martin Pring’s contributions to technical analysis?
Martin Pring has developed innovative indicators and analysis techniques that have become essential tools for traders. His work focuses on extracting new insights from traditional indicators.
2. How can I apply Pring’s methods to my trading strategy?
Start by choosing an indicator, adjusting its parameters as suggested by Pring, and combining it with other indicators for confirmation. Analyze market conditions and use the insights to make informed trading decisions.
3. Why are traditional indicators still relevant?
Traditional indicators have stood the test of time because they provide valuable insights into market behavior. Understanding their strengths and limitations is crucial for effective trading.
4. What is the importance of continuous learning in trading?
The financial markets are constantly evolving, making it essential for traders to stay informed about new techniques and continuously refine their approach to maintain a competitive edge.
5. Where can I find educational resources by Martin Pring?
Martin Pring offers a variety of resources, including books, seminars, and online courses, which can be found on his official website and other educational platforms.
Be the first to review “Getting New Insights from Old Indicators with Martin Pring”
You must be logged in to post a review.
Related products

Forex Trading
Original price was: $499.00.$15.00Current price is: $15.00.

Original price was: $649.00.$20.00Current price is: $20.00.

Original price was: $1,800.00.$54.00Current price is: $54.00.

Original price was: $700.00.$39.00Current price is: $39.00.

Original price was: $497.00.$11.00Current price is: $11.00.

Forex Trading
Original price was: $239.00.$8.00Current price is: $8.00.

Original price was: $299.00.$8.00Current price is: $8.00.

Original price was: $497.00.$31.00Current price is: $31.00.

Original price was: $695.00.$41.00Current price is: $41.00.

Original price was: $310.00.$23.00Current price is: $23.00.

Forex Trading
Original price was: $1,098.00.$39.00Current price is: $39.00.
Forex Trading
Original price was: $799.00.$15.00Current price is: $15.00.

Forex Trading
Original price was: $2,997.00.$23.00Current price is: $23.00.

Forex Trading
Quantamentals – The Next Great Forefront Of Trading and Investing with Trading Markets
Original price was: $1,495.00.$8.00Current price is: $8.00.
Original price was: $997.00.$8.00Current price is: $8.00.

Original price was: $999.00.$5.00Current price is: $5.00.

Forex Trading
The Complete Guide to Multiple Time Frame Analysis & Reading Price Action with Aiman Almansoori
Original price was: $1,399.00.$13.00Current price is: $13.00.

Forex Trading
Original price was: $125.00.$17.00Current price is: $17.00.

Forex Trading
Original price was: $500.00.$5.00Current price is: $5.00.
Original price was: $1,200.00.$23.00Current price is: $23.00.
Reviews
There are no reviews yet.