-
×
 Elliott Wave Indicator Suite for ThinkorSwim
1 × $15.00
Elliott Wave Indicator Suite for ThinkorSwim
1 × $15.00 -
×
 Secrets of the Darvas Trading System
1 × $6.00
Secrets of the Darvas Trading System
1 × $6.00 -
×
 The FX Swing Trading Blueprint with Swing FX
1 × $6.00
The FX Swing Trading Blueprint with Swing FX
1 × $6.00 -
×
 Elliott Wave Forex Course
1 × $6.00
Elliott Wave Forex Course
1 × $6.00 -
×
 Neowave. Taking Elliott Wave into the 21st Century with Glenn Neely
1 × $6.00
Neowave. Taking Elliott Wave into the 21st Century with Glenn Neely
1 × $6.00 -
×
 How to Trade Diagonal Triangles. Superior Risk Reward Trade Setups
1 × $6.00
How to Trade Diagonal Triangles. Superior Risk Reward Trade Setups
1 × $6.00 -
×
 Futures Spreads Crash Course with Base Camp Trading
1 × $54.00
Futures Spreads Crash Course with Base Camp Trading
1 × $54.00 -
×
 Profit Trading VIX Options Course with Don Kaufman
1 × $6.00
Profit Trading VIX Options Course with Don Kaufman
1 × $6.00 -
×
 Electronic Trading "TNT" IV Tips Tricks and Other Trading Stuff with Joe Ross & Mark Cherlin
1 × $6.00
Electronic Trading "TNT" IV Tips Tricks and Other Trading Stuff with Joe Ross & Mark Cherlin
1 × $6.00 -
×
 Astro Cycles with Larry Pesavento
1 × $6.00
Astro Cycles with Larry Pesavento
1 × $6.00 -
×
 Fish Forex Robot 4G
1 × $6.00
Fish Forex Robot 4G
1 × $6.00 -
×
 New York Institute of Finance – Futures. A Personal Seminar
1 × $6.00
New York Institute of Finance – Futures. A Personal Seminar
1 × $6.00 -
×
 Fixed-Income Securities: Valuation, Risk Management and Portfolio Strategies - Lionel Martellini, Philippe Priaulet & Stéphane Priaulet
1 × $6.00
Fixed-Income Securities: Valuation, Risk Management and Portfolio Strategies - Lionel Martellini, Philippe Priaulet & Stéphane Priaulet
1 × $6.00 -
×
 Kaizen On-Demand By Candle Charts
1 × $6.00
Kaizen On-Demand By Candle Charts
1 × $6.00 -
×
 Currency Strategy with Callum Henderson
1 × $6.00
Currency Strategy with Callum Henderson
1 × $6.00 -
×
 SQX Mentorship with Tip Toe Hippo
1 × $23.00
SQX Mentorship with Tip Toe Hippo
1 × $23.00 -
×
 The Market Maker’s Edge with Josh Lukeman
1 × $6.00
The Market Maker’s Edge with Josh Lukeman
1 × $6.00 -
×
 Trading MasterMind Course
1 × $23.00
Trading MasterMind Course
1 × $23.00 -
×
 Successful Stock Speculation (1922) with John James
1 × $6.00
Successful Stock Speculation (1922) with John James
1 × $6.00 -
×
 Master Trader Course
1 × $23.00
Master Trader Course
1 × $23.00 -
×
 An Introduction to Market Risk Measurement with Kevin Dowd
1 × $6.00
An Introduction to Market Risk Measurement with Kevin Dowd
1 × $6.00 -
×
 Day Trading and Swing Trading Futures with Price Action by Humberto Malaspina
1 × $5.00
Day Trading and Swing Trading Futures with Price Action by Humberto Malaspina
1 × $5.00 -
×
 Rounded Bottom Breakout Multimedia Course
1 × $31.00
Rounded Bottom Breakout Multimedia Course
1 × $31.00 -
×
 Krautgap By John Piper
1 × $6.00
Krautgap By John Piper
1 × $6.00 -
×
 Hands On Training Bundle with Talkin Options
1 × $23.00
Hands On Training Bundle with Talkin Options
1 × $23.00 -
×
 Advanced Trader with Nikos Trading Academy
1 × $5.00
Advanced Trader with Nikos Trading Academy
1 × $5.00 -
×
 Short Swing Trading v6.0 with David Smith
1 × $6.00
Short Swing Trading v6.0 with David Smith
1 × $6.00 -
×
 The Loyalty Effect with Frederick Reichheld
1 × $6.00
The Loyalty Effect with Frederick Reichheld
1 × $6.00 -
×
 Elliott Flat Waves CD with David Elliott
1 × $6.00
Elliott Flat Waves CD with David Elliott
1 × $6.00 -
×
 Developing Mindfulness: The Observer of Thought with Traders State Of Mind
1 × $6.00
Developing Mindfulness: The Observer of Thought with Traders State Of Mind
1 × $6.00 -
×
 Complete Price Action, Volume Profile and Orderflow Trading Bundle with Price Action Volume Trader
1 × $78.00
Complete Price Action, Volume Profile and Orderflow Trading Bundle with Price Action Volume Trader
1 × $78.00 -
×
 All About Dividend Investing with Don Schreiber & Gary Stroik
1 × $6.00
All About Dividend Investing with Don Schreiber & Gary Stroik
1 × $6.00 -
×
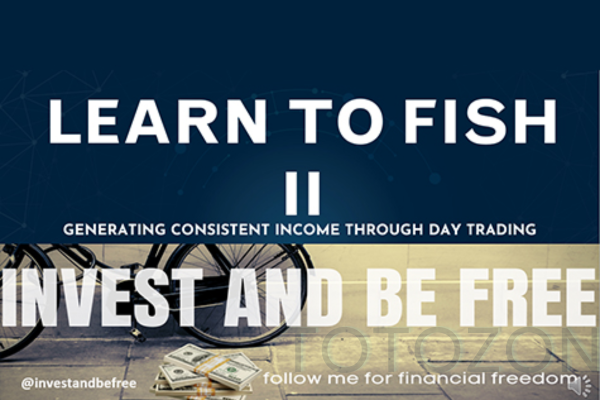 Learn To Fish Part II - Generating Consistent Income Through Day Trading with Daniel
1 × $6.00
Learn To Fish Part II - Generating Consistent Income Through Day Trading with Daniel
1 × $6.00 -
×
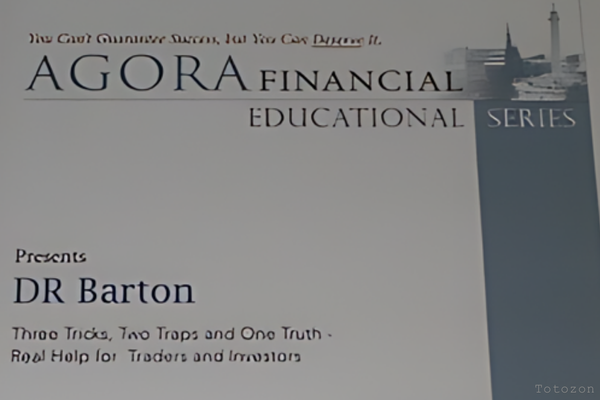 Three Tricks, Two Traps, One Truth Real Help for Traders and Investors with D.R.Barton
1 × $6.00
Three Tricks, Two Traps, One Truth Real Help for Traders and Investors with D.R.Barton
1 × $6.00 -
×
 Read The Market RTM Master Trader Course + Journals
1 × $5.00
Read The Market RTM Master Trader Course + Journals
1 × $5.00 -
×
 Forex Robotron (Unlocked)
1 × $6.00
Forex Robotron (Unlocked)
1 × $6.00 -
×
 The 80% Solution S&P Systems with Bruce Babcock
1 × $6.00
The 80% Solution S&P Systems with Bruce Babcock
1 × $6.00 -
×
 FestX Main Online video Course with Clint Fester
1 × $5.00
FestX Main Online video Course with Clint Fester
1 × $5.00 -
×
 Best of the Best: Collars with Amy Meissner & Scott Ruble
1 × $15.00
Best of the Best: Collars with Amy Meissner & Scott Ruble
1 × $15.00 -
×
 SATYA 2 - Online Immersion - January 2023 By Tias Little
1 × $225.00
SATYA 2 - Online Immersion - January 2023 By Tias Little
1 × $225.00 -
×
 Constellation Software
1 × $85.00
Constellation Software
1 × $85.00 -
×
 Complete Best Practices - Weekly Options Income Trading System with Weekly Options Academy
1 × $23.00
Complete Best Practices - Weekly Options Income Trading System with Weekly Options Academy
1 × $23.00 -
×
 The New Science of Asset Allocation with Thomas Schneeweis
1 × $6.00
The New Science of Asset Allocation with Thomas Schneeweis
1 × $6.00 -
×
 Secrets of a Winning Trader with Gareth Soloway
1 × $871.00
Secrets of a Winning Trader with Gareth Soloway
1 × $871.00 -
×
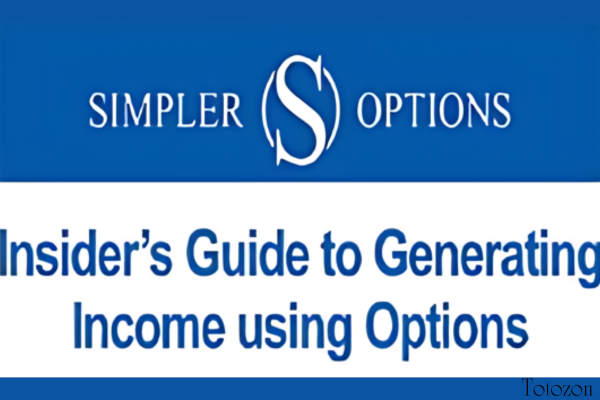 Simpler Options - Insider’s Guide to Generating Income using Options Strategies Course (Oct 2014)
1 × $6.00
Simpler Options - Insider’s Guide to Generating Income using Options Strategies Course (Oct 2014)
1 × $6.00 -
×
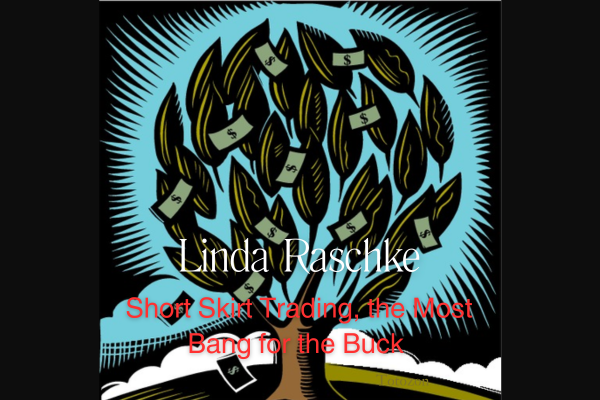 Short Skirt Trading, the Most Bang for the Buck with Linda Raschke
1 × $6.00
Short Skirt Trading, the Most Bang for the Buck with Linda Raschke
1 × $6.00 -
×
 Forex Trading with Ed Ponsi
1 × $6.00
Forex Trading with Ed Ponsi
1 × $6.00 -
×
 The 3 Dimensional Trading Breakthrough with Brian Schad
1 × $6.00
The 3 Dimensional Trading Breakthrough with Brian Schad
1 × $6.00 -
×
 The Great Reflation with Anthony Boeckh
1 × $6.00
The Great Reflation with Anthony Boeckh
1 × $6.00 -
×
 Technical & Fundamental Courses with Diamant Capital
1 × $5.00
Technical & Fundamental Courses with Diamant Capital
1 × $5.00 -
×
 Dan Sheridan Delta Force
1 × $6.00
Dan Sheridan Delta Force
1 × $6.00 -
×
 Planting Landmines for Explosive Profits with Dave Slingshot
1 × $6.00
Planting Landmines for Explosive Profits with Dave Slingshot
1 × $6.00 -
×
 The Risk-Wise Investor: How to Better Understand and Manage Risk with Michael Carpenter
1 × $6.00
The Risk-Wise Investor: How to Better Understand and Manage Risk with Michael Carpenter
1 × $6.00 -
×
 Complete Guide to Online Stock Market Investing (2nd Edition) with Alexander Davidson
1 × $6.00
Complete Guide to Online Stock Market Investing (2nd Edition) with Alexander Davidson
1 × $6.00 -
×
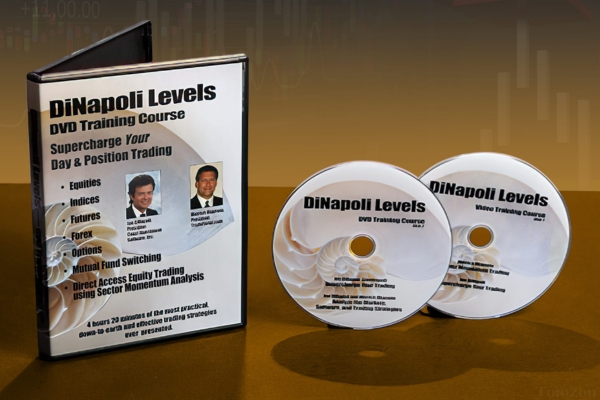 DiNapoli Levels Training Course with Joe DiNapoli & Merrick Okamoto
1 × $6.00
DiNapoli Levels Training Course with Joe DiNapoli & Merrick Okamoto
1 × $6.00 -
×
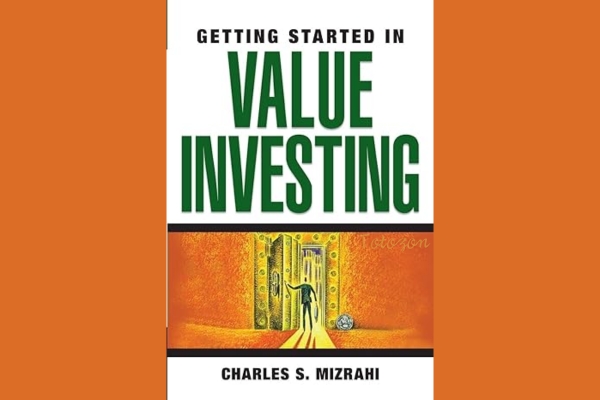 Getting Started in Value Investing with Charles Mizrahi
1 × $6.00
Getting Started in Value Investing with Charles Mizrahi
1 × $6.00 -
×
 DAY TRADING COURSE 2018
1 × $6.00
DAY TRADING COURSE 2018
1 × $6.00 -
×
 The Trading Blueprint with Brad Goh - The Trading Geek
1 × $5.00
The Trading Blueprint with Brad Goh - The Trading Geek
1 × $5.00 -
×
 Hedges on Hedge Funds: How to Successfully Analyze and Select an Investment with James Hedges
1 × $6.00
Hedges on Hedge Funds: How to Successfully Analyze and Select an Investment with James Hedges
1 × $6.00 -
×
 How to be a Sector Investor with Larry Hungerford & Steve Hungerford
1 × $4.00
How to be a Sector Investor with Larry Hungerford & Steve Hungerford
1 × $4.00 -
×
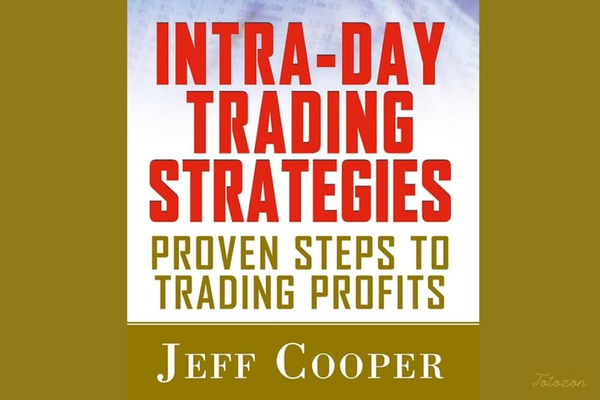 Intra-day Trading Strategies. Proven Steps to Trading Profits
1 × $6.00
Intra-day Trading Strategies. Proven Steps to Trading Profits
1 × $6.00 -
×
 Modern Portfolio Theory and Investment Analysis (7th Edition) with Edwin Elton, Martin Gruber, Stephen Brown & William Goetzmann
1 × $6.00
Modern Portfolio Theory and Investment Analysis (7th Edition) with Edwin Elton, Martin Gruber, Stephen Brown & William Goetzmann
1 × $6.00 -
×
 The Reducing Risk and Maximizing Returns Blueprint (Atomic Hedge Strategy) with Don Kaufman
1 × $6.00
The Reducing Risk and Maximizing Returns Blueprint (Atomic Hedge Strategy) with Don Kaufman
1 × $6.00 -
×
 Advanced Trading Course with DovyFX
1 × $5.00
Advanced Trading Course with DovyFX
1 × $5.00 -
×
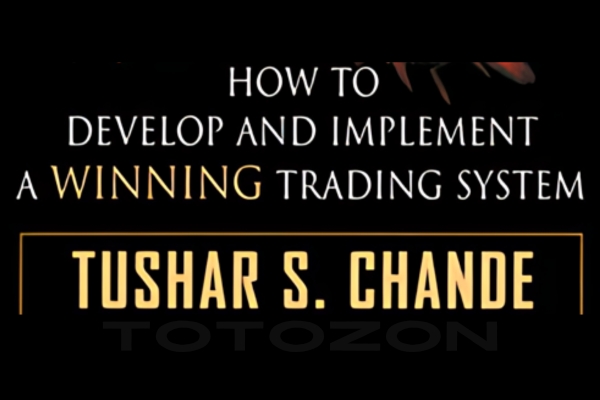 Developing & Implementing Pattern-Based Trading Systems with Tushar S.Chande
1 × $6.00
Developing & Implementing Pattern-Based Trading Systems with Tushar S.Chande
1 × $6.00 -
×
 The Astrology of the Old Testament or The Lost World Regained with Karl Anderson
1 × $6.00
The Astrology of the Old Testament or The Lost World Regained with Karl Anderson
1 × $6.00 -
×
 Small Stocks for Big Profits: Generate Spectacular Returns by Investing in Up-and-Coming Companies with George Angell
1 × $6.00
Small Stocks for Big Profits: Generate Spectacular Returns by Investing in Up-and-Coming Companies with George Angell
1 × $6.00 -
×
 AI For Traders with Trading Markets
1 × $31.00
AI For Traders with Trading Markets
1 × $31.00 -
×
 Market Maker Strategy Video Course with Fractal Flow Pro
1 × $6.00
Market Maker Strategy Video Course with Fractal Flow Pro
1 × $6.00 -
×
 A+ Setups Big Caps Options with Jtrader
1 × $6.00
A+ Setups Big Caps Options with Jtrader
1 × $6.00 -
×
 Investment Science with David G.Luenberger
1 × $6.00
Investment Science with David G.Luenberger
1 × $6.00 -
×
 P.A.T Trading Course (Low Video Quality) with Martin Cole
1 × $6.00
P.A.T Trading Course (Low Video Quality) with Martin Cole
1 × $6.00 -
×
 Investing Online for Dummies (5th Edition) with Kathleen Sindell
1 × $6.00
Investing Online for Dummies (5th Edition) with Kathleen Sindell
1 × $6.00 -
×
 Practical Elliott Wave Trading Strategies with Robert Miner
1 × $6.00
Practical Elliott Wave Trading Strategies with Robert Miner
1 × $6.00 -
×
 The Litle Book of Bulletproof Investing
1 × $6.00
The Litle Book of Bulletproof Investing
1 × $6.00 -
×
 Making Sense of Price Action: Price Action Profits with Scott Foster
1 × $54.00
Making Sense of Price Action: Price Action Profits with Scott Foster
1 × $54.00 -
×
 Show Tax Losses On Your 1040, Yet Show Lenders You Are Making Money! with Information Services Unlimited
1 × $6.00
Show Tax Losses On Your 1040, Yet Show Lenders You Are Making Money! with Information Services Unlimited
1 × $6.00 -
×
 Pentagonal Time Cycle Theory
1 × $6.00
Pentagonal Time Cycle Theory
1 × $6.00 -
×
 EZ2 Trade Charting Collection eSignal (ez2tradesoftware.com) - Raghee Horner
1 × $6.00
EZ2 Trade Charting Collection eSignal (ez2tradesoftware.com) - Raghee Horner
1 × $6.00 -
×
 The Art of the Trade: What I Learned (and Lost) Trading the Chicago Futures Markets - Jason Alan Jankovsky
1 × $6.00
The Art of the Trade: What I Learned (and Lost) Trading the Chicago Futures Markets - Jason Alan Jankovsky
1 × $6.00 -
×
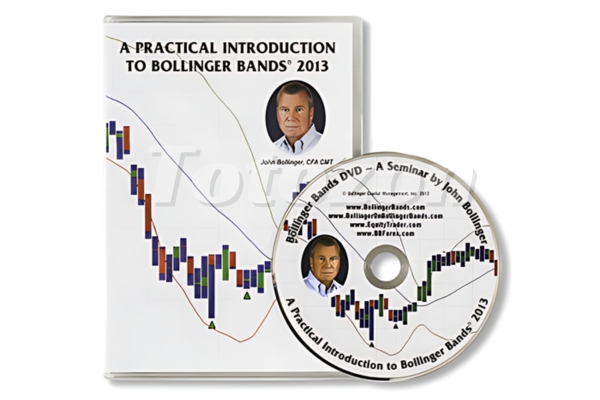 Practical Introduction to Bollinger Bands 2013
1 × $6.00
Practical Introduction to Bollinger Bands 2013
1 × $6.00 -
×
 Street-Smart Chart Reading – Volume 2 – Digging Deeper with Donald G.Worden
1 × $6.00
Street-Smart Chart Reading – Volume 2 – Digging Deeper with Donald G.Worden
1 × $6.00 -
×
 Strategy Factory Workshop with Kevin Davey - KJ Trading Systems
1 × $5.00
Strategy Factory Workshop with Kevin Davey - KJ Trading Systems
1 × $5.00 -
×
 Trading to Win (Seminar WorkBook 2003) with Bruce Gilmore
1 × $6.00
Trading to Win (Seminar WorkBook 2003) with Bruce Gilmore
1 × $6.00 -
×
 Dividend Key Home Study Course with Hubb Financial
1 × $6.00
Dividend Key Home Study Course with Hubb Financial
1 × $6.00 -
×
 Confessions of a Street Addict with James Cramer
1 × $6.00
Confessions of a Street Addict with James Cramer
1 × $6.00 -
×
 The Market Geometry Basic Seminar DVD with Market Geometry
1 × $31.00
The Market Geometry Basic Seminar DVD with Market Geometry
1 × $31.00 -
×
 Volatility Position Risk Management with Cynthia Kase
1 × $6.00
Volatility Position Risk Management with Cynthia Kase
1 × $6.00 -
×
 The EAP Training Program (Apr 2019)
1 × $6.00
The EAP Training Program (Apr 2019)
1 × $6.00 -
×
 Fast Track Course with Tradelikerocket
1 × $233.00
Fast Track Course with Tradelikerocket
1 × $233.00 -
×
 Fibonacci – CCI Workshop Recording Series (2006 & 2008)
1 × $6.00
Fibonacci – CCI Workshop Recording Series (2006 & 2008)
1 × $6.00 -
×
 0 DTE Options Trading Workshop with Aeromir Corporation
1 × $15.00
0 DTE Options Trading Workshop with Aeromir Corporation
1 × $15.00
Practical Introduction to Bollinger Bands 2013
$6.00
File Size: Coming soon!
Delivery Time: 1–12 hours
Media Type: Online Course
Practical Introduction to Bollinger Bands 2013
Understanding Bollinger Bands
What Are Bollinger Bands?
Bollinger Bands are a popular technical analysis tool developed by John Bollinger in the 1980s. They consist of a middle band, which is a simple moving average, and two outer bands that are standard deviations away from the middle band. These bands help traders understand volatility and identify potential buy and sell signals.
Importance in Technical Analysis
Bollinger Bands are essential for traders because they provide a visual representation of price volatility and potential market reversals. They can be applied to various asset classes, including stocks, commodities, and currencies.
Components of Bollinger Bands
The Middle Band
The middle band is typically a 20-day simple moving average (SMA). This average smooths out price data, providing a central value around which the upper and lower bands are calculated.
The Upper and Lower Bands
The upper and lower bands are usually set two standard deviations away from the middle band. These bands expand and contract based on market volatility, offering insights into price movements.
Standard Deviation
Standard deviation measures the dispersion of data from its mean. In Bollinger Bands, it helps determine the distance between the upper and lower bands and the middle band.
Calculating Bollinger Bands
Step-by-Step Calculation
- Calculate the 20-day SMA: Add the closing prices of the past 20 days and divide by 20.
- Determine the standard deviation: Calculate the standard deviation of the same 20-day period.
- Upper Band: Middle Band + (2 * Standard Deviation)
- Lower Band: Middle Band – (2 * Standard Deviation)
Example Calculation
If the 20-day SMA is $100 and the standard deviation is $5, the upper band would be $110 ($100 + (2 * $5)) and the lower band would be $90 ($100 – (2 * $5)).
Using Bollinger Bands in Trading
Identifying Trends
Bollinger Bands can help identify the direction of a trend. When the price consistently touches the upper band, it indicates an uptrend. Conversely, touching the lower band suggests a downtrend.
Overbought and Oversold Conditions
When the price moves near the upper band, the asset might be overbought, signaling a potential sell. If the price approaches the lower band, it might be oversold, indicating a potential buy.
Breakouts and Volatility
Bollinger Bands can also signal breakouts. When the bands squeeze together, it indicates low volatility and a potential breakout. A sudden widening of the bands suggests increased volatility and potential trading opportunities.
Practical Applications
Trading Strategies
Bollinger Bounce
This strategy is based on the idea that the price will revert to the mean. When the price touches the upper band, traders might consider selling. Conversely, touching the lower band might be a buy signal.
Bollinger Squeeze
The Bollinger Squeeze strategy focuses on periods of low volatility. When the bands narrow, it suggests that a breakout is imminent. Traders can prepare to enter positions in the direction of the breakout.
Combining with Other Indicators
Bollinger Bands can be combined with other technical indicators like the Relative Strength Index (RSI) or Moving Average Convergence Divergence (MACD) to enhance trading decisions.
Advantages of Bollinger Bands
Visual Clarity
Bollinger Bands provide a clear visual representation of price volatility, making it easier for traders to identify potential buy and sell signals.
Flexibility
They can be used in various markets and on different time frames, making them versatile tools for traders of all styles.
Reliability
When used correctly, Bollinger Bands can be reliable indicators of market trends and potential reversals.
Limitations of Bollinger Bands
Not a Standalone Indicator
Bollinger Bands should not be used in isolation. They are most effective when combined with other technical analysis tools.
False Signals
Like all technical indicators, Bollinger Bands can produce false signals. Traders should use them with caution and confirm signals with additional analysis.
Tips for Using Bollinger Bands
Customize Settings
Traders can adjust the period and standard deviation settings of Bollinger Bands to suit their trading style and the specific asset being traded.
Monitor Market Conditions
Regularly review market conditions and adjust your trading strategy accordingly. Bollinger Bands are more effective in certain market environments.
Practice and Patience
Successful trading with Bollinger Bands requires practice and patience. Use a demo account to test strategies before applying them to live trading.
Conclusion
Bollinger Bands are a powerful tool for traders, offering insights into market volatility and potential trading opportunities. By understanding their components, calculations, and applications, traders can effectively incorporate Bollinger Bands into their trading strategies to improve their decision-making and profitability.
FAQs
What are Bollinger Bands used for?
Bollinger Bands are used to measure market volatility and identify potential buy and sell signals based on price movements relative to the bands.
How do you calculate Bollinger Bands?
Bollinger Bands are calculated using a 20-day simple moving average and adding/subtracting two standard deviations to create the upper and lower bands.
Can Bollinger Bands be used for day trading?
Yes, Bollinger Bands can be used for day trading, as well as swing trading and long-term investing, due to their flexibility in different time frames.
What is the Bollinger Squeeze?
The Bollinger Squeeze occurs when the bands narrow, indicating low volatility and a potential breakout. It suggests that traders should prepare for a possible significant price move.
Should Bollinger Bands be used with other indicators?
Yes, Bollinger Bands are most effective when used in conjunction with other technical indicators, such as RSI or MACD, to confirm signals and enhance trading decisions.
Be the first to review “Practical Introduction to Bollinger Bands 2013”
You must be logged in to post a review.
Related products

Original price was: $2,120.00.$15.00Current price is: $15.00.

Original price was: $1,800.00.$54.00Current price is: $54.00.
Forex Trading
Original price was: $999.00.$15.00Current price is: $15.00.

Original price was: $299.00.$8.00Current price is: $8.00.

Forex Trading
Original price was: $397.00.$31.00Current price is: $31.00.
Forex Trading
Original price was: $697.00.$5.00Current price is: $5.00.

Original price was: $497.00.$31.00Current price is: $31.00.
Forex Trading
Original price was: $2,995.00.$31.00Current price is: $31.00.

Original price was: $999.00.$5.00Current price is: $5.00.

Original price was: $4,995.00.$15.00Current price is: $15.00.

Forex Trading
Original price was: $1,098.00.$39.00Current price is: $39.00.

Forex Trading
Original price was: $499.00.$15.00Current price is: $15.00.
Forex Trading
Original price was: $2,997.00.$23.00Current price is: $23.00.

Original price was: $310.00.$23.00Current price is: $23.00.

Forex Trading
Original price was: $249.00.$15.00Current price is: $15.00.

Original price was: $695.00.$41.00Current price is: $41.00.

Original price was: $649.00.$20.00Current price is: $20.00.

Forex Trading
Original price was: $125.00.$17.00Current price is: $17.00.
Original price was: $799.00.$15.00Current price is: $15.00.

Forex Trading
Original price was: $799.00.$15.00Current price is: $15.00.

Reviews
There are no reviews yet.