-
×
 The Adventures of the Cycle Hunter. The Cyclist with Craig Bttlc
1 × $6.00
The Adventures of the Cycle Hunter. The Cyclist with Craig Bttlc
1 × $6.00 -
×
 Forex Robotron (Unlocked)
1 × $6.00
Forex Robotron (Unlocked)
1 × $6.00 -
×
 Opening Range Breakout Indicator for ThinkorSwim
1 × $6.00
Opening Range Breakout Indicator for ThinkorSwim
1 × $6.00 -
×
 Stock Trader`s Almanac 2012 with Jeffrey Hirsch & Yale Hirsch
1 × $6.00
Stock Trader`s Almanac 2012 with Jeffrey Hirsch & Yale Hirsch
1 × $6.00 -
×
 Stock Market Rules (3rd Ed.) with Michael Sheimo
1 × $6.00
Stock Market Rules (3rd Ed.) with Michael Sheimo
1 × $6.00 -
×
 Harmonic Elliott Wave: The Case for Modification of R. N. Elliott's Impulsive Wave Structure with Ian Copsey
1 × $6.00
Harmonic Elliott Wave: The Case for Modification of R. N. Elliott's Impulsive Wave Structure with Ian Copsey
1 × $6.00 -
×
 Investing Smart. How to Pick Stocks with Investors Business Daily By Dhun H.Sethna
1 × $4.00
Investing Smart. How to Pick Stocks with Investors Business Daily By Dhun H.Sethna
1 × $4.00 -
×
 Complete Trading Course with Sean Dekmar
1 × $5.00
Complete Trading Course with Sean Dekmar
1 × $5.00 -
×
 Investment Performance Measurement with Bruce Feibel
1 × $6.00
Investment Performance Measurement with Bruce Feibel
1 × $6.00 -
×
 Optimize Funding Program 2023 with Solo Network Courses
1 × $13.00
Optimize Funding Program 2023 with Solo Network Courses
1 × $13.00 -
×
 The Complete Guide to Multiple Time Frame Analysis & Reading Price Action with Aiman Almansoori
1 × $13.00
The Complete Guide to Multiple Time Frame Analysis & Reading Price Action with Aiman Almansoori
1 × $13.00 -
×
 My Forex League - The Course
1 × $5.00
My Forex League - The Course
1 × $5.00 -
×
 Profits In PJs - Profitably Selling Stock Options for Passive Income with Cam Tucker
1 × $6.00
Profits In PJs - Profitably Selling Stock Options for Passive Income with Cam Tucker
1 × $6.00 -
×
 TradeCraft: Your Path to Peak Performance Trading By Adam Grimes
1 × $15.00
TradeCraft: Your Path to Peak Performance Trading By Adam Grimes
1 × $15.00 -
×
 How To Be a Profitable Forex Trader with Corey Halliday
1 × $6.00
How To Be a Profitable Forex Trader with Corey Halliday
1 × $6.00 -
×
 Lazy Gap Trader Course with David Frost
1 × $6.00
Lazy Gap Trader Course with David Frost
1 × $6.00 -
×
 Street-Smart Chart Reading – Volume 1 – The Rudiments with Donald G.Worden
1 × $6.00
Street-Smart Chart Reading – Volume 1 – The Rudiments with Donald G.Worden
1 × $6.00 -
×
 Passages To Profitability: A Comprehensive Guide To Channel Trading with Professor Jeff Bierman, CMT
1 × $6.00
Passages To Profitability: A Comprehensive Guide To Channel Trading with Professor Jeff Bierman, CMT
1 × $6.00 -
×
 Stock Trading Simplified - 3 DVD + PDF Workbook with John Person
1 × $6.00
Stock Trading Simplified - 3 DVD + PDF Workbook with John Person
1 × $6.00 -
×
 Option Insanity Strategy with PDS Trader
1 × $69.00
Option Insanity Strategy with PDS Trader
1 × $69.00 -
×
 D.A.T.E. Unlock Your Trading DNA Worskshop with Geoff Bysshe
1 × $6.00
D.A.T.E. Unlock Your Trading DNA Worskshop with Geoff Bysshe
1 × $6.00 -
×
 Trading The E-Minis for a Living with Don Miller
1 × $6.00
Trading The E-Minis for a Living with Don Miller
1 × $6.00 -
×
 A Process for Prudential Institutional Investment with Bancroft, Caldwell, McSweeny
1 × $6.00
A Process for Prudential Institutional Investment with Bancroft, Caldwell, McSweeny
1 × $6.00 -
×
 WondaFX Signature Strategy with WondaFX
1 × $5.00
WondaFX Signature Strategy with WondaFX
1 × $5.00 -
×
 Cash In On Chaos with Hans Hannula
1 × $6.00
Cash In On Chaos with Hans Hannula
1 × $6.00 -
×
 TRAING IRON CONDORS IN ANY ENVIRONMENT with Sheridan Options Mentoring
1 × $15.00
TRAING IRON CONDORS IN ANY ENVIRONMENT with Sheridan Options Mentoring
1 × $15.00 -
×
 Candlestick Charting Explained with Greg Morris
1 × $8.00
Candlestick Charting Explained with Greg Morris
1 × $8.00 -
×
 Strike Zone Strategy 2.0 Elite Package with Joe Rokop
1 × $39.00
Strike Zone Strategy 2.0 Elite Package with Joe Rokop
1 × $39.00 -
×
 SATYA 2 - Online Immersion - January 2023 By Tias Little
1 × $225.00
SATYA 2 - Online Immersion - January 2023 By Tias Little
1 × $225.00 -
×
 Dynamic Gann Levels with Don Fisher
1 × $6.00
Dynamic Gann Levels with Don Fisher
1 × $6.00 -
×
 Deep Reinforcement Learning in Trading with Dr. Thomas Starke
1 × $62.00
Deep Reinforcement Learning in Trading with Dr. Thomas Starke
1 × $62.00 -
×
 The Complete Value Investing Course (Updated 2019) with Wealthy Education
1 × $6.00
The Complete Value Investing Course (Updated 2019) with Wealthy Education
1 × $6.00 -
×
 The 4 Horsemen CD with David Elliott
1 × $6.00
The 4 Horsemen CD with David Elliott
1 × $6.00 -
×
 Market Risk Analysis, Volume IV, Value at Risk Models with Carol Alexander
1 × $6.00
Market Risk Analysis, Volume IV, Value at Risk Models with Carol Alexander
1 × $6.00 -
×
 Algo Wizard Essentials Course with Srategy Quant
1 × $13.00
Algo Wizard Essentials Course with Srategy Quant
1 × $13.00 -
×
 Electronic Day Traders' Secrets: Learn From the Best of the Best DayTraders with Burton Friedfertig
1 × $6.00
Electronic Day Traders' Secrets: Learn From the Best of the Best DayTraders with Burton Friedfertig
1 × $6.00 -
×
 The Aime Workshop with Clay Marafiote
1 × $6.00
The Aime Workshop with Clay Marafiote
1 × $6.00 -
×
 How to avoid the GAP
1 × $6.00
How to avoid the GAP
1 × $6.00 -
×
 RiskDoctor RD1 – Introduction to Options Trading the RiskDoctor Way with Charles Cottle
1 × $6.00
RiskDoctor RD1 – Introduction to Options Trading the RiskDoctor Way with Charles Cottle
1 × $6.00 -
×
 The Kiloby Inquiries Online with Scott Kiloby
1 × $39.00
The Kiloby Inquiries Online with Scott Kiloby
1 × $39.00 -
×
 How to Trade Stock Options Course
1 × $6.00
How to Trade Stock Options Course
1 × $6.00 -
×
 The Amazing Common Sense Guide To Investment Success with John Thomchick
1 × $6.00
The Amazing Common Sense Guide To Investment Success with John Thomchick
1 × $6.00 -
×
 Squeeze the Markets with Markay Latimer
1 × $6.00
Squeeze the Markets with Markay Latimer
1 × $6.00 -
×
 How I Trade the QQQs with Don Miller
1 × $6.00
How I Trade the QQQs with Don Miller
1 × $6.00 -
×
 The Crash of 1997 (Article) with Hans Hannula
1 × $6.00
The Crash of 1997 (Article) with Hans Hannula
1 × $6.00 -
×
 Hedge Fund Market Wizards: How Winning Traders Win with Jack Schwager
1 × $6.00
Hedge Fund Market Wizards: How Winning Traders Win with Jack Schwager
1 × $6.00 -
×
 On Board Fanta Sea One Seminar with Felix Homogratus
1 × $6.00
On Board Fanta Sea One Seminar with Felix Homogratus
1 × $6.00 -
×
 Forex Project Advanced Course with Tyler Crowell
1 × $5.00
Forex Project Advanced Course with Tyler Crowell
1 × $5.00 -
×
 Trading Short TermSame Day Trades Sep 2023 with Dan Sheridan & Mark Fenton - Sheridan Options Mentoring
1 × $31.00
Trading Short TermSame Day Trades Sep 2023 with Dan Sheridan & Mark Fenton - Sheridan Options Mentoring
1 × $31.00 -
×
 Foolproof Forex Trading with Louise Woof
1 × $6.00
Foolproof Forex Trading with Louise Woof
1 × $6.00 -
×
 Sniper Trading System for Forex with Chris Capre
1 × $4.00
Sniper Trading System for Forex with Chris Capre
1 × $4.00 -
×
 Sector Rotation & Market Timing with Frank Barbera
1 × $6.00
Sector Rotation & Market Timing with Frank Barbera
1 × $6.00 -
×
 Master Trader with InvestingSimple
1 × $15.00
Master Trader with InvestingSimple
1 × $15.00 -
×
 Pattern Trader Pro with ForexStore
1 × $6.00
Pattern Trader Pro with ForexStore
1 × $6.00 -
×
 The City Traders Course with Andrew Lockwood
1 × $10.00
The City Traders Course with Andrew Lockwood
1 × $10.00 -
×
 Investment Valuation
1 × $6.00
Investment Valuation
1 × $6.00 -
×
 Gold XAUUSD Trading Strategy - The Gold Box with The Trading Guide
1 × $5.00
Gold XAUUSD Trading Strategy - The Gold Box with The Trading Guide
1 × $5.00 -
×
 Market Stalkers Level 1 - Swing trading school (2020)
1 × $8.00
Market Stalkers Level 1 - Swing trading school (2020)
1 × $8.00 -
×
 Pristine - Noble DraKoln – The Complete Liverpool Futures Seminar Series
1 × $6.00
Pristine - Noble DraKoln – The Complete Liverpool Futures Seminar Series
1 × $6.00 -
×
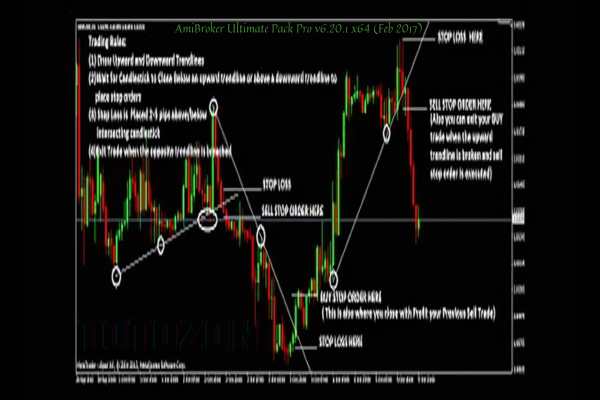 AmiBroker Ultimate Pack Pro v6.20.1 x64 (Feb 2017)
1 × $6.00
AmiBroker Ultimate Pack Pro v6.20.1 x64 (Feb 2017)
1 × $6.00 -
×
 Forex Strategy Course with Angel Traders
1 × $6.00
Forex Strategy Course with Angel Traders
1 × $6.00 -
×
 The Complete Guide to Option Selling, 2nd 2009 with James Cordier & Michael Gross
1 × $6.00
The Complete Guide to Option Selling, 2nd 2009 with James Cordier & Michael Gross
1 × $6.00 -
×
 Module II - Signature Trades with FX MindShift
1 × $6.00
Module II - Signature Trades with FX MindShift
1 × $6.00 -
×
 Mathematical Problems in Image Processing with Charles E.Chidume
1 × $6.00
Mathematical Problems in Image Processing with Charles E.Chidume
1 × $6.00 -
×
 Price Action Trading Manual 2010
1 × $6.00
Price Action Trading Manual 2010
1 × $6.00 -
×
 Behavioral Trading with Woody Dorsey
1 × $6.00
Behavioral Trading with Woody Dorsey
1 × $6.00 -
×
 FXJake Webinars with Walter Peters
1 × $6.00
FXJake Webinars with Walter Peters
1 × $6.00 -
×
 Rockwell Trading - Money Management - 2 DVDs
1 × $6.00
Rockwell Trading - Money Management - 2 DVDs
1 × $6.00 -
×
 Dynamic Trading Indicators with Mark W.Helweg, David C.Stendahl
1 × $6.00
Dynamic Trading Indicators with Mark W.Helweg, David C.Stendahl
1 × $6.00 -
×
 The Management of Equity Investments with Dimitris Chorafas
1 × $6.00
The Management of Equity Investments with Dimitris Chorafas
1 × $6.00 -
×
 High Powered Investing with Amine Bouchentouf
1 × $6.00
High Powered Investing with Amine Bouchentouf
1 × $6.00 -
×
 Technical Analysis for Long-Term Investors with Clay Allen
1 × $6.00
Technical Analysis for Long-Term Investors with Clay Allen
1 × $6.00 -
×
 PRO COURSE Order Flow Strategy with Gova Trading Academy
1 × $5.00
PRO COURSE Order Flow Strategy with Gova Trading Academy
1 × $5.00 -
×
 Forex Education Trading System (Video 469 MB)
1 × $23.00
Forex Education Trading System (Video 469 MB)
1 × $23.00 -
×
 Ichimoku Cloud Trading System Class with Jeff Bierman
1 × $6.00
Ichimoku Cloud Trading System Class with Jeff Bierman
1 × $6.00 -
×
 The Trading Vault with Anne-Marie Baiynd
1 × $54.00
The Trading Vault with Anne-Marie Baiynd
1 × $54.00 -
×
 Safety in the Market. Smarter Starter Pack 1st Edition
1 × $6.00
Safety in the Market. Smarter Starter Pack 1st Edition
1 × $6.00 -
×
 Learn how to trade Volatility 75 Index Technical Analysis with Patrick Muke
1 × $6.00
Learn how to trade Volatility 75 Index Technical Analysis with Patrick Muke
1 × $6.00 -
×
 George Wollsten: Expert Stock and Grain Trader with George Bayer
1 × $6.00
George Wollsten: Expert Stock and Grain Trader with George Bayer
1 × $6.00 -
×
 Kaizen On-Demand By Candle Charts
1 × $6.00
Kaizen On-Demand By Candle Charts
1 × $6.00 -
×
 SPIKED COLLARS (Dynamic Hedging)
1 × $15.00
SPIKED COLLARS (Dynamic Hedging)
1 × $15.00 -
×
 A Trader's Guide to Self-Discipline: Proven Techniques to Improve Trading Profits
1 × $6.00
A Trader's Guide to Self-Discipline: Proven Techniques to Improve Trading Profits
1 × $6.00 -
×
 TradeSafe Mechanical Trading System, Course, and Coaching
1 × $85.00
TradeSafe Mechanical Trading System, Course, and Coaching
1 × $85.00 -
×
 Better Trading with the Guppy Multiple Moving Average WorkBook with Daryl Guppy
1 × $6.00
Better Trading with the Guppy Multiple Moving Average WorkBook with Daryl Guppy
1 × $6.00 -
×
 Mastering Risk Modeling with Excel by Alastair Day
1 × $6.00
Mastering Risk Modeling with Excel by Alastair Day
1 × $6.00 -
×
 Stock Selection Course with Dave Landry
1 × $6.00
Stock Selection Course with Dave Landry
1 × $6.00 -
×
 Design for Six Sigma with Subir Chowdhury
1 × $6.00
Design for Six Sigma with Subir Chowdhury
1 × $6.00 -
×
 Stochastic Calculus with Alan Bain
1 × $6.00
Stochastic Calculus with Alan Bain
1 × $6.00 -
×
 Investing in 401k Plans with Cliffsnotes
1 × $6.00
Investing in 401k Plans with Cliffsnotes
1 × $6.00 -
×
 Divorcing the Dow: Using Revolutionary Market Indicators to Profit from the Stealth Boom Ahead - Jim Troup & Sharon Michalsky
1 × $6.00
Divorcing the Dow: Using Revolutionary Market Indicators to Profit from the Stealth Boom Ahead - Jim Troup & Sharon Michalsky
1 × $6.00 -
×
 Trading For A Living Course with Yvan Byeajee - Trading Composure
1 × $6.00
Trading For A Living Course with Yvan Byeajee - Trading Composure
1 × $6.00 -
×
 Preparing for the Worst: Incorporating Downside Risk in Stock Market Investments with Hrishikesh Vinod & Derrick Reagle
1 × $6.00
Preparing for the Worst: Incorporating Downside Risk in Stock Market Investments with Hrishikesh Vinod & Derrick Reagle
1 × $6.00 -
×
 Day Trading with Volume Profile and Orderflow - Price Action Volume Trader
1 × $6.00
Day Trading with Volume Profile and Orderflow - Price Action Volume Trader
1 × $6.00 -
×
 George Bayer Squarring the Circle for Excel
1 × $6.00
George Bayer Squarring the Circle for Excel
1 × $6.00 -
×
 Forex Trading For Beginners with John Jagerson - Investopedia Academy
1 × $6.00
Forex Trading For Beginners with John Jagerson - Investopedia Academy
1 × $6.00 -
×
 Guide to Winning with Automated Trading Systems with Jack Schwager
1 × $6.00
Guide to Winning with Automated Trading Systems with Jack Schwager
1 × $6.00 -
×
 How I Day Trade Course with Traderade
1 × $15.00
How I Day Trade Course with Traderade
1 × $15.00 -
×
 Computational Financial Mathematics with Mathematica
1 × $6.00
Computational Financial Mathematics with Mathematica
1 × $6.00 -
×
 Profitable Strategies with Gemify Academy
1 × $10.00
Profitable Strategies with Gemify Academy
1 × $10.00 -
×
 The Great Depression with David Burg
1 × $6.00
The Great Depression with David Burg
1 × $6.00 -
×
 Cycle Hunter Books 1-3 with Brian James Sklenka
1 × $6.00
Cycle Hunter Books 1-3 with Brian James Sklenka
1 × $6.00 -
×
 Royal Exchange Forex with Jan Teslar
1 × $6.00
Royal Exchange Forex with Jan Teslar
1 × $6.00 -
×
 The Prop Trading Code with Brannigan Barrett - Axia Futures
1 × $23.00
The Prop Trading Code with Brannigan Barrett - Axia Futures
1 × $23.00

Practical Introduction to Bollinger Bands 2013
$6.00
File Size: Coming soon!
Delivery Time: 1–12 hours
Media Type: Online Course
Practical Introduction to Bollinger Bands 2013
Understanding Bollinger Bands
What Are Bollinger Bands?
Bollinger Bands are a popular technical analysis tool developed by John Bollinger in the 1980s. They consist of a middle band, which is a simple moving average, and two outer bands that are standard deviations away from the middle band. These bands help traders understand volatility and identify potential buy and sell signals.
Importance in Technical Analysis
Bollinger Bands are essential for traders because they provide a visual representation of price volatility and potential market reversals. They can be applied to various asset classes, including stocks, commodities, and currencies.
Components of Bollinger Bands
The Middle Band
The middle band is typically a 20-day simple moving average (SMA). This average smooths out price data, providing a central value around which the upper and lower bands are calculated.
The Upper and Lower Bands
The upper and lower bands are usually set two standard deviations away from the middle band. These bands expand and contract based on market volatility, offering insights into price movements.
Standard Deviation
Standard deviation measures the dispersion of data from its mean. In Bollinger Bands, it helps determine the distance between the upper and lower bands and the middle band.
Calculating Bollinger Bands
Step-by-Step Calculation
- Calculate the 20-day SMA: Add the closing prices of the past 20 days and divide by 20.
- Determine the standard deviation: Calculate the standard deviation of the same 20-day period.
- Upper Band: Middle Band + (2 * Standard Deviation)
- Lower Band: Middle Band – (2 * Standard Deviation)
Example Calculation
If the 20-day SMA is $100 and the standard deviation is $5, the upper band would be $110 ($100 + (2 * $5)) and the lower band would be $90 ($100 – (2 * $5)).
Using Bollinger Bands in Trading
Identifying Trends
Bollinger Bands can help identify the direction of a trend. When the price consistently touches the upper band, it indicates an uptrend. Conversely, touching the lower band suggests a downtrend.
Overbought and Oversold Conditions
When the price moves near the upper band, the asset might be overbought, signaling a potential sell. If the price approaches the lower band, it might be oversold, indicating a potential buy.
Breakouts and Volatility
Bollinger Bands can also signal breakouts. When the bands squeeze together, it indicates low volatility and a potential breakout. A sudden widening of the bands suggests increased volatility and potential trading opportunities.
Practical Applications
Trading Strategies
Bollinger Bounce
This strategy is based on the idea that the price will revert to the mean. When the price touches the upper band, traders might consider selling. Conversely, touching the lower band might be a buy signal.
Bollinger Squeeze
The Bollinger Squeeze strategy focuses on periods of low volatility. When the bands narrow, it suggests that a breakout is imminent. Traders can prepare to enter positions in the direction of the breakout.
Combining with Other Indicators
Bollinger Bands can be combined with other technical indicators like the Relative Strength Index (RSI) or Moving Average Convergence Divergence (MACD) to enhance trading decisions.
Advantages of Bollinger Bands
Visual Clarity
Bollinger Bands provide a clear visual representation of price volatility, making it easier for traders to identify potential buy and sell signals.
Flexibility
They can be used in various markets and on different time frames, making them versatile tools for traders of all styles.
Reliability
When used correctly, Bollinger Bands can be reliable indicators of market trends and potential reversals.
Limitations of Bollinger Bands
Not a Standalone Indicator
Bollinger Bands should not be used in isolation. They are most effective when combined with other technical analysis tools.
False Signals
Like all technical indicators, Bollinger Bands can produce false signals. Traders should use them with caution and confirm signals with additional analysis.
Tips for Using Bollinger Bands
Customize Settings
Traders can adjust the period and standard deviation settings of Bollinger Bands to suit their trading style and the specific asset being traded.
Monitor Market Conditions
Regularly review market conditions and adjust your trading strategy accordingly. Bollinger Bands are more effective in certain market environments.
Practice and Patience
Successful trading with Bollinger Bands requires practice and patience. Use a demo account to test strategies before applying them to live trading.
Conclusion
Bollinger Bands are a powerful tool for traders, offering insights into market volatility and potential trading opportunities. By understanding their components, calculations, and applications, traders can effectively incorporate Bollinger Bands into their trading strategies to improve their decision-making and profitability.
FAQs
What are Bollinger Bands used for?
Bollinger Bands are used to measure market volatility and identify potential buy and sell signals based on price movements relative to the bands.
How do you calculate Bollinger Bands?
Bollinger Bands are calculated using a 20-day simple moving average and adding/subtracting two standard deviations to create the upper and lower bands.
Can Bollinger Bands be used for day trading?
Yes, Bollinger Bands can be used for day trading, as well as swing trading and long-term investing, due to their flexibility in different time frames.
What is the Bollinger Squeeze?
The Bollinger Squeeze occurs when the bands narrow, indicating low volatility and a potential breakout. It suggests that traders should prepare for a possible significant price move.
Should Bollinger Bands be used with other indicators?
Yes, Bollinger Bands are most effective when used in conjunction with other technical indicators, such as RSI or MACD, to confirm signals and enhance trading decisions.
Be the first to review “Practical Introduction to Bollinger Bands 2013”
You must be logged in to post a review.
Related products
Forex Trading
Original price was: $1,898.00.$10.00Current price is: $10.00.

Original price was: $2,120.00.$15.00Current price is: $15.00.

Original price was: $695.00.$41.00Current price is: $41.00.

Forex Trading
Original price was: $2,997.00.$23.00Current price is: $23.00.

Forex Trading
Original price was: $999.00.$15.00Current price is: $15.00.

Forex Trading
Original price was: $500.00.$5.00Current price is: $5.00.

Forex Trading
Original price was: $697.00.$5.00Current price is: $5.00.

Original price was: $649.00.$20.00Current price is: $20.00.

Original price was: $197.00.$5.00Current price is: $5.00.

Forex Trading
Original price was: $249.00.$15.00Current price is: $15.00.

Original price was: $497.00.$11.00Current price is: $11.00.

Original price was: $799.00.$15.00Current price is: $15.00.

Original price was: $1,849.00.$15.00Current price is: $15.00.

Original price was: $1,800.00.$54.00Current price is: $54.00.
Forex Trading
The Complete Guide to Multiple Time Frame Analysis & Reading Price Action with Aiman Almansoori
Original price was: $1,399.00.$13.00Current price is: $13.00.

Original price was: $450.00.$23.00Current price is: $23.00.
Forex Trading
Original price was: $397.00.$31.00Current price is: $31.00.

Original price was: $895.00.$15.00Current price is: $15.00.
Original price was: $4,995.00.$15.00Current price is: $15.00.

Forex Trading
Quantamentals – The Next Great Forefront Of Trading and Investing with Trading Markets
Original price was: $1,495.00.$8.00Current price is: $8.00.

Reviews
There are no reviews yet.