-
×
 ABC Waves TOS Indicator & Live Class with Simpler Options
1 × $6.00
ABC Waves TOS Indicator & Live Class with Simpler Options
1 × $6.00 -
×
 Forex Mastery with Willis University
1 × $6.00
Forex Mastery with Willis University
1 × $6.00 -
×
 The Inner Circle Seminar
1 × $15.00
The Inner Circle Seminar
1 × $15.00 -
×
 Complete Times Course with Afshin Taghechian
1 × $6.00
Complete Times Course with Afshin Taghechian
1 × $6.00 -
×
 The Psychology Of Trading with Brett N.Steenbarger
1 × $6.00
The Psychology Of Trading with Brett N.Steenbarger
1 × $6.00 -
×
 501 Stock Market Tips & Guidelines with Arshad Khan
1 × $6.00
501 Stock Market Tips & Guidelines with Arshad Khan
1 × $6.00 -
×
 Option Strategies with Courtney Smith
1 × $6.00
Option Strategies with Courtney Smith
1 × $6.00 -
×
 Quantifiable Edges – Gold Subscription with Rob Hanna
1 × $54.00
Quantifiable Edges – Gold Subscription with Rob Hanna
1 × $54.00 -
×
 Crystal Ball Pack PLUS bonus Live Trade By Pat Mitchell - Trick Trades
1 × $20.00
Crystal Ball Pack PLUS bonus Live Trade By Pat Mitchell - Trick Trades
1 × $20.00 -
×
 A Complete Guide to the Futures Market: Technical Analysis, Trading Systems, Fundamental Analysis, Options, Spreads, and Trading Principles (Wiley Trading) 2nd Edition - Jack Schwager
1 × $6.00
A Complete Guide to the Futures Market: Technical Analysis, Trading Systems, Fundamental Analysis, Options, Spreads, and Trading Principles (Wiley Trading) 2nd Edition - Jack Schwager
1 × $6.00 -
×
 Daily Market Review 2009-2012 (Video 16 GB) with David Vallieres
1 × $6.00
Daily Market Review 2009-2012 (Video 16 GB) with David Vallieres
1 × $6.00 -
×
 Advanced Price Action Course with Chris Capre
1 × $7.00
Advanced Price Action Course with Chris Capre
1 × $7.00 -
×
 A+ Setups Big Caps Options with Jtrader
1 × $6.00
A+ Setups Big Caps Options with Jtrader
1 × $6.00 -
×
 A Day Trading Guide
1 × $54.00
A Day Trading Guide
1 × $54.00 -
×
 How to Build Fortune. Trading Stock Index Futures with Dennis Minogue
1 × $6.00
How to Build Fortune. Trading Stock Index Futures with Dennis Minogue
1 × $6.00 -
×
 Options Trading & Ultimate MasterClass With Tyrone Abela - FX Evolution
1 × $54.00
Options Trading & Ultimate MasterClass With Tyrone Abela - FX Evolution
1 × $54.00 -
×
 The Beginners Guide to Commodities Investing with Brian & Gayle Rice
1 × $6.00
The Beginners Guide to Commodities Investing with Brian & Gayle Rice
1 × $6.00 -
×
 Complete Price Action, Volume Profile and Orderflow Trading Bundle with Price Action Volume Trader
1 × $78.00
Complete Price Action, Volume Profile and Orderflow Trading Bundle with Price Action Volume Trader
1 × $78.00 -
×
 How To Build An Automated Trading Robot In Excel with Peter Titus - Marwood Research
1 × $15.00
How To Build An Automated Trading Robot In Excel with Peter Titus - Marwood Research
1 × $15.00 -
×
 Compass Trading System with Right Line Trading
1 × $39.00
Compass Trading System with Right Line Trading
1 × $39.00 -
×
 Proven Chart Patterns: Key Indicators for Success in Today’s Markets with Chris Manning
1 × $6.00
Proven Chart Patterns: Key Indicators for Success in Today’s Markets with Chris Manning
1 × $6.00 -
×
 Smart Money Concepts with MFX Trading
1 × $13.00
Smart Money Concepts with MFX Trading
1 × $13.00 -
×
 How To Read The Market Professionally with TradeSmart
1 × $27.00
How To Read The Market Professionally with TradeSmart
1 × $27.00 -
×
 Profits In PJs - Profitably Selling Stock Options for Passive Income with Cam Tucker
1 × $6.00
Profits In PJs - Profitably Selling Stock Options for Passive Income with Cam Tucker
1 × $6.00 -
×
 Best of the Best: Collars with Amy Meissner & Scott Ruble
1 × $15.00
Best of the Best: Collars with Amy Meissner & Scott Ruble
1 × $15.00 -
×
 Orderflows Gems 2-Private Sessions with Mike Valtos
1 × $20.00
Orderflows Gems 2-Private Sessions with Mike Valtos
1 × $20.00 -
×
 Trading for a Bright Future with Martin Cole
1 × $6.00
Trading for a Bright Future with Martin Cole
1 × $6.00 -
×
 3 Steps To Supply/Demand + 3 Steps To Market Profile 10% Off Combined Price
1 × $23.00
3 Steps To Supply/Demand + 3 Steps To Market Profile 10% Off Combined Price
1 × $23.00 -
×
 Options Academy Elevate with Simon Ree - Tao of Trading
1 × $109.00
Options Academy Elevate with Simon Ree - Tao of Trading
1 × $109.00 -
×
 AbleTrend with John Wang & Grace Wang
1 × $6.00
AbleTrend with John Wang & Grace Wang
1 × $6.00 -
×
 Activedaytrader - Mastering Technicals
1 × $15.00
Activedaytrader - Mastering Technicals
1 × $15.00 -
×
 Masterclass 5.0 with RockzFX
1 × $5.00
Masterclass 5.0 with RockzFX
1 × $5.00 -
×
 Profit Generating System with Brian Williams
1 × $6.00
Profit Generating System with Brian Williams
1 × $6.00 -
×
 The Orderflow Masterclass with PrimeTrading
1 × $17.00
The Orderflow Masterclass with PrimeTrading
1 × $17.00 -
×
 Power Cycle Trading The Ultimate Option Guide: When & How to Use Which Option Strategy For the Best Results - Powercycletrading
1 × $69.00
Power Cycle Trading The Ultimate Option Guide: When & How to Use Which Option Strategy For the Best Results - Powercycletrading
1 × $69.00 -
×
 Advanced GET 8.0 EOD
1 × $6.00
Advanced GET 8.0 EOD
1 × $6.00 -
×
 Trading MoneyTides & Chaos in the Stock Market with Hans Hannula
1 × $6.00
Trading MoneyTides & Chaos in the Stock Market with Hans Hannula
1 × $6.00 -
×
 Algohub 2023 Full Completed with Algohub
1 × $5.00
Algohub 2023 Full Completed with Algohub
1 × $5.00 -
×
 Simpler Options - Weekly Butterflies for Income
1 × $6.00
Simpler Options - Weekly Butterflies for Income
1 × $6.00 -
×
 Chart Analysis Boot Camp Course Webinar with Mike Albright
1 × $6.00
Chart Analysis Boot Camp Course Webinar with Mike Albright
1 × $6.00 -
×
 AI For Traders with Trading Markets
1 × $31.00
AI For Traders with Trading Markets
1 × $31.00 -
×
 Essentials in Quantitative Trading QT01 By HangukQuant's
1 × $23.00
Essentials in Quantitative Trading QT01 By HangukQuant's
1 × $23.00 -
×
 The Indices Orderflow Masterclass with The Forex Scalpers
1 × $23.00
The Indices Orderflow Masterclass with The Forex Scalpers
1 × $23.00 -
×
 Fantastic 4 Trading Strategies
1 × $15.00
Fantastic 4 Trading Strategies
1 × $15.00 -
×
 The Insider's Guide to Forex Trading with Kathy Lien
1 × $6.00
The Insider's Guide to Forex Trading with Kathy Lien
1 × $6.00 -
×
 How to Call the Top in a Stock (To the Penny!) and Earn 9-11% Annualized Cash Yields Doing It with Dan Ferris
1 × $6.00
How to Call the Top in a Stock (To the Penny!) and Earn 9-11% Annualized Cash Yields Doing It with Dan Ferris
1 × $6.00 -
×
 Trading Short TermSame Day Trades Sep 2023 with Dan Sheridan & Mark Fenton - Sheridan Options Mentoring
1 × $31.00
Trading Short TermSame Day Trades Sep 2023 with Dan Sheridan & Mark Fenton - Sheridan Options Mentoring
1 × $31.00 -
×
 Trading Natural Resources in a Volatile Market with Kevin Kerr
1 × $6.00
Trading Natural Resources in a Volatile Market with Kevin Kerr
1 × $6.00 -
×
 The Insider's Guide to 52 Homes in 52 Weeks: Acquire Your Real Estate Fortune Today with Dolf De Roos
1 × $6.00
The Insider's Guide to 52 Homes in 52 Weeks: Acquire Your Real Estate Fortune Today with Dolf De Roos
1 × $6.00 -
×
 Advanced Spread Trading with Guy Bower - MasterClass Trader
1 × $15.00
Advanced Spread Trading with Guy Bower - MasterClass Trader
1 × $15.00 -
×
 Simple Sector Trading Strategies with John Murphy
1 × $6.00
Simple Sector Trading Strategies with John Murphy
1 × $6.00 -
×
 Matrix Spread Options Trading Course with Base Camp Trading
1 × $31.00
Matrix Spread Options Trading Course with Base Camp Trading
1 × $31.00 -
×
 Hedges on Hedge Funds: How to Successfully Analyze and Select an Investment with James Hedges
1 × $6.00
Hedges on Hedge Funds: How to Successfully Analyze and Select an Investment with James Hedges
1 × $6.00 -
×
 The Logical Trader: Applying a Method to the Madness with Mark Fisher
1 × $6.00
The Logical Trader: Applying a Method to the Madness with Mark Fisher
1 × $6.00 -
×
 The 10%ers with Trader Mike
1 × $5.00
The 10%ers with Trader Mike
1 × $5.00 -
×
 $20 – 52k 20 pips a day challange with Rafał Zuchowicz - TopMasterTrader
1 × $5.00
$20 – 52k 20 pips a day challange with Rafał Zuchowicz - TopMasterTrader
1 × $5.00 -
×
 Secrets of the Darvas Trading System
1 × $6.00
Secrets of the Darvas Trading System
1 × $6.00 -
×
 Kaizen On-Demand By Candle Charts
1 × $6.00
Kaizen On-Demand By Candle Charts
1 × $6.00 -
×
 Contrarian Investing with Anthony M.Gallea, William Patalon
1 × $6.00
Contrarian Investing with Anthony M.Gallea, William Patalon
1 × $6.00 -
×
 5 Day Bootcamp with AWFX AnthonysWorld
1 × $34.00
5 Day Bootcamp with AWFX AnthonysWorld
1 × $34.00 -
×
 Complete Day Trading Course with The Trading Floor
1 × $13.00
Complete Day Trading Course with The Trading Floor
1 × $13.00 -
×
 Forex Education Trading System (Video 469 MB)
1 × $23.00
Forex Education Trading System (Video 469 MB)
1 × $23.00 -
×
 Euro Fractal Trading System with Cynthia Marcy, Erol Bortucene
1 × $6.00
Euro Fractal Trading System with Cynthia Marcy, Erol Bortucene
1 × $6.00 -
×
 ICT Prodigy Trading Course – $650K in Payouts with Alex Solignani
1 × $15.00
ICT Prodigy Trading Course – $650K in Payouts with Alex Solignani
1 × $15.00 -
×
 Advanced AmiBroker Coding with Matt Radtke & Connors Research
1 × $23.00
Advanced AmiBroker Coding with Matt Radtke & Connors Research
1 × $23.00 -
×
 Market Tide indicator with Alphashark
1 × $54.00
Market Tide indicator with Alphashark
1 × $54.00 -
×
 Better Trading with the Guppy Multiple Moving Average WorkBook with Daryl Guppy
1 × $6.00
Better Trading with the Guppy Multiple Moving Average WorkBook with Daryl Guppy
1 × $6.00 -
×
 White Phoenix’s The Smart (Money) Approach to Trading with Jayson Casper
1 × $39.00
White Phoenix’s The Smart (Money) Approach to Trading with Jayson Casper
1 × $39.00 -
×
 Advanced Technical Strategies Home Study Course with T3 LIVE
1 × $31.00
Advanced Technical Strategies Home Study Course with T3 LIVE
1 × $31.00 -
×
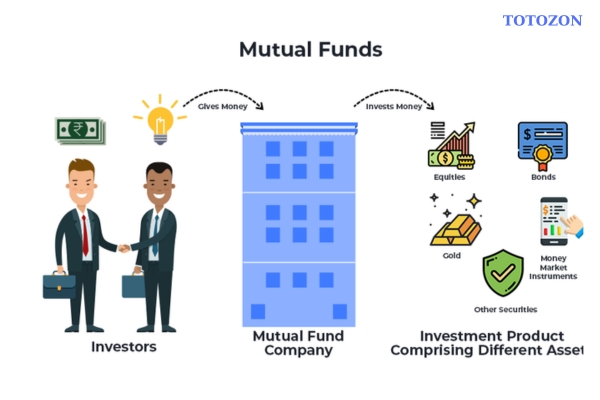 Mutual Funds: Fifty Years of Research Findings by Seth C. Anderson
1 × $6.00
Mutual Funds: Fifty Years of Research Findings by Seth C. Anderson
1 × $6.00 -
×
 Affinity Foundation Stocks Course with Affinitytrading
1 × $6.00
Affinity Foundation Stocks Course with Affinitytrading
1 × $6.00 -
×
 Investing in 401k Plans with Cliffsnotes
1 × $6.00
Investing in 401k Plans with Cliffsnotes
1 × $6.00 -
×
 Candlestick and Pivot Point Trading Triggers with John Person
1 × $6.00
Candlestick and Pivot Point Trading Triggers with John Person
1 × $6.00 -
×
 Profiletraders - Market Profile Day Trading
1 × $15.00
Profiletraders - Market Profile Day Trading
1 × $15.00 -
×
 The Prop Trading Code with Brannigan Barrett - Axia Futures
1 × $23.00
The Prop Trading Code with Brannigan Barrett - Axia Futures
1 × $23.00

Reading & Understanding Charts with Andrew Baxter
$6.00
File Size: 311MB
Delivery Time: 1–12 hours
Media Type: Online Course
Content Proof: Watch Here!
You may check content proof of “Reading & Understanding Chartsb with Andrew Baxter” below:

Reading & Understanding Charts with Andrew Baxter
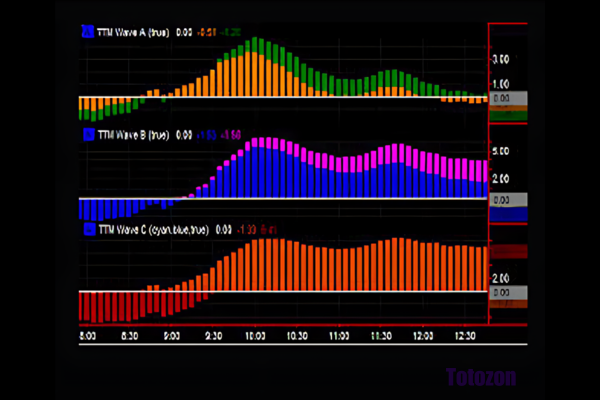
Introduction to Chart Reading
Charts are essential tools for traders, providing visual representations of market data. Andrew Baxter, a renowned trader and educator, shares his expertise on how to read and understand charts effectively. This article will guide you through the basics and advanced techniques of chart reading, helping you make informed trading decisions.
What are Trading Charts?
Definition and Purpose
Trading charts are graphical representations of price movements over time. They help traders analyze trends, identify patterns, and make predictions about future price movements.
Importance of Chart Reading
Understanding charts is crucial for making data-driven decisions in trading. It reduces emotional trading and enhances your ability to spot opportunities and risks.
Types of Trading Charts
1. Line Charts
Line charts are the simplest form of trading charts, showing the closing prices over a period. They provide a clear view of the overall trend but lack detailed information.
2. Bar Charts
Bar charts display the opening, closing, high, and low prices for each period. They offer more information than line charts and help in understanding price volatility.
3. Candlestick Charts
Candlestick charts are popular due to their detailed and visually appealing format. Each candlestick shows the opening, closing, high, and low prices, making it easier to identify market sentiment.
Understanding Candlestick Charts
Components of a Candlestick
- Body: The filled part showing the opening and closing prices.
- Wicks/Shadows: The thin lines representing the high and low prices.
- Color: Indicates whether the closing price was higher (typically green) or lower (typically red) than the opening price.
Common Candlestick Patterns
1. Doji
A Doji occurs when the opening and closing prices are nearly the same, indicating indecision in the market.
2. Hammer
A Hammer has a small body with a long lower wick, suggesting a potential reversal from a downtrend.
3. Engulfing Pattern
An Engulfing pattern occurs when a larger candlestick completely engulfs the previous smaller candlestick, signaling a potential reversal.
Key Chart Patterns
1. Head and Shoulders
This pattern indicates a reversal and is formed by a peak (head) flanked by two smaller peaks (shoulders).
2. Double Top and Double Bottom
These patterns signal a potential reversal. A double top indicates a bearish reversal, while a double bottom suggests a bullish reversal.
3. Triangles
Triangles are continuation patterns that show a period of consolidation before the price continues in the direction of the previous trend.
Using Technical Indicators
1. Moving Averages
Moving averages smooth out price data to identify trends. Common types include Simple Moving Average (SMA) and Exponential Moving Average (EMA).
2. Relative Strength Index (RSI)
RSI measures the speed and change of price movements, indicating overbought or oversold conditions.
3. Moving Average Convergence Divergence (MACD)
MACD shows the relationship between two moving averages, helping to identify potential buy and sell signals.
Combining Chart Patterns and Indicators
Integrated Analysis
Combining chart patterns with technical indicators enhances the reliability of trading signals. For example, confirming a head and shoulders pattern with RSI divergence can provide a stronger signal.
Practical Application
Use a combination of patterns and indicators to develop a comprehensive trading strategy. This approach helps in making more informed and confident trading decisions.
Advanced Chart Reading Techniques
1. Fibonacci Retracement
Fibonacci retracement levels indicate potential support and resistance levels based on the Fibonacci sequence.
2. Volume Analysis
Volume analysis involves examining the number of shares traded to confirm the strength of a price movement or trend.
3. Divergence
Divergence occurs when the price moves in the opposite direction of an indicator, signaling a potential reversal.
Common Mistakes in Chart Reading
1. Overcomplicating Analysis
Avoid using too many indicators and patterns at once. Focus on a few reliable tools to keep your analysis clear and effective.
2. Ignoring Context
Always consider the broader market context and economic factors. Relying solely on charts without context can lead to misleading conclusions.
3. Emotional Trading
Stick to your analysis and avoid making decisions based on emotions. Emotional trading can undermine even the best chart reading skills.
Benefits of Mastering Chart Reading
1. Improved Decision Making
Accurate chart reading helps you make informed decisions, reducing the risk of losses and increasing the potential for gains.
2. Enhanced Trading Strategy
Understanding charts allows you to develop and refine your trading strategies, making them more effective and adaptable.
3. Increased Confidence
With better chart reading skills, you gain confidence in your trading decisions, leading to more consistent performance.
Conclusion
Reading and understanding charts with insights from Andrew Baxter can significantly improve your trading performance. By mastering various chart types, patterns, and technical indicators, you can make more informed decisions and develop robust trading strategies. Embrace these principles, continuously practice, and refine your skills to become a proficient trader.
Frequently Asked Questions:
What are the main types of trading charts?
The main types are line charts, bar charts, and candlestick charts.
Why are candlestick charts popular?
Candlestick charts are popular due to their detailed and visually appealing format, making it easier to identify market sentiment.
What are some common candlestick patterns?
Common patterns include Doji, Hammer, and Engulfing patterns.
How can technical indicators enhance chart reading?
Technical indicators like moving averages, RSI, and MACD help identify trends, momentum, and potential buy/sell signals.
What are some advanced chart reading techniques?
Advanced techniques include Fibonacci retracement, volume analysis, and divergence.
Be the first to review “Reading & Understanding Charts with Andrew Baxter”
You must be logged in to post a review.
Related products

Forex Trading
The Complete Guide to Multiple Time Frame Analysis & Reading Price Action with Aiman Almansoori
Original price was: $1,399.00.$13.00Current price is: $13.00.

Original price was: $999.00.$5.00Current price is: $5.00.

Forex Trading
Original price was: $550.00.$5.00Current price is: $5.00.
Original price was: $197.00.$5.00Current price is: $5.00.
Original price was: $799.00.$15.00Current price is: $15.00.

Forex Trading
Original price was: $2,997.00.$23.00Current price is: $23.00.

Forex Trading
Original price was: $499.00.$15.00Current price is: $15.00.

Original price was: $695.00.$41.00Current price is: $41.00.
Original price was: $1,800.00.$54.00Current price is: $54.00.

Forex Trading
Original price was: $249.00.$15.00Current price is: $15.00.

Original price was: $4,995.00.$15.00Current price is: $15.00.
Forex Trading
Original price was: $397.00.$31.00Current price is: $31.00.
Original price was: $450.00.$23.00Current price is: $23.00.

Original price was: $139.00.$23.00Current price is: $23.00.
Forex Trading
Original price was: $4,997.00.$27.00Current price is: $27.00.

Original price was: $497.00.$11.00Current price is: $11.00.

Forex Trading
Original price was: $697.00.$5.00Current price is: $5.00.
Original price was: $2,120.00.$15.00Current price is: $15.00.
Forex Trading
Original price was: $1,098.00.$39.00Current price is: $39.00.

Forex Trading
Original price was: $500.00.$5.00Current price is: $5.00.

Reviews
There are no reviews yet.