-
×
 The Compleat DayTrader I & II with Jack Bernstein
1 × $6.00
The Compleat DayTrader I & II with Jack Bernstein
1 × $6.00 -
×
 FasTrack Premium with Note Conference
1 × $78.00
FasTrack Premium with Note Conference
1 × $78.00 -
×
 Advances in International Investments: Traditional and Alternative Approaches with Hung-Gay Fung, Xiaoqing Eleanor Xu & Jot Yau
1 × $6.00
Advances in International Investments: Traditional and Alternative Approaches with Hung-Gay Fung, Xiaoqing Eleanor Xu & Jot Yau
1 × $6.00 -
×
 AI For Traders with Trading Markets
1 × $31.00
AI For Traders with Trading Markets
1 × $31.00 -
×
 Sami Abusaad Elite Mentorship
1 × $31.00
Sami Abusaad Elite Mentorship
1 × $31.00 -
×
 White Phoenix’s The Smart (Money) Approach to Trading with Jayson Casper
1 × $39.00
White Phoenix’s The Smart (Money) Approach to Trading with Jayson Casper
1 × $39.00 -
×
 Day Trading Smart Right From the Start: Trading Essentials for Maximum Results - David Nassar & John Boyer
1 × $6.00
Day Trading Smart Right From the Start: Trading Essentials for Maximum Results - David Nassar & John Boyer
1 × $6.00 -
×
 The Complete Guide to Multiple Time Frame Analysis & Reading Price Action with Aiman Almansoori
1 × $13.00
The Complete Guide to Multiple Time Frame Analysis & Reading Price Action with Aiman Almansoori
1 × $13.00 -
×
 Creating the Optimal Trade for Explosive Profits with George A.Fontanills
1 × $6.00
Creating the Optimal Trade for Explosive Profits with George A.Fontanills
1 × $6.00 -
×
 Forecast 2024 Clarification with Larry Williams
1 × $15.00
Forecast 2024 Clarification with Larry Williams
1 × $15.00 -
×
 Ultimate Trading Course with Dodgy's Dungeon
1 × $8.00
Ultimate Trading Course with Dodgy's Dungeon
1 × $8.00 -
×
 Volume Profile 2023 (Order Flow Pack) with Trader Dale
1 × $5.00
Volume Profile 2023 (Order Flow Pack) with Trader Dale
1 × $5.00 -
×
 Concerning The More Certain Fundamentals Of Astrology
1 × $6.00
Concerning The More Certain Fundamentals Of Astrology
1 × $6.00 -
×
 Crystal Ball Pack PLUS bonus Live Trade By Pat Mitchell - Trick Trades
1 × $20.00
Crystal Ball Pack PLUS bonus Live Trade By Pat Mitchell - Trick Trades
1 × $20.00 -
×
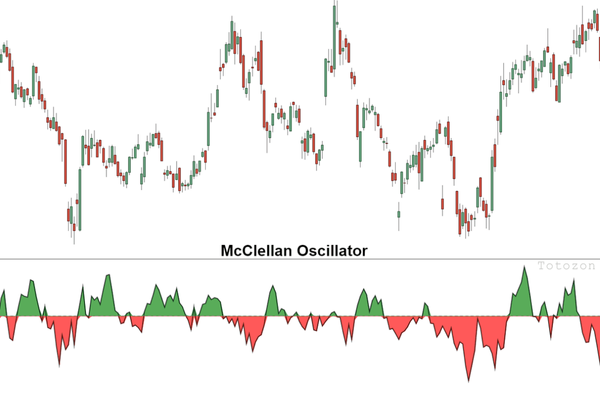 The McClellan Oscillator and Other Tools for with Tom McClellan
1 × $6.00
The McClellan Oscillator and Other Tools for with Tom McClellan
1 × $6.00 -
×
 8 Strategies for Day Trading
1 × $31.00
8 Strategies for Day Trading
1 × $31.00 -
×
 Capital with Charles D.Ellis
1 × $6.00
Capital with Charles D.Ellis
1 × $6.00 -
×
 Best of the Best: Collars with Amy Meissner & Scott Ruble
1 × $15.00
Best of the Best: Collars with Amy Meissner & Scott Ruble
1 × $15.00 -
×
 Forex Millionaire Course with Willis University
1 × $6.00
Forex Millionaire Course with Willis University
1 × $6.00 -
×
 AG Trading Journal with Ace Gazette
1 × $6.00
AG Trading Journal with Ace Gazette
1 × $6.00 -
×
 5 Day Volume Profile Analysis Indicator Course with Mark Stone
1 × $54.00
5 Day Volume Profile Analysis Indicator Course with Mark Stone
1 × $54.00 -
×
 ALGO™ Online Retail - Version 2.9
1 × $155.00
ALGO™ Online Retail - Version 2.9
1 × $155.00 -
×
 Power Index Method for Profitable Futures Trading with Harold Goldberg
1 × $6.00
Power Index Method for Profitable Futures Trading with Harold Goldberg
1 × $6.00 -
×
 Simpler Options - Insider’s Guide to Generating Income using Options Strategies Course (Oct 2014)
1 × $6.00
Simpler Options - Insider’s Guide to Generating Income using Options Strategies Course (Oct 2014)
1 × $6.00 -
×
 High Probability Patterns and Rule Based Trading with Jake Bernstein
1 × $6.00
High Probability Patterns and Rule Based Trading with Jake Bernstein
1 × $6.00 -
×
 Butterfly and Condor Workshop with Aeromir
1 × $15.00
Butterfly and Condor Workshop with Aeromir
1 × $15.00 -
×
 Trading With an Edge with Bruce Gilmore
1 × $6.00
Trading With an Edge with Bruce Gilmore
1 × $6.00 -
×
 Quantamentals - The Next Great Forefront Of Trading and Investing with Trading Markets
1 × $8.00
Quantamentals - The Next Great Forefront Of Trading and Investing with Trading Markets
1 × $8.00 -
×
 WondaFX Signature Strategy with WondaFX
1 × $5.00
WondaFX Signature Strategy with WondaFX
1 × $5.00 -
×
 Master Moving Averages - Profit Multiplying Techniques with Nick Santiago - InTheMoneyStocks
1 × $54.00
Master Moving Averages - Profit Multiplying Techniques with Nick Santiago - InTheMoneyStocks
1 × $54.00 -
×
 Empirical Market Microstructure
1 × $6.00
Empirical Market Microstructure
1 × $6.00 -
×
 Wyckoff Analytics Courses Collection
1 × $27.00
Wyckoff Analytics Courses Collection
1 × $27.00 -
×
 The Prop Trading Code with Brannigan Barrett - Axia Futures
1 × $23.00
The Prop Trading Code with Brannigan Barrett - Axia Futures
1 × $23.00 -
×
 Earnings Engine with Sami Abusaad - T3 Live
1 × $6.00
Earnings Engine with Sami Abusaad - T3 Live
1 × $6.00 -
×
 Money Miracle: Use Other Peoples Money to Make You Rich with George Angell
1 × $6.00
Money Miracle: Use Other Peoples Money to Make You Rich with George Angell
1 × $6.00 -
×
 W. D Gann 's Square Of 9 Applied To Modern Markets with Sean Avidar - Hexatrade350
1 × $23.00
W. D Gann 's Square Of 9 Applied To Modern Markets with Sean Avidar - Hexatrade350
1 × $23.00 -
×
 The Afluent Desktop Currency Trader with Amin Sadak
1 × $6.00
The Afluent Desktop Currency Trader with Amin Sadak
1 × $6.00 -
×
 The Loyalty Effect with Frederick Reichheld
1 × $6.00
The Loyalty Effect with Frederick Reichheld
1 × $6.00 -
×
 $20 – 52k 20 pips a day challange with Rafał Zuchowicz - TopMasterTrader
1 × $5.00
$20 – 52k 20 pips a day challange with Rafał Zuchowicz - TopMasterTrader
1 × $5.00 -
×
 How To Buy with Justin Mamis
1 × $6.00
How To Buy with Justin Mamis
1 × $6.00 -
×
 Home Run Options Trading Course with Dave Aquino - Base Camp Trading
1 × $11.00
Home Run Options Trading Course with Dave Aquino - Base Camp Trading
1 × $11.00

Price Headley – Using Williams %R The BigTrends Way
$6.00
File Size: Cooming soon!
Delivery Time: 1–12 hours
Media Type: Online Course
Content Proof: Watch Here!
You may check content proof of “Price Headley – Using Williams %R The BigTrends Way” below:

Price Headley – Using Williams %R The BigTrends Way
Price Headley’s approach to the Williams %R indicator encapsulates a profound understanding of market dynamics, tailored specifically for those who follow his BigTrends methodology. This article explores how Price Headley utilizes the Williams %R, enhancing its utility to adapt to the rapid swings of the financial markets. Let’s dive into the details of this distinctive technique.
Introduction: Understanding Williams %R
Williams %R, developed by Larry Williams, is a momentum indicator that compares a stock’s closing price to the high-low range over a specific period, typically 14 days.
Part 1: The Basics of Williams %R
How It Works
- The indicator moves between 0 and -100, indicating overbought and oversold levels.
Reading the Indicator
- Values between -20 and 0 suggest overbought conditions; values between -100 and -80 suggest oversold conditions.
Part 2: Price Headley’s BigTrends Modifications
Adjusting the Time Frame
- Price Headley adjusts the standard 14-day period to suit different trading styles, enhancing responsiveness or stability.
Integration with Other Tools
- How Headley integrates Williams %R with other technical tools for a comprehensive analysis.
Part 3: Strategic Implementation
Identifying Entry Points
- Using the modified Williams %R to pinpoint optimal entry points in various market conditions.
Exit Strategies
- Determining exit points using a combination of Williams %R readings and other BigTrends indicators.
Part 4: Case Studies and Examples
Successful Trades Using Williams %R
- Detailed analysis of successful trades that leveraged this approach.
Learning from the Misses
- Reviewing less successful attempts to refine strategy and improve accuracy.
Part 5: Combining Theory with Practice
Practical Tips for Day Traders
- Specific advice for day traders on employing the modified Williams %R in fast-paced markets.
Insights for Long-Term Investors
- Adapting the technique for longer time frames and different market segments.
Part 6: Advanced Techniques and Considerations
Adjustments for Market Volatility
- Customizing the indicator to cope with varying levels of market volatility.
Sector-Specific Applications
- How to apply the modified Williams %R in different sectors such as technology or finance.
Conclusion: Enhancing Your Trading Strategy with Williams %R
Price Headley’s innovative use of the Williams %R indicator demonstrates that even well-established tools can be reimagined and adapted. By integrating these strategies into your trading plan, you can enhance your ability to make informed decisions based on nuanced, real-time data.
FAQs
- What is Williams %R?
- It’s a momentum indicator that measures overbought and oversold levels by comparing the current closing price to the high and low of the past N days.
- How does Price Headley modify the Williams %R?
- Headley may adjust the period settings or integrate it with other tools to improve its effectiveness specific to his BigTrends trading methodology.
- Can Williams %R be used for all types of trading?
- Yes, it can be adapted for short-term day trading, swing trading, and even long-term investment strategies.
- What makes the BigTrends approach unique?
- It emphasizes practical, real-world applications and adjustments tailored to the trader’s specific needs and market conditions.
- How can a trader start using Williams %R in their strategy?
- Begin by understanding the basic mechanics of the indicator, then consider modifications to suit individual trading style and market focus.
Be the first to review “Price Headley – Using Williams %R The BigTrends Way”
You must be logged in to post a review.
Related products
Original price was: $497.00.$11.00Current price is: $11.00.

Forex Trading
Original price was: $697.00.$5.00Current price is: $5.00.
Forex Trading
Original price was: $799.00.$15.00Current price is: $15.00.

Original price was: $997.00.$8.00Current price is: $8.00.

Forex Trading
Original price was: $4,997.00.$27.00Current price is: $27.00.

Original price was: $299.00.$8.00Current price is: $8.00.

Forex Trading
Original price was: $797.00.$10.00Current price is: $10.00.
Original price was: $700.00.$39.00Current price is: $39.00.
Original price was: $139.00.$23.00Current price is: $23.00.

Forex Trading
Original price was: $499.00.$15.00Current price is: $15.00.
Forex Trading
Original price was: $239.00.$8.00Current price is: $8.00.
Forex Trading
Original price was: $2,995.00.$31.00Current price is: $31.00.

Forex Trading
Original price was: $850.00.$23.00Current price is: $23.00.
Original price was: $197.00.$5.00Current price is: $5.00.

Original price was: $695.00.$41.00Current price is: $41.00.

Original price was: $450.00.$23.00Current price is: $23.00.

Forex Trading
Original price was: $2,000.00.$23.00Current price is: $23.00.

Forex Trading
Original price was: $500.00.$5.00Current price is: $5.00.
Original price was: $649.00.$20.00Current price is: $20.00.

Forex Trading
Original price was: $397.00.$31.00Current price is: $31.00.

Reviews
There are no reviews yet.