-
×
 Power Index Method for Profitable Futures Trading with Harold Goldberg
1 × $6.00
Power Index Method for Profitable Futures Trading with Harold Goldberg
1 × $6.00 -
×
 Creating the Optimal Trade for Explosive Profits with George A.Fontanills
1 × $6.00
Creating the Optimal Trade for Explosive Profits with George A.Fontanills
1 × $6.00 -
×
 Professional Options Trading College
1 × $54.00
Professional Options Trading College
1 × $54.00 -
×
 Passages To Profitability: A Comprehensive Guide To Channel Trading with Professor Jeff Bierman, CMT
1 × $6.00
Passages To Profitability: A Comprehensive Guide To Channel Trading with Professor Jeff Bierman, CMT
1 × $6.00 -
×
 Futures Trading (German)
1 × $6.00
Futures Trading (German)
1 × $6.00 -
×
 Shawn Sharma Mentorship Program
1 × $34.00
Shawn Sharma Mentorship Program
1 × $34.00 -
×
 Fixed Income Securities (2nd Ed.) with Bruce Tuckman
1 × $10.00
Fixed Income Securities (2nd Ed.) with Bruce Tuckman
1 × $10.00 -
×
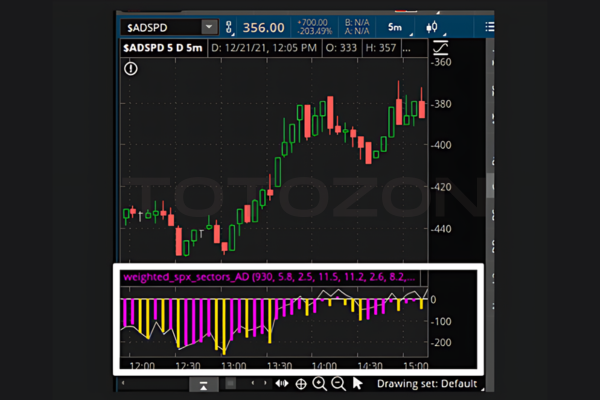 ShadowTrader Weighted S&P Advance Decline Line thinkScript with Peter Reznicek - ShadowTrader
1 × $23.00
ShadowTrader Weighted S&P Advance Decline Line thinkScript with Peter Reznicek - ShadowTrader
1 × $23.00 -
×
 Stock Trader`s Almanac 2012 with Jeffrey Hirsch & Yale Hirsch
1 × $6.00
Stock Trader`s Almanac 2012 with Jeffrey Hirsch & Yale Hirsch
1 × $6.00 -
×
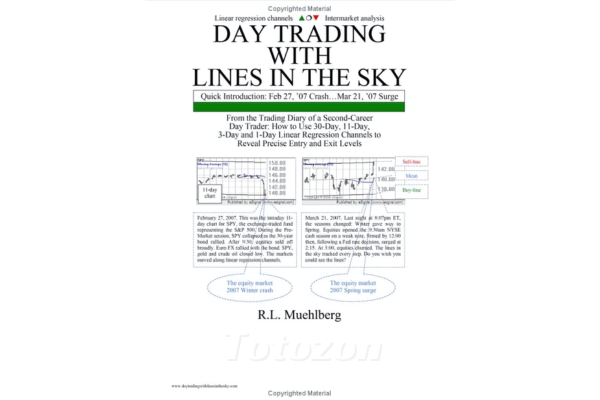 Day Trading with Lines in the Sky By R.L.Muehlberg
1 × $6.00
Day Trading with Lines in the Sky By R.L.Muehlberg
1 × $6.00 -
×
 Foundation of Successful Trading - 2 DVDs and Bonus Gann Time Factor 2 DVDs
1 × $31.00
Foundation of Successful Trading - 2 DVDs and Bonus Gann Time Factor 2 DVDs
1 × $31.00 -
×
 FX GOAT 3.0 (STRATEGIES) with FX GOAT FOREX TRADING ACADEMY
1 × $15.00
FX GOAT 3.0 (STRATEGIES) with FX GOAT FOREX TRADING ACADEMY
1 × $15.00 -
×
 How to Call the Top in a Stock (To the Penny!) and Earn 9-11% Annualized Cash Yields Doing It with Dan Ferris
1 × $6.00
How to Call the Top in a Stock (To the Penny!) and Earn 9-11% Annualized Cash Yields Doing It with Dan Ferris
1 × $6.00 -
×
 How To Read The Market Professionally with TradeSmart
1 × $27.00
How To Read The Market Professionally with TradeSmart
1 × $27.00 -
×
 W. D Gann 's Square Of 9 Applied To Modern Markets with Sean Avidar - Hexatrade350
1 × $23.00
W. D Gann 's Square Of 9 Applied To Modern Markets with Sean Avidar - Hexatrade350
1 × $23.00 -
×
 The Any Hour Trading System with Markets Mastered
1 × $6.00
The Any Hour Trading System with Markets Mastered
1 × $6.00 -
×
 The A to Z of Mathematics: A Basic Guide with Thomas Sidebotham
1 × $6.00
The A to Z of Mathematics: A Basic Guide with Thomas Sidebotham
1 × $6.00 -
×
 The Aggressive Conservative Investor with Martin Whitman & Martin Shubik
1 × $6.00
The Aggressive Conservative Investor with Martin Whitman & Martin Shubik
1 × $6.00 -
×
 The Orderflow Masterclass with PrimeTrading
1 × $17.00
The Orderflow Masterclass with PrimeTrading
1 × $17.00 -
×
 The Precision Profit Float Indicator (TS Code & Setups) with Steve Woods
1 × $6.00
The Precision Profit Float Indicator (TS Code & Setups) with Steve Woods
1 × $6.00 -
×
 Euro Trading Course with Bkforex
1 × $6.00
Euro Trading Course with Bkforex
1 × $6.00 -
×
 Supply And Demand Zone Trading Course with Trading180
1 × $5.00
Supply And Demand Zone Trading Course with Trading180
1 × $5.00 -
×
 Elite Gap Trading with Nick Santiago - InTheMoneyStocks
1 × $93.00
Elite Gap Trading with Nick Santiago - InTheMoneyStocks
1 × $93.00 -
×
 RSI Basic with Andrew Cardwell
1 × $54.00
RSI Basic with Andrew Cardwell
1 × $54.00 -
×
 Psychology of the Stock Market (1912) with G.C.Selden
1 × $6.00
Psychology of the Stock Market (1912) with G.C.Selden
1 × $6.00 -
×
 ICT Prodigy Trading Course – $650K in Payouts with Alex Solignani
1 × $15.00
ICT Prodigy Trading Course – $650K in Payouts with Alex Solignani
1 × $15.00 -
×
 Ultimate Trading Course with Dodgy's Dungeon
1 × $8.00
Ultimate Trading Course with Dodgy's Dungeon
1 × $8.00

Price Headley – Using Williams %R The BigTrends Way
$6.00
File Size: Cooming soon!
Delivery Time: 1–12 hours
Media Type: Online Course
Content Proof: Watch Here!
You may check content proof of “Price Headley – Using Williams %R The BigTrends Way” below:

Price Headley – Using Williams %R The BigTrends Way
Price Headley’s approach to the Williams %R indicator encapsulates a profound understanding of market dynamics, tailored specifically for those who follow his BigTrends methodology. This article explores how Price Headley utilizes the Williams %R, enhancing its utility to adapt to the rapid swings of the financial markets. Let’s dive into the details of this distinctive technique.
Introduction: Understanding Williams %R
Williams %R, developed by Larry Williams, is a momentum indicator that compares a stock’s closing price to the high-low range over a specific period, typically 14 days.
Part 1: The Basics of Williams %R
How It Works
- The indicator moves between 0 and -100, indicating overbought and oversold levels.
Reading the Indicator
- Values between -20 and 0 suggest overbought conditions; values between -100 and -80 suggest oversold conditions.
Part 2: Price Headley’s BigTrends Modifications
Adjusting the Time Frame
- Price Headley adjusts the standard 14-day period to suit different trading styles, enhancing responsiveness or stability.
Integration with Other Tools
- How Headley integrates Williams %R with other technical tools for a comprehensive analysis.
Part 3: Strategic Implementation
Identifying Entry Points
- Using the modified Williams %R to pinpoint optimal entry points in various market conditions.
Exit Strategies
- Determining exit points using a combination of Williams %R readings and other BigTrends indicators.
Part 4: Case Studies and Examples
Successful Trades Using Williams %R
- Detailed analysis of successful trades that leveraged this approach.
Learning from the Misses
- Reviewing less successful attempts to refine strategy and improve accuracy.
Part 5: Combining Theory with Practice
Practical Tips for Day Traders
- Specific advice for day traders on employing the modified Williams %R in fast-paced markets.
Insights for Long-Term Investors
- Adapting the technique for longer time frames and different market segments.
Part 6: Advanced Techniques and Considerations
Adjustments for Market Volatility
- Customizing the indicator to cope with varying levels of market volatility.
Sector-Specific Applications
- How to apply the modified Williams %R in different sectors such as technology or finance.
Conclusion: Enhancing Your Trading Strategy with Williams %R
Price Headley’s innovative use of the Williams %R indicator demonstrates that even well-established tools can be reimagined and adapted. By integrating these strategies into your trading plan, you can enhance your ability to make informed decisions based on nuanced, real-time data.
FAQs
- What is Williams %R?
- It’s a momentum indicator that measures overbought and oversold levels by comparing the current closing price to the high and low of the past N days.
- How does Price Headley modify the Williams %R?
- Headley may adjust the period settings or integrate it with other tools to improve its effectiveness specific to his BigTrends trading methodology.
- Can Williams %R be used for all types of trading?
- Yes, it can be adapted for short-term day trading, swing trading, and even long-term investment strategies.
- What makes the BigTrends approach unique?
- It emphasizes practical, real-world applications and adjustments tailored to the trader’s specific needs and market conditions.
- How can a trader start using Williams %R in their strategy?
- Begin by understanding the basic mechanics of the indicator, then consider modifications to suit individual trading style and market focus.
Be the first to review “Price Headley – Using Williams %R The BigTrends Way”
You must be logged in to post a review.
Related products

Forex Trading
Original price was: $249.00.$15.00Current price is: $15.00.

Forex Trading
The Complete Guide to Multiple Time Frame Analysis & Reading Price Action with Aiman Almansoori
Original price was: $1,399.00.$13.00Current price is: $13.00.

Original price was: $4,995.00.$15.00Current price is: $15.00.

Original price was: $999.00.$5.00Current price is: $5.00.
Forex Trading
Original price was: $1,898.00.$10.00Current price is: $10.00.

Original price was: $997.00.$8.00Current price is: $8.00.

Original price was: $895.00.$15.00Current price is: $15.00.

Original price was: $197.00.$5.00Current price is: $5.00.

Forex Trading
Original price was: $697.00.$5.00Current price is: $5.00.

Original price was: $799.00.$15.00Current price is: $15.00.

Original price was: $310.00.$23.00Current price is: $23.00.

Forex Trading
Original price was: $999.00.$15.00Current price is: $15.00.
Forex Trading
Original price was: $125.00.$17.00Current price is: $17.00.
Original price was: $2,120.00.$15.00Current price is: $15.00.
Forex Trading
Original price was: $239.00.$8.00Current price is: $8.00.

Original price was: $450.00.$23.00Current price is: $23.00.

Forex Trading
Original price was: $550.00.$5.00Current price is: $5.00.

Forex Trading
Original price was: $1,098.00.$39.00Current price is: $39.00.

Original price was: $299.00.$8.00Current price is: $8.00.

Original price was: $1,849.00.$15.00Current price is: $15.00.

Reviews
There are no reviews yet.