-
×
 A Mathematician Plays The Stock Market with John Allen Paulos
1 × $6.00
A Mathematician Plays The Stock Market with John Allen Paulos
1 × $6.00 -
×
 Sovereign Man Confidential
1 × $6.00
Sovereign Man Confidential
1 × $6.00 -
×
 Forex Trading Course with Mike Norman
1 × $17.00
Forex Trading Course with Mike Norman
1 × $17.00 -
×
 Advanced Spread Trading with Guy Bower - MasterClass Trader
1 × $15.00
Advanced Spread Trading with Guy Bower - MasterClass Trader
1 × $15.00 -
×
 The Best Option Trading Course with David Jaffee - Best Stock Strategy
1 × $15.00
The Best Option Trading Course with David Jaffee - Best Stock Strategy
1 × $15.00 -
×
 WondaFX Signature Strategy with WondaFX
1 × $5.00
WondaFX Signature Strategy with WondaFX
1 × $5.00 -
×
 Crypto Trading Academy with Cheeky Investor - Aussie Day Trader
1 × $13.00
Crypto Trading Academy with Cheeky Investor - Aussie Day Trader
1 × $13.00 -
×
 How To Read The Market Professionally with TradeSmart
1 × $27.00
How To Read The Market Professionally with TradeSmart
1 × $27.00 -
×
 S&P 500 Secrets + Next Level Risk Management with Tradacc
1 × $8.00
S&P 500 Secrets + Next Level Risk Management with Tradacc
1 × $8.00 -
×
 Best of the Best: Collars with Amy Meissner & Scott Ruble
1 × $15.00
Best of the Best: Collars with Amy Meissner & Scott Ruble
1 × $15.00 -
×
 White Phoenix’s The Smart (Money) Approach to Trading with Jayson Casper
1 × $39.00
White Phoenix’s The Smart (Money) Approach to Trading with Jayson Casper
1 × $39.00 -
×
 TradeCraft: Your Path to Peak Performance Trading By Adam Grimes
1 × $15.00
TradeCraft: Your Path to Peak Performance Trading By Adam Grimes
1 × $15.00 -
×
 All Candlestick Patterns Tested And Ranked with Quantified Strategies
1 × $8.00
All Candlestick Patterns Tested And Ranked with Quantified Strategies
1 × $8.00 -
×
 How I Turned 500 USD to 6 Figures in 2 months Trading Options with The Money Printers
1 × $8.00
How I Turned 500 USD to 6 Figures in 2 months Trading Options with The Money Printers
1 × $8.00 -
×
 Options Trading & Ultimate MasterClass With Tyrone Abela - FX Evolution
1 × $54.00
Options Trading & Ultimate MasterClass With Tyrone Abela - FX Evolution
1 × $54.00 -
×
 Algo Trading Masterclass with Ali Casey - StatOasis
1 × $23.00
Algo Trading Masterclass with Ali Casey - StatOasis
1 × $23.00 -
×
 The Trading Blueprint with Brad Goh - The Trading Geek
1 × $5.00
The Trading Blueprint with Brad Goh - The Trading Geek
1 × $5.00 -
×
 The Complete Guide to Multiple Time Frame Analysis & Reading Price Action with Aiman Almansoori
1 × $13.00
The Complete Guide to Multiple Time Frame Analysis & Reading Price Action with Aiman Almansoori
1 × $13.00 -
×
 Order flow self-study training program with iMFtracker
1 × $10.00
Order flow self-study training program with iMFtracker
1 × $10.00 -
×
 5 Day Bootcamp with AWFX AnthonysWorld
1 × $34.00
5 Day Bootcamp with AWFX AnthonysWorld
1 × $34.00 -
×
 Geometry of Markets I with Bruce Gilmore
1 × $6.00
Geometry of Markets I with Bruce Gilmore
1 × $6.00 -
×
 Quantamentals - The Next Great Forefront Of Trading and Investing with Trading Markets
1 × $8.00
Quantamentals - The Next Great Forefront Of Trading and Investing with Trading Markets
1 × $8.00 -
×
 Ultimate Trading Course with Dodgy's Dungeon
1 × $8.00
Ultimate Trading Course with Dodgy's Dungeon
1 × $8.00 -
×
 3 Day WorkShop with HYDRA
1 × $13.00
3 Day WorkShop with HYDRA
1 × $13.00 -
×
 Forecast 2024 Clarification with Larry Williams
1 × $15.00
Forecast 2024 Clarification with Larry Williams
1 × $15.00 -
×
 Advanced Group Analysis Turorial with David Vomund
1 × $6.00
Advanced Group Analysis Turorial with David Vomund
1 × $6.00 -
×
 Forex Strategy Course with Angel Traders
1 × $6.00
Forex Strategy Course with Angel Traders
1 × $6.00 -
×
 Design for Six Sigma with Subir Chowdhury
1 × $6.00
Design for Six Sigma with Subir Chowdhury
1 × $6.00 -
×
 SQX Mentorship with Tip Toe Hippo
1 × $23.00
SQX Mentorship with Tip Toe Hippo
1 × $23.00 -
×
 Crystal Ball Pack PLUS bonus Live Trade By Pat Mitchell - Trick Trades
1 × $20.00
Crystal Ball Pack PLUS bonus Live Trade By Pat Mitchell - Trick Trades
1 × $20.00 -
×
 Quantitative Trading Strategies (1st Edition) with Lars Kestner
1 × $6.00
Quantitative Trading Strategies (1st Edition) with Lars Kestner
1 × $6.00 -
×
 Rockwell Day Trading - Starter Package
1 × $6.00
Rockwell Day Trading - Starter Package
1 × $6.00 -
×
 0 DTE Options Trading Workshop with Aeromir Corporation
1 × $15.00
0 DTE Options Trading Workshop with Aeromir Corporation
1 × $15.00 -
×
 5 Essential Building Blocks to Successful Trading Workshop with Steve "Slim" Miller
1 × $6.00
5 Essential Building Blocks to Successful Trading Workshop with Steve "Slim" Miller
1 × $6.00 -
×
 W. D Gann 's Square Of 9 Applied To Modern Markets with Sean Avidar - Hexatrade350
1 × $23.00
W. D Gann 's Square Of 9 Applied To Modern Markets with Sean Avidar - Hexatrade350
1 × $23.00 -
×
 A Momentum Based Approach to Swing Trading with Dave Landry
1 × $6.00
A Momentum Based Approach to Swing Trading with Dave Landry
1 × $6.00 -
×
 Advanced Strategies for Option Trading Success with James Bittman
1 × $6.00
Advanced Strategies for Option Trading Success with James Bittman
1 × $6.00 -
×
 ICT Prodigy Trading Course – $650K in Payouts with Alex Solignani
1 × $15.00
ICT Prodigy Trading Course – $650K in Payouts with Alex Solignani
1 × $15.00 -
×
 Complete Times Course with Afshin Taghechian
1 × $6.00
Complete Times Course with Afshin Taghechian
1 × $6.00 -
×
 A+ Setups Big Caps Options with Jtrader
1 × $6.00
A+ Setups Big Caps Options with Jtrader
1 × $6.00 -
×
 The Indices Orderflow Masterclass with The Forex Scalpers
1 × $23.00
The Indices Orderflow Masterclass with The Forex Scalpers
1 × $23.00 -
×
 The Orderflows Trade Opportunities Encyclopedia with Michael Valtos
1 × $8.00
The Orderflows Trade Opportunities Encyclopedia with Michael Valtos
1 × $8.00 -
×
 Trading Price Action Trading Ranges (Kindle) with Al Brooks
1 × $6.00
Trading Price Action Trading Ranges (Kindle) with Al Brooks
1 × $6.00 -
×
 Advanced Scalping Techniques Home Study Course with Sami Abusaad - T3Live
1 × $31.00
Advanced Scalping Techniques Home Study Course with Sami Abusaad - T3Live
1 × $31.00 -
×
 4 Strategies That Will Make You a Professional Day Trader with Jerremy Newsome
1 × $6.00
4 Strategies That Will Make You a Professional Day Trader with Jerremy Newsome
1 × $6.00 -
×
 The Naked Eye: Raw Data Analytics with Edgar Torres - Raw Data Analytics
1 × $8.00
The Naked Eye: Raw Data Analytics with Edgar Torres - Raw Data Analytics
1 × $8.00 -
×
 Finserv Corp Complete Course
1 × $4.00
Finserv Corp Complete Course
1 × $4.00 -
×
 The A14 Weekly Option Strategy Workshop with Amy Meissner
1 × $23.00
The A14 Weekly Option Strategy Workshop with Amy Meissner
1 × $23.00 -
×
 3 Technical Indicators to Help You Ride the Elliott Wave Trend with Chris Carolan
1 × $6.00
3 Technical Indicators to Help You Ride the Elliott Wave Trend with Chris Carolan
1 × $6.00 -
×
 The Complete Guide to Market Breadth Indicators: How to Analyze and Evaluate market Direction and Strength - Greg Morris
1 × $6.00
The Complete Guide to Market Breadth Indicators: How to Analyze and Evaluate market Direction and Strength - Greg Morris
1 × $6.00 -
×
 8 Year Presidential Election Pattern (Article) with Adam White
1 × $6.00
8 Year Presidential Election Pattern (Article) with Adam White
1 × $6.00 -
×
 Essentials in Quantitative Trading QT01 By HangukQuant's
1 × $23.00
Essentials in Quantitative Trading QT01 By HangukQuant's
1 × $23.00 -
×
 Futures Commodity Trading with G. Scott Martin
1 × $6.00
Futures Commodity Trading with G. Scott Martin
1 × $6.00 -
×
 Synthetic and Structured Assets: A Practical Guide to Investment and Risk with Erik Banks
1 × $6.00
Synthetic and Structured Assets: A Practical Guide to Investment and Risk with Erik Banks
1 × $6.00 -
×
 Gold Trading Academy Video Course
1 × $23.00
Gold Trading Academy Video Course
1 × $23.00 -
×
 Positive Thinking & Stress Management for Trading with Daley Personal Development
1 × $6.00
Positive Thinking & Stress Management for Trading with Daley Personal Development
1 × $6.00 -
×
 The Master Trader Bundle with Gareth Soloway
1 × $39.00
The Master Trader Bundle with Gareth Soloway
1 × $39.00 -
×
 P.A.T Trading Course (Low Video Quality) with Martin Cole
1 × $6.00
P.A.T Trading Course (Low Video Quality) with Martin Cole
1 × $6.00 -
×
 $20 – 52k 20 pips a day challange with Rafał Zuchowicz - TopMasterTrader
1 × $5.00
$20 – 52k 20 pips a day challange with Rafał Zuchowicz - TopMasterTrader
1 × $5.00 -
×
 Volume Profile 2023 (Elite Pack) with Trader Dale
1 × $5.00
Volume Profile 2023 (Elite Pack) with Trader Dale
1 × $5.00 -
×
 Traders Secret Success Package. Symmetry Wave Trading with Michael Gur Dillon
1 × $6.00
Traders Secret Success Package. Symmetry Wave Trading with Michael Gur Dillon
1 × $6.00 -
×
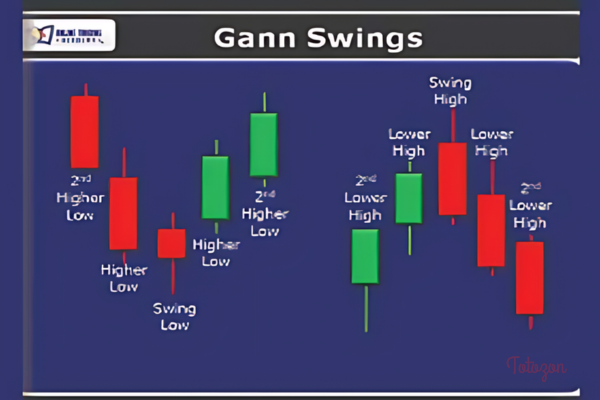 Terry Ashman’s Gann Swings Swing Trading Course (HotTrader Tutorial)
1 × $6.00
Terry Ashman’s Gann Swings Swing Trading Course (HotTrader Tutorial)
1 × $6.00 -
×
 Traders Workshop – Forex Full Course with Jason Stapleton
1 × $6.00
Traders Workshop – Forex Full Course with Jason Stapleton
1 × $6.00 -
×
 Bond Market Course with The Macro Compass
1 × $15.00
Bond Market Course with The Macro Compass
1 × $15.00 -
×
 Core Concepts Mastery with DreamsFX
1 × $5.00
Core Concepts Mastery with DreamsFX
1 × $5.00 -
×
 Trading Short TermSame Day Trades Sep 2023 with Dan Sheridan & Mark Fenton - Sheridan Options Mentoring
1 × $31.00
Trading Short TermSame Day Trades Sep 2023 with Dan Sheridan & Mark Fenton - Sheridan Options Mentoring
1 × $31.00 -
×
 Deep Dive Butterfly Trading Strategy Class with SJG Trades
1 × $41.00
Deep Dive Butterfly Trading Strategy Class with SJG Trades
1 × $41.00 -
×
 Futures Spread Trading Intro Course with Thetradingframework
1 × $6.00
Futures Spread Trading Intro Course with Thetradingframework
1 × $6.00 -
×
 London Close Trade 2.0 with Shirley Hudson & Vic Noble - Forex Mentor
1 × $5.00
London Close Trade 2.0 with Shirley Hudson & Vic Noble - Forex Mentor
1 × $5.00 -
×
 YTC Price Action Trader
1 × $6.00
YTC Price Action Trader
1 × $6.00 -
×
 Sacredscience - W.T.Foster – Sunspots and Weather
1 × $6.00
Sacredscience - W.T.Foster – Sunspots and Weather
1 × $6.00 -
×
 High Probability Trading Using Elliott Wave And Fibonacci Analysis withVic Patel - Forex Training Group
1 × $10.00
High Probability Trading Using Elliott Wave And Fibonacci Analysis withVic Patel - Forex Training Group
1 × $10.00 -
×
 Accelerated Learning Techniques in Action with Colin Rose, Jayne Nicholl & Malcolm Nicholl
1 × $6.00
Accelerated Learning Techniques in Action with Colin Rose, Jayne Nicholl & Malcolm Nicholl
1 × $6.00 -
×
 Advent Forex Course with Cecil Robles
1 × $6.00
Advent Forex Course with Cecil Robles
1 × $6.00 -
×
 All About Stock Market Strategies: The Easy Way To Get Started (All About Series) with David Brown
1 × $6.00
All About Stock Market Strategies: The Easy Way To Get Started (All About Series) with David Brown
1 × $6.00 -
×
 The Delphi Scalper 4 - Video + Metatrader Indicators with Jason Fielder
1 × $6.00
The Delphi Scalper 4 - Video + Metatrader Indicators with Jason Fielder
1 × $6.00 -
×
 Follow the Leader Trading System with Anthony Gibson
1 × $6.00
Follow the Leader Trading System with Anthony Gibson
1 × $6.00 -
×
 TRADING NFX Course with Andrew NFX
1 × $5.00
TRADING NFX Course with Andrew NFX
1 × $5.00 -
×
 Scalp Strategy and Flipping Small Accounts with Opes Trading Group
1 × $5.00
Scalp Strategy and Flipping Small Accounts with Opes Trading Group
1 × $5.00 -
×
 ”Trading With The Generals 2003-2004” Training Course with Kevin Haggerty
1 × $6.00
”Trading With The Generals 2003-2004” Training Course with Kevin Haggerty
1 × $6.00 -
×
 Wysetrade Forex Masterclass 3.0
1 × $6.00
Wysetrade Forex Masterclass 3.0
1 × $6.00 -
×
 The Motley Fool Million Dollar Portfolio: How to Build and Grow a Panic-Proof Investment Portfolio with David Gardner & Tom Gardner
1 × $6.00
The Motley Fool Million Dollar Portfolio: How to Build and Grow a Panic-Proof Investment Portfolio with David Gardner & Tom Gardner
1 × $6.00 -
×
 Profit.ly - Bitcoin Basics
1 × $6.00
Profit.ly - Bitcoin Basics
1 × $6.00 -
×
 3-Line Break Method For Daytrading Eminis with Chris Curran
1 × $6.00
3-Line Break Method For Daytrading Eminis with Chris Curran
1 × $6.00 -
×
 Acclimation Course with Base Camp Trading
1 × $10.00
Acclimation Course with Base Camp Trading
1 × $10.00 -
×
 Profiting With Forex: The Most Effective Tools and Techniques for Trading Currencies - John Jagerson & Wade Hansen
1 × $6.00
Profiting With Forex: The Most Effective Tools and Techniques for Trading Currencies - John Jagerson & Wade Hansen
1 × $6.00 -
×
 Butterfly and Condor Workshop with Aeromir
1 × $15.00
Butterfly and Condor Workshop with Aeromir
1 × $15.00 -
×
 Compass Trading System with Right Line Trading
1 × $39.00
Compass Trading System with Right Line Trading
1 × $39.00 -
×
 Matrix Spread Options Trading Course with Base Camp Trading
1 × $31.00
Matrix Spread Options Trading Course with Base Camp Trading
1 × $31.00 -
×
 Quarterly Theory with Trader Daye
1 × $20.00
Quarterly Theory with Trader Daye
1 × $20.00 -
×
 Marder Videos Reports 2019-2022 with Kevin Marder
1 × $104.00
Marder Videos Reports 2019-2022 with Kevin Marder
1 × $104.00 -
×
 Trade the OEX with Arthur Darack
1 × $6.00
Trade the OEX with Arthur Darack
1 × $6.00 -
×
 What Products to Watch and Why Class with Don Kaufman
1 × $6.00
What Products to Watch and Why Class with Don Kaufman
1 × $6.00 -
×
 Trading Options Effectively with Paul Forchione
1 × $4.00
Trading Options Effectively with Paul Forchione
1 × $4.00 -
×
 Trading Options for Dummies with George Fontanills
1 × $6.00
Trading Options for Dummies with George Fontanills
1 × $6.00 -
×
 3 Volatility Strategies with Quantified Strategies
1 × $23.00
3 Volatility Strategies with Quantified Strategies
1 × $23.00 -
×
 Relentless Trading Course Advanced with Ryan Relentless
1 × $5.00
Relentless Trading Course Advanced with Ryan Relentless
1 × $5.00 -
×
 The Orderflow Masterclass with PrimeTrading
1 × $17.00
The Orderflow Masterclass with PrimeTrading
1 × $17.00 -
×
 Master Class Recording 2019 with Oil Trading Academy
1 × $17.00
Master Class Recording 2019 with Oil Trading Academy
1 × $17.00 -
×
 Pentagonal Time Cycle Theory
1 × $6.00
Pentagonal Time Cycle Theory
1 × $6.00 -
×
 How Do You Read Charts? A Guide to Classic Price Pattern Recognition Class with Professor Jeff Bierman
1 × $6.00
How Do You Read Charts? A Guide to Classic Price Pattern Recognition Class with Professor Jeff Bierman
1 × $6.00 -
×
 4×4 Course with Gregoire Dupont
1 × $6.00
4×4 Course with Gregoire Dupont
1 × $6.00 -
×
 3 Hour Calendar Class With Bonus 3 Months Daily Analysis!
1 × $23.00
3 Hour Calendar Class With Bonus 3 Months Daily Analysis!
1 × $23.00

Winning with Value Charts with Dave Stendahl
$6.00
File Size: Coming soon!
Delivery Time: 1–12 hours
Media Type: Online Course
Content Proof: Watch Here!
You may check content proof of “Winning with Value Charts with Dave Stendahl” below:

Winning with Value Charts with Dave Stendahl
Value Charts, developed by Dave Stendahl, provide traders with a unique tool for identifying overbought and oversold conditions. This article explores the intricacies of Value Charts and how traders can leverage them for consistent success. Let’s dive into the core concepts, practical applications, and benefits of using Value Charts in your trading strategy.
Introduction to Value Charts
Value Charts are a graphical representation that helps traders determine the relative value of a market. This tool is particularly useful for identifying trading opportunities based on price deviations from a perceived fair value.
Why Use Value Charts?
- Accurate Signals: Provides clear overbought and oversold signals.
- Versatility: Applicable to various markets and time frames.
- Simplicity: Easy to understand and implement.
Who is Dave Stendahl?
Dave Stendahl is a renowned trader and author known for his innovative trading strategies and tools. His expertise has helped many traders improve their market analysis and trading outcomes.
Author’s Credentials
- Experience: Over 25 years in trading and financial markets.
- Education: Background in finance and technical analysis.
- Publications: Numerous books and articles on trading strategies.
Core Concepts of Value Charts
1. Understanding Value
Value Charts represent the deviation of price from its perceived fair value, helping traders identify potential buy or sell points.
Fair Value
Fair value is the theoretical price level at which an asset should trade, based on various factors such as supply and demand, market sentiment, and economic conditions.
2. Overbought and Oversold Conditions
Value Charts highlight overbought and oversold conditions, signaling potential reversals or continuation of trends.
Overbought Conditions
When a market is overbought, prices are considered too high relative to fair value, indicating a potential selling opportunity.
Oversold Conditions
Conversely, when a market is oversold, prices are too low relative to fair value, indicating a potential buying opportunity.
3. Value Zones
Value Zones in Value Charts help traders identify the strength of overbought or oversold conditions.
Extreme Value Zones
These zones indicate strong overbought or oversold conditions, often leading to sharp reversals.
Moderate Value Zones
Indicate milder conditions, suggesting potential continuation of the current trend.
Implementing Value Charts in Trading
Step-by-Step Guide
- Set Up Value Charts: Use trading software to incorporate Value Charts into your analysis.
- Identify Value Zones: Look for extreme or moderate value zones.
- Analyze Market Trends: Combine Value Charts with other technical indicators to confirm signals.
- Enter Trades: Execute trades based on identified overbought or oversold conditions.
- Manage Risks: Use stop-loss orders to protect against significant losses.
Example Trade Setup
- Identify Value Zone: Spot an overbought condition in the Value Chart.
- Confirm Signal: Use an additional indicator, like RSI, to confirm the overbought condition.
- Enter Trade: Place a sell order.
- Set Stop-Loss: Place a stop-loss order above the recent high.
- Monitor Trade: Adjust stop-loss and take profit levels as the trade progresses.
Advantages of Using Value Charts
Enhanced Accuracy
Value Charts provide precise signals for overbought and oversold conditions, improving trading accuracy.
Versatility
These charts can be used across different markets, including stocks, forex, and commodities.
Ease of Use
Value Charts are simple to understand and implement, making them accessible for traders at all levels.
Challenges in Trading with Value Charts
Market Volatility
While Value Charts help identify trading opportunities, market volatility can still pose challenges.
False Signals
Like any trading tool, Value Charts can sometimes produce false signals, emphasizing the need for additional confirmation.
Practical Tips for Success
1. Combine with Other Indicators
Use Value Charts in conjunction with other technical indicators to increase the reliability of signals.
2. Regularly Update Your Knowledge
Stay informed about market trends and continuously refine your trading strategy.
3. Practice with Demo Accounts
Use demo accounts to practice and fine-tune your use of Value Charts without financial risk.
Conclusion
Winning with Value Charts, as demonstrated by Dave Stendahl, provides traders with a powerful tool for identifying overbought and oversold conditions. By incorporating Value Charts into your trading strategy, you can enhance your decision-making process and potentially increase your profitability. Whether you’re a novice or an experienced trader, Value Charts offer valuable insights to help you navigate the complex world of trading.
FAQs
1. What are Value Charts?
Value Charts are a graphical tool that helps traders identify overbought and oversold conditions by showing price deviations from perceived fair value.
2. Who can benefit from using Value Charts?
Both novice and experienced traders can benefit from the simplicity and accuracy of Value Charts.
3. How do Value Charts identify overbought and oversold conditions?
Value Charts highlight extreme and moderate value zones that indicate overbought or oversold conditions, suggesting potential trading opportunities.
4. Can Value Charts be used in different markets?
Yes, Value Charts are versatile and can be used in various markets, including stocks, forex, and commodities.
5. How can I practice using Value Charts?
Use demo accounts to practice and refine your use of Value Charts without financial risk.
Be the first to review “Winning with Value Charts with Dave Stendahl”
You must be logged in to post a review.
Related products
Forex Trading
Original price was: $500.00.$5.00Current price is: $5.00.
Original price was: $497.00.$31.00Current price is: $31.00.
Original price was: $2,120.00.$15.00Current price is: $15.00.
Forex Trading
Original price was: $2,997.00.$23.00Current price is: $23.00.
Forex Trading
Original price was: $499.00.$15.00Current price is: $15.00.
Original price was: $450.00.$23.00Current price is: $23.00.
Original price was: $997.00.$8.00Current price is: $8.00.
Original price was: $695.00.$41.00Current price is: $41.00.
Forex Trading
Original price was: $1,898.00.$10.00Current price is: $10.00.
Forex Trading
Original price was: $799.00.$15.00Current price is: $15.00.
Forex Trading
Original price was: $550.00.$5.00Current price is: $5.00.
Forex Trading
Original price was: $125.00.$17.00Current price is: $17.00.
Forex Trading
Original price was: $4,997.00.$27.00Current price is: $27.00.
Forex Trading
Original price was: $1,098.00.$39.00Current price is: $39.00.
Forex Trading
Original price was: $999.00.$15.00Current price is: $15.00.
Original price was: $700.00.$39.00Current price is: $39.00.
Forex Trading
Original price was: $249.00.$15.00Current price is: $15.00.
Forex Trading
Original price was: $797.00.$10.00Current price is: $10.00.
Original price was: $197.00.$5.00Current price is: $5.00.
Forex Trading
Quantamentals – The Next Great Forefront Of Trading and Investing with Trading Markets
Original price was: $1,495.00.$8.00Current price is: $8.00.

Reviews
There are no reviews yet.