-
×
 Getting Started in Forex Trading Strategies with Michael Duane Archer
1 × $6.00
Getting Started in Forex Trading Strategies with Michael Duane Archer
1 × $6.00 -
×
 Sensitivity Analysis in Practice
1 × $6.00
Sensitivity Analysis in Practice
1 × $6.00 -
×
 Fundamentals 101: A Comprehensive Guide to Macroeconomic, Industry, and Financial Statement Analysis Class with Jeff Bierman
1 × $6.00
Fundamentals 101: A Comprehensive Guide to Macroeconomic, Industry, and Financial Statement Analysis Class with Jeff Bierman
1 × $6.00 -
×
 Options Trading. The Hidden Reality Course with Charles Cottle
1 × $6.00
Options Trading. The Hidden Reality Course with Charles Cottle
1 × $6.00 -
×
 Profit Before Work System with John Piper
1 × $6.00
Profit Before Work System with John Piper
1 × $6.00 -
×
 Hedge Fund Market Wizards: How Winning Traders Win with Jack Schwager
1 × $6.00
Hedge Fund Market Wizards: How Winning Traders Win with Jack Schwager
1 × $6.00 -
×
 Altucher’s Top 1% Advisory Newsletter 2016 with James Altucher
1 × $6.00
Altucher’s Top 1% Advisory Newsletter 2016 with James Altucher
1 × $6.00 -
×
 W. D Gann 's Square Of 9 Applied To Modern Markets with Sean Avidar - Hexatrade350
1 × $23.00
W. D Gann 's Square Of 9 Applied To Modern Markets with Sean Avidar - Hexatrade350
1 × $23.00 -
×
 The Orderflow Masterclass with PrimeTrading
1 × $17.00
The Orderflow Masterclass with PrimeTrading
1 × $17.00 -
×
 Quantamentals - The Next Great Forefront Of Trading and Investing with Trading Markets
1 × $8.00
Quantamentals - The Next Great Forefront Of Trading and Investing with Trading Markets
1 × $8.00 -
×
 SQX Mentorship with Tip Toe Hippo
1 × $23.00
SQX Mentorship with Tip Toe Hippo
1 × $23.00 -
×
 Trading Signals And Training 100
1 × $6.00
Trading Signals And Training 100
1 × $6.00 -
×
 The Compleat DayTrader I & II with Jack Bernstein
1 × $6.00
The Compleat DayTrader I & II with Jack Bernstein
1 × $6.00 -
×
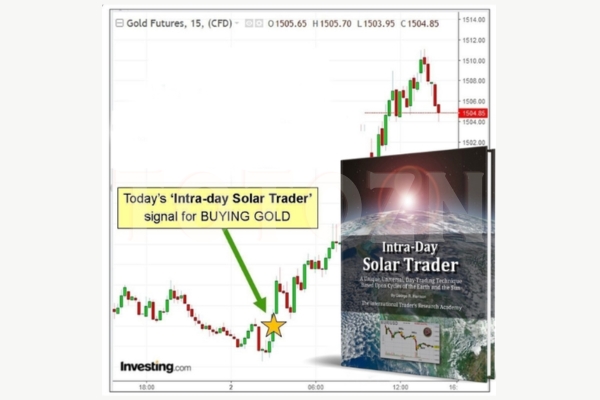 Intra-day Solar Trader with George Harrison
1 × $17.00
Intra-day Solar Trader with George Harrison
1 × $17.00 -
×
 Butterfly and Condor Workshop with Aeromir
1 × $15.00
Butterfly and Condor Workshop with Aeromir
1 × $15.00 -
×
 Trading Short TermSame Day Trades Sep 2023 with Dan Sheridan & Mark Fenton - Sheridan Options Mentoring
1 × $31.00
Trading Short TermSame Day Trades Sep 2023 with Dan Sheridan & Mark Fenton - Sheridan Options Mentoring
1 × $31.00 -
×
 Advanced Breakthroughs in Day Trading DVD course with George Angell
1 × $6.00
Advanced Breakthroughs in Day Trading DVD course with George Angell
1 × $6.00 -
×
 Trading Options Effectively with Paul Forchione
1 × $4.00
Trading Options Effectively with Paul Forchione
1 × $4.00 -
×
 A Trader's Guide to Self-Discipline: Proven Techniques to Improve Trading Profits
1 × $6.00
A Trader's Guide to Self-Discipline: Proven Techniques to Improve Trading Profits
1 × $6.00 -
×
 Developing the Psychological Trader’s Edge with Robin Dayne
1 × $6.00
Developing the Psychological Trader’s Edge with Robin Dayne
1 × $6.00 -
×
 Investment Leadership & Portfolio Management with Brian Singer
1 × $6.00
Investment Leadership & Portfolio Management with Brian Singer
1 × $6.00 -
×
 The Naked Eye: Raw Data Analytics with Edgar Torres - Raw Data Analytics
1 × $8.00
The Naked Eye: Raw Data Analytics with Edgar Torres - Raw Data Analytics
1 × $8.00 -
×
 Traders: Risks, Decisions, and Management in Financial Markets - Mark Fenton-O’Creevy, Nigel Nicholson, Emma Soane & Paul Willman
1 × $6.00
Traders: Risks, Decisions, and Management in Financial Markets - Mark Fenton-O’Creevy, Nigel Nicholson, Emma Soane & Paul Willman
1 × $6.00 -
×
 Create Your Own ETF Hedge Fund: A Do-It-Yourself ETF Strategy for Private Wealth Management with David Fry
1 × $6.00
Create Your Own ETF Hedge Fund: A Do-It-Yourself ETF Strategy for Private Wealth Management with David Fry
1 × $6.00 -
×
 Core Strategy Program + Extended Learning Track with Ota Courses
1 × $124.00
Core Strategy Program + Extended Learning Track with Ota Courses
1 × $124.00 -
×
 Rob’s Swing Trading Methods with Rob Hoffman
1 × $39.00
Rob’s Swing Trading Methods with Rob Hoffman
1 × $39.00 -
×
 Crypto Trading Academy with Cheeky Investor - Aussie Day Trader
1 × $13.00
Crypto Trading Academy with Cheeky Investor - Aussie Day Trader
1 × $13.00 -
×
 TradingMind Course with Jack Bernstein
1 × $6.00
TradingMind Course with Jack Bernstein
1 × $6.00 -
×
 Algo Trading Strategies 2017 with Autotrading Academy
1 × $6.00
Algo Trading Strategies 2017 with Autotrading Academy
1 × $6.00 -
×
 $20 – 52k 20 pips a day challange with Rafał Zuchowicz - TopMasterTrader
1 × $5.00
$20 – 52k 20 pips a day challange with Rafał Zuchowicz - TopMasterTrader
1 × $5.00 -
×
 TRADING NFX Course with Andrew NFX
1 × $5.00
TRADING NFX Course with Andrew NFX
1 × $5.00 -
×
 Forecast 2024 Clarification with Larry Williams
1 × $15.00
Forecast 2024 Clarification with Larry Williams
1 × $15.00 -
×
 Staying Alive in the Markets (Video & Manual) with Mark Cook
1 × $6.00
Staying Alive in the Markets (Video & Manual) with Mark Cook
1 × $6.00 -
×
 Deep Dive Butterfly Trading Strategy Class with SJG Trades
1 × $41.00
Deep Dive Butterfly Trading Strategy Class with SJG Trades
1 × $41.00 -
×
 Secret $100k Meeting with Russell Brunson
1 × $6.00
Secret $100k Meeting with Russell Brunson
1 × $6.00 -
×
 Crystal Ball Pack PLUS bonus Live Trade By Pat Mitchell - Trick Trades
1 × $20.00
Crystal Ball Pack PLUS bonus Live Trade By Pat Mitchell - Trick Trades
1 × $20.00 -
×
 Market Wizards with Jack Schwager
1 × $6.00
Market Wizards with Jack Schwager
1 × $6.00 -
×
 A Bull in China with Jim Rogers
1 × $6.00
A Bull in China with Jim Rogers
1 × $6.00 -
×
 The Trading Blueprint with Brad Goh - The Trading Geek
1 × $5.00
The Trading Blueprint with Brad Goh - The Trading Geek
1 × $5.00 -
×
 Trade What You See How To Profit from Pattern Recognition with Larry Pesavento & Leslie Jouflas
1 × $6.00
Trade What You See How To Profit from Pattern Recognition with Larry Pesavento & Leslie Jouflas
1 × $6.00 -
×
 Options Trading with Nick & Gareth - Nick Santiago & Gareth Soloway - InTheMoneyStocks
1 × $31.00
Options Trading with Nick & Gareth - Nick Santiago & Gareth Soloway - InTheMoneyStocks
1 × $31.00 -
×
 Advanced Scalping Techniques Home Study Course with Sami Abusaad - T3Live
1 × $31.00
Advanced Scalping Techniques Home Study Course with Sami Abusaad - T3Live
1 × $31.00 -
×
 Home Run Options Trading Course with Dave Aquino - Base Camp Trading
1 × $11.00
Home Run Options Trading Course with Dave Aquino - Base Camp Trading
1 × $11.00 -
×
 Quantitative Trading and Money Management, Revised Edition (5th Edition) with Fred Gehm
1 × $6.00
Quantitative Trading and Money Management, Revised Edition (5th Edition) with Fred Gehm
1 × $6.00 -
×
 W.D. Gann’s Secret Divergence Method with Hexatrade350
1 × $5.00
W.D. Gann’s Secret Divergence Method with Hexatrade350
1 × $5.00 -
×
 Matrix Spread Options Trading Course with Base Camp Trading
1 × $31.00
Matrix Spread Options Trading Course with Base Camp Trading
1 × $31.00 -
×
 Advanced Pattern Recognition with John Cameron
1 × $23.00
Advanced Pattern Recognition with John Cameron
1 × $23.00 -
×
 TradeCraft: Your Path to Peak Performance Trading By Adam Grimes
1 × $15.00
TradeCraft: Your Path to Peak Performance Trading By Adam Grimes
1 × $15.00 -
×
 How to Analyze Multifamily Investment Opportunities with Symon He & Brandon Young
1 × $6.00
How to Analyze Multifamily Investment Opportunities with Symon He & Brandon Young
1 × $6.00 -
×
 Hedge Funds for Dummies
1 × $6.00
Hedge Funds for Dummies
1 × $6.00 -
×
 Proven Chart Patterns: Key Indicators for Success in Today’s Markets with Chris Manning
1 × $6.00
Proven Chart Patterns: Key Indicators for Success in Today’s Markets with Chris Manning
1 × $6.00 -
×
 Forex Wave Theory: A Technical Analysis for Spot and Futures Curency Traders - James Bickford
1 × $6.00
Forex Wave Theory: A Technical Analysis for Spot and Futures Curency Traders - James Bickford
1 × $6.00 -
×
 Advanced Spread Trading with Guy Bower - MasterClass Trader
1 × $15.00
Advanced Spread Trading with Guy Bower - MasterClass Trader
1 × $15.00 -
×
 Path to Profits By Scott Redler - T3 Live
1 × $6.00
Path to Profits By Scott Redler - T3 Live
1 × $6.00 -
×
 Candlesticks Explained with Martin Pring
1 × $6.00
Candlesticks Explained with Martin Pring
1 × $6.00 -
×
 How I Trade the QQQs with Don Miller
1 × $6.00
How I Trade the QQQs with Don Miller
1 × $6.00 -
×
 Derivates Demystified
1 × $6.00
Derivates Demystified
1 × $6.00 -
×
 The TC2000 Masterclass Course with Sasha Evdakov - Rise2learn
1 × $23.00
The TC2000 Masterclass Course with Sasha Evdakov - Rise2learn
1 × $23.00 -
×
 Simpler Options - Ultimate Guide to Debit Spreads – Nov 2014
1 × $6.00
Simpler Options - Ultimate Guide to Debit Spreads – Nov 2014
1 × $6.00 -
×
 The Beginners Guide to Commodities Investing with Brian & Gayle Rice
1 × $6.00
The Beginners Guide to Commodities Investing with Brian & Gayle Rice
1 × $6.00 -
×
 The Indices Orderflow Masterclass with The Forex Scalpers
1 × $23.00
The Indices Orderflow Masterclass with The Forex Scalpers
1 × $23.00 -
×
 Advent Forex Course with Cecil Robles
1 × $6.00
Advent Forex Course with Cecil Robles
1 × $6.00 -
×
 Starter Guide to Investing Stocks, Crypto & Precious Metals with Ryan Hogue
1 × $5.00
Starter Guide to Investing Stocks, Crypto & Precious Metals with Ryan Hogue
1 × $5.00 -
×
 Profiletraders - MARKET PROFILE TACTICAL STRATEGIES FOR DAY TRADING
1 × $23.00
Profiletraders - MARKET PROFILE TACTICAL STRATEGIES FOR DAY TRADING
1 × $23.00 -
×
 7 Day FX Mastery Course with Market Masters
1 × $6.00
7 Day FX Mastery Course with Market Masters
1 × $6.00 -
×
 Foundations of Forex Trading with TradeSmart University
1 × $6.00
Foundations of Forex Trading with TradeSmart University
1 × $6.00 -
×
 A Comprehensive Guide to Intraday Trading Strategies & Setups Class with Jeff Bierman
1 × $6.00
A Comprehensive Guide to Intraday Trading Strategies & Setups Class with Jeff Bierman
1 × $6.00 -
×
 The Crash of 1997 (Article) with Hans Hannula
1 × $6.00
The Crash of 1997 (Article) with Hans Hannula
1 × $6.00 -
×
 ProfileTraders - Swing and Price Analysis (May 2014)
1 × $6.00
ProfileTraders - Swing and Price Analysis (May 2014)
1 × $6.00 -
×
 The A14 Weekly Option Strategy Workshop with Amy Meissner
1 × $23.00
The A14 Weekly Option Strategy Workshop with Amy Meissner
1 × $23.00 -
×
 The Complete Guide to Multiple Time Frame Analysis & Reading Price Action with Aiman Almansoori
1 × $13.00
The Complete Guide to Multiple Time Frame Analysis & Reading Price Action with Aiman Almansoori
1 × $13.00 -
×
 Dynamic Time Cycles with Peter Eliades
1 × $6.00
Dynamic Time Cycles with Peter Eliades
1 × $6.00 -
×
 Ron Wagner - Creating a Profitable Trading & Investing Plan + Techniques to Perfect Your Intraday GAP
1 × $6.00
Ron Wagner - Creating a Profitable Trading & Investing Plan + Techniques to Perfect Your Intraday GAP
1 × $6.00 -
×
 Candlestick Trading for Maximum Profitsn with B.M.Davis
1 × $6.00
Candlestick Trading for Maximum Profitsn with B.M.Davis
1 × $6.00 -
×
 Compass Trading System with Right Line Trading
1 × $39.00
Compass Trading System with Right Line Trading
1 × $39.00 -
×
 SnD SMC Course
1 × $10.00
SnD SMC Course
1 × $10.00 -
×
 RiskDoctor RD1 – Introduction to Options Trading the RiskDoctor Way with Charles Cottle
1 × $6.00
RiskDoctor RD1 – Introduction to Options Trading the RiskDoctor Way with Charles Cottle
1 × $6.00

Winning with Value Charts with Dave Stendahl
$6.00
File Size: Coming soon!
Delivery Time: 1–12 hours
Media Type: Online Course
Content Proof: Watch Here!
You may check content proof of “Winning with Value Charts with Dave Stendahl” below:

Winning with Value Charts with Dave Stendahl
Value Charts, developed by Dave Stendahl, provide traders with a unique tool for identifying overbought and oversold conditions. This article explores the intricacies of Value Charts and how traders can leverage them for consistent success. Let’s dive into the core concepts, practical applications, and benefits of using Value Charts in your trading strategy.
Introduction to Value Charts
Value Charts are a graphical representation that helps traders determine the relative value of a market. This tool is particularly useful for identifying trading opportunities based on price deviations from a perceived fair value.
Why Use Value Charts?
- Accurate Signals: Provides clear overbought and oversold signals.
- Versatility: Applicable to various markets and time frames.
- Simplicity: Easy to understand and implement.
Who is Dave Stendahl?
Dave Stendahl is a renowned trader and author known for his innovative trading strategies and tools. His expertise has helped many traders improve their market analysis and trading outcomes.
Author’s Credentials
- Experience: Over 25 years in trading and financial markets.
- Education: Background in finance and technical analysis.
- Publications: Numerous books and articles on trading strategies.
Core Concepts of Value Charts
1. Understanding Value
Value Charts represent the deviation of price from its perceived fair value, helping traders identify potential buy or sell points.
Fair Value
Fair value is the theoretical price level at which an asset should trade, based on various factors such as supply and demand, market sentiment, and economic conditions.
2. Overbought and Oversold Conditions
Value Charts highlight overbought and oversold conditions, signaling potential reversals or continuation of trends.
Overbought Conditions
When a market is overbought, prices are considered too high relative to fair value, indicating a potential selling opportunity.
Oversold Conditions
Conversely, when a market is oversold, prices are too low relative to fair value, indicating a potential buying opportunity.
3. Value Zones
Value Zones in Value Charts help traders identify the strength of overbought or oversold conditions.
Extreme Value Zones
These zones indicate strong overbought or oversold conditions, often leading to sharp reversals.
Moderate Value Zones
Indicate milder conditions, suggesting potential continuation of the current trend.
Implementing Value Charts in Trading
Step-by-Step Guide
- Set Up Value Charts: Use trading software to incorporate Value Charts into your analysis.
- Identify Value Zones: Look for extreme or moderate value zones.
- Analyze Market Trends: Combine Value Charts with other technical indicators to confirm signals.
- Enter Trades: Execute trades based on identified overbought or oversold conditions.
- Manage Risks: Use stop-loss orders to protect against significant losses.
Example Trade Setup
- Identify Value Zone: Spot an overbought condition in the Value Chart.
- Confirm Signal: Use an additional indicator, like RSI, to confirm the overbought condition.
- Enter Trade: Place a sell order.
- Set Stop-Loss: Place a stop-loss order above the recent high.
- Monitor Trade: Adjust stop-loss and take profit levels as the trade progresses.
Advantages of Using Value Charts
Enhanced Accuracy
Value Charts provide precise signals for overbought and oversold conditions, improving trading accuracy.
Versatility
These charts can be used across different markets, including stocks, forex, and commodities.
Ease of Use
Value Charts are simple to understand and implement, making them accessible for traders at all levels.
Challenges in Trading with Value Charts
Market Volatility
While Value Charts help identify trading opportunities, market volatility can still pose challenges.
False Signals
Like any trading tool, Value Charts can sometimes produce false signals, emphasizing the need for additional confirmation.
Practical Tips for Success
1. Combine with Other Indicators
Use Value Charts in conjunction with other technical indicators to increase the reliability of signals.
2. Regularly Update Your Knowledge
Stay informed about market trends and continuously refine your trading strategy.
3. Practice with Demo Accounts
Use demo accounts to practice and fine-tune your use of Value Charts without financial risk.
Conclusion
Winning with Value Charts, as demonstrated by Dave Stendahl, provides traders with a powerful tool for identifying overbought and oversold conditions. By incorporating Value Charts into your trading strategy, you can enhance your decision-making process and potentially increase your profitability. Whether you’re a novice or an experienced trader, Value Charts offer valuable insights to help you navigate the complex world of trading.
FAQs
1. What are Value Charts?
Value Charts are a graphical tool that helps traders identify overbought and oversold conditions by showing price deviations from perceived fair value.
2. Who can benefit from using Value Charts?
Both novice and experienced traders can benefit from the simplicity and accuracy of Value Charts.
3. How do Value Charts identify overbought and oversold conditions?
Value Charts highlight extreme and moderate value zones that indicate overbought or oversold conditions, suggesting potential trading opportunities.
4. Can Value Charts be used in different markets?
Yes, Value Charts are versatile and can be used in various markets, including stocks, forex, and commodities.
5. How can I practice using Value Charts?
Use demo accounts to practice and refine your use of Value Charts without financial risk.
Be the first to review “Winning with Value Charts with Dave Stendahl”
You must be logged in to post a review.
Related products
Original price was: $4,995.00.$15.00Current price is: $15.00.
Forex Trading
Original price was: $799.00.$15.00Current price is: $15.00.

Forex Trading
Original price was: $797.00.$10.00Current price is: $10.00.
Forex Trading
Original price was: $697.00.$5.00Current price is: $5.00.
Forex Trading
Quantamentals – The Next Great Forefront Of Trading and Investing with Trading Markets
Original price was: $1,495.00.$8.00Current price is: $8.00.
Forex Trading
Original price was: $1,098.00.$39.00Current price is: $39.00.
Forex Trading
Original price was: $1,898.00.$10.00Current price is: $10.00.

Original price was: $2,120.00.$15.00Current price is: $15.00.

Forex Trading
Original price was: $999.00.$15.00Current price is: $15.00.

Original price was: $1,200.00.$23.00Current price is: $23.00.
Forex Trading
Original price was: $125.00.$17.00Current price is: $17.00.

Original price was: $1,800.00.$54.00Current price is: $54.00.

Original price was: $799.00.$15.00Current price is: $15.00.
Original price was: $139.00.$23.00Current price is: $23.00.
Original price was: $895.00.$15.00Current price is: $15.00.
Original price was: $497.00.$11.00Current price is: $11.00.
Forex Trading
Original price was: $397.00.$31.00Current price is: $31.00.
Original price was: $695.00.$41.00Current price is: $41.00.

Forex Trading
Original price was: $2,000.00.$23.00Current price is: $23.00.
Original price was: $649.00.$20.00Current price is: $20.00.

Reviews
There are no reviews yet.