-
×
 The Science of Trading with Mark Boucher
1 × $6.00
The Science of Trading with Mark Boucher
1 × $6.00 -
×
 Advanced Price Action Techniques with Andrew Jeken
1 × $6.00
Advanced Price Action Techniques with Andrew Jeken
1 × $6.00 -
×
 TradeCraft: Your Path to Peak Performance Trading By Adam Grimes
1 × $15.00
TradeCraft: Your Path to Peak Performance Trading By Adam Grimes
1 × $15.00 -
×
 Weekly Power Options Strategies
1 × $6.00
Weekly Power Options Strategies
1 × $6.00 -
×
 SQX Mentorship with Tip Toe Hippo
1 × $23.00
SQX Mentorship with Tip Toe Hippo
1 × $23.00 -
×
 WyseTrade Trading Masterclass Course
1 × $5.00
WyseTrade Trading Masterclass Course
1 × $5.00 -
×
 XJO Quant - High Probability Trading Setups on ASX 200 Index
1 × $31.00
XJO Quant - High Probability Trading Setups on ASX 200 Index
1 × $31.00 -
×
 Options Trading & Ultimate MasterClass With Tyrone Abela - FX Evolution
1 × $54.00
Options Trading & Ultimate MasterClass With Tyrone Abela - FX Evolution
1 × $54.00 -
×
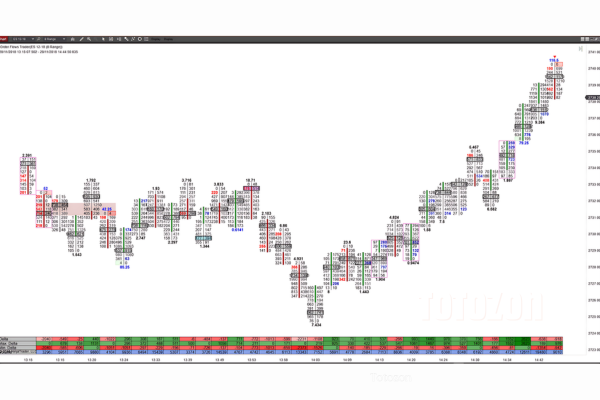 Order Flow With The Power Of Point Of Control Course and The Imbalance
1 × $6.00
Order Flow With The Power Of Point Of Control Course and The Imbalance
1 × $6.00 -
×
 The Sixth Market. The Electronic Investor Revolution with Howard Abell
1 × $6.00
The Sixth Market. The Electronic Investor Revolution with Howard Abell
1 × $6.00 -
×
 Options University - 3rd Anual Forex Superconference
1 × $3.00
Options University - 3rd Anual Forex Superconference
1 × $3.00 -
×
 Trade Your Way to Wealth with Bill Kraft
1 × $6.00
Trade Your Way to Wealth with Bill Kraft
1 × $6.00 -
×
 How To Read The Market Professionally with TradeSmart
1 × $27.00
How To Read The Market Professionally with TradeSmart
1 × $27.00 -
×
 TRADING NFX Course with Andrew NFX
1 × $5.00
TRADING NFX Course with Andrew NFX
1 × $5.00 -
×
 B.O.S.S. Carbon with Pat Mitchell – Trick Trades
1 × $8.00
B.O.S.S. Carbon with Pat Mitchell – Trick Trades
1 × $8.00 -
×
 Quantamentals - The Next Great Forefront Of Trading and Investing with Trading Markets
1 × $8.00
Quantamentals - The Next Great Forefront Of Trading and Investing with Trading Markets
1 × $8.00 -
×
 Breakouts: The Quintessential Approach – Feibel Trading
1 × $31.00
Breakouts: The Quintessential Approach – Feibel Trading
1 × $31.00 -
×
 Compass Trading System with Right Line Trading
1 × $39.00
Compass Trading System with Right Line Trading
1 × $39.00 -
×
 Trade Australian Share CFDs with Brian Griffin
1 × $6.00
Trade Australian Share CFDs with Brian Griffin
1 × $6.00 -
×
 Essentials in Quantitative Trading QT01 By HangukQuant's
1 × $23.00
Essentials in Quantitative Trading QT01 By HangukQuant's
1 × $23.00 -
×
 To Hell & Back with Ken Stern
1 × $6.00
To Hell & Back with Ken Stern
1 × $6.00 -
×
 Crypto Trading Academy with Cheeky Investor - Aussie Day Trader
1 × $13.00
Crypto Trading Academy with Cheeky Investor - Aussie Day Trader
1 × $13.00 -
×
 Squeeze Pro Indicator + Buy/Sell Signals (PREMIUM)
1 × $85.00
Squeeze Pro Indicator + Buy/Sell Signals (PREMIUM)
1 × $85.00 -
×
 LT Gamma Confirmation
1 × $23.00
LT Gamma Confirmation
1 × $23.00 -
×
 Intermediate Stock Course
1 × $54.00
Intermediate Stock Course
1 × $54.00 -
×
 Day Trading Systems & Methods with Charles Le Beau, David Lucas
1 × $6.00
Day Trading Systems & Methods with Charles Le Beau, David Lucas
1 × $6.00 -
×
 Trade for Life 7-day Intensive Training Course - Oliver Velez & Dan Gibby
1 × $6.00
Trade for Life 7-day Intensive Training Course - Oliver Velez & Dan Gibby
1 × $6.00 -
×
 XLT - Futures Trading Course
1 × $54.00
XLT - Futures Trading Course
1 × $54.00 -
×
 Tom Williams Final Mentorship Course
1 × $6.00
Tom Williams Final Mentorship Course
1 × $6.00 -
×
 The Prop Trading Code with Brannigan Barrett - Axia Futures
1 × $23.00
The Prop Trading Code with Brannigan Barrett - Axia Futures
1 × $23.00 -
×
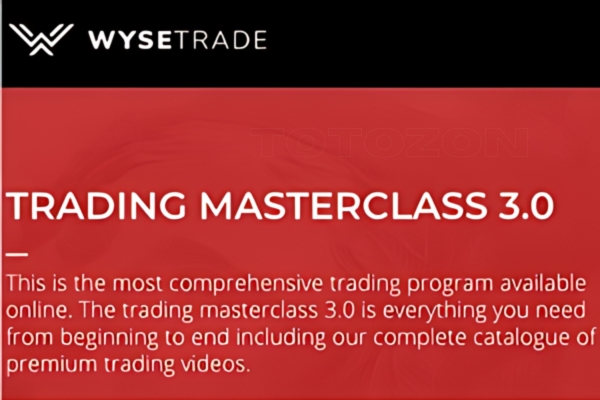 Wysetrade Forex Masterclass 3.0
1 × $6.00
Wysetrade Forex Masterclass 3.0
1 × $6.00 -
×
 Trading the Moves - Consistent Gains in All Markets with Ed Downs
1 × $6.00
Trading the Moves - Consistent Gains in All Markets with Ed Downs
1 × $6.00 -
×
 Scalp Strategy and Flipping Small Accounts with Opes Trading Group
1 × $5.00
Scalp Strategy and Flipping Small Accounts with Opes Trading Group
1 × $5.00 -
×
 Use the News with Maria Bartiromo
1 × $6.00
Use the News with Maria Bartiromo
1 × $6.00 -
×
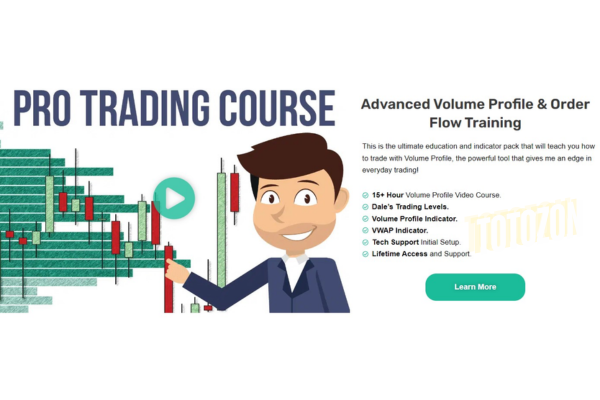 Advanced Volume Profile + Order Flow Video Course with Trader Dale
1 × $13.00
Advanced Volume Profile + Order Flow Video Course with Trader Dale
1 × $13.00 -
×
 Momentum Signals Interactive Training Course 2010-2011
1 × $6.00
Momentum Signals Interactive Training Course 2010-2011
1 × $6.00 -
×
 Home Run Options Trading Course with Dave Aquino - Base Camp Trading
1 × $11.00
Home Run Options Trading Course with Dave Aquino - Base Camp Trading
1 × $11.00 -
×
 0 DTE Options Trading Workshop with Aeromir Corporation
1 × $15.00
0 DTE Options Trading Workshop with Aeromir Corporation
1 × $15.00 -
×
 PRICE ACTION MASTERY
1 × $39.00
PRICE ACTION MASTERY
1 × $39.00 -
×
 Best of the Best: Collars with Amy Meissner & Scott Ruble
1 × $15.00
Best of the Best: Collars with Amy Meissner & Scott Ruble
1 × $15.00 -
×
 Forex Strategy Course with Angel Traders
1 × $6.00
Forex Strategy Course with Angel Traders
1 × $6.00 -
×
 The Ultimate Trading Guide & Code with George Pruitt, John R.Hill
1 × $6.00
The Ultimate Trading Guide & Code with George Pruitt, John R.Hill
1 × $6.00 -
×
 Ultimate Trading Course with Dodgy's Dungeon
1 × $8.00
Ultimate Trading Course with Dodgy's Dungeon
1 × $8.00 -
×
 The Ultimate Forex Structure Course
1 × $31.00
The Ultimate Forex Structure Course
1 × $31.00 -
×
 Trading Halls Of Knowledge - Road to Consistent Trading Profits with Jarrod Goodwin
1 × $6.00
Trading Halls Of Knowledge - Road to Consistent Trading Profits with Jarrod Goodwin
1 × $6.00 -
×
 $20 – 52k 20 pips a day challange with Rafał Zuchowicz - TopMasterTrader
1 × $5.00
$20 – 52k 20 pips a day challange with Rafał Zuchowicz - TopMasterTrader
1 × $5.00 -
×
 ASFX Beginner Training Course & VIP Chat with ASFX Day Trading
1 × $31.00
ASFX Beginner Training Course & VIP Chat with ASFX Day Trading
1 × $31.00 -
×
 Analysis Of Entry Signals Part Two (Fundamentals) with Joe Marwood
1 × $23.00
Analysis Of Entry Signals Part Two (Fundamentals) with Joe Marwood
1 × $23.00 -
×
 Beat The Binaries
1 × $15.00
Beat The Binaries
1 × $15.00 -
×
 Detecting Trend Direction & Strength (Article) with Barbara Star
1 × $6.00
Detecting Trend Direction & Strength (Article) with Barbara Star
1 × $6.00 -
×
 Advance Gap Trading with Master Trader
1 × $39.00
Advance Gap Trading with Master Trader
1 × $39.00 -
×
 Complete Set of Members Area Files
1 × $6.00
Complete Set of Members Area Files
1 × $6.00 -
×
 Onyx Trade House
1 × $7.00
Onyx Trade House
1 × $7.00 -
×
 Earnings Boot Camp with Big Trends
1 × $6.00
Earnings Boot Camp with Big Trends
1 × $6.00 -
×
 Bond Market Course with The Macro Compass
1 × $15.00
Bond Market Course with The Macro Compass
1 × $15.00 -
×
 Crystal Ball Pack PLUS bonus Live Trade By Pat Mitchell - Trick Trades
1 × $20.00
Crystal Ball Pack PLUS bonus Live Trade By Pat Mitchell - Trick Trades
1 × $20.00 -
×
 International Mergers & Acquisitions Activity Since 1990 with Greg Gregoriou & Luc Renneboog
1 × $6.00
International Mergers & Acquisitions Activity Since 1990 with Greg Gregoriou & Luc Renneboog
1 × $6.00 -
×
 Advanced Spread Trading with Guy Bower - MasterClass Trader
1 × $15.00
Advanced Spread Trading with Guy Bower - MasterClass Trader
1 × $15.00 -
×
 Opening Bell Income Strategy with Todd Mitchell
1 × $54.00
Opening Bell Income Strategy with Todd Mitchell
1 × $54.00 -
×
 RiskIllustrator By Charles Cottle - The Risk Doctor
1 × $31.00
RiskIllustrator By Charles Cottle - The Risk Doctor
1 × $31.00 -
×
 The Naked Eye: Raw Data Analytics with Edgar Torres - Raw Data Analytics
1 × $8.00
The Naked Eye: Raw Data Analytics with Edgar Torres - Raw Data Analytics
1 × $8.00 -
×
 Trading Short TermSame Day Trades Sep 2023 with Dan Sheridan & Mark Fenton - Sheridan Options Mentoring
1 × $31.00
Trading Short TermSame Day Trades Sep 2023 with Dan Sheridan & Mark Fenton - Sheridan Options Mentoring
1 × $31.00 -
×
 Intro to Options Trading with Real Life Trading
1 × $13.00
Intro to Options Trading with Real Life Trading
1 × $13.00 -
×
 Order flow self-study training program with iMFtracker
1 × $10.00
Order flow self-study training program with iMFtracker
1 × $10.00 -
×
 The Investor Accelerator Premium Membership
1 × $34.00
The Investor Accelerator Premium Membership
1 × $34.00 -
×
 The A14 Weekly Option Strategy Workshop with Amy Meissner
1 × $23.00
The A14 Weekly Option Strategy Workshop with Amy Meissner
1 × $23.00 -
×
 Trading Analysis Crash Course
1 × $23.00
Trading Analysis Crash Course
1 × $23.00 -
×
 The Orderflows Trade Opportunities Encyclopedia with Michael Valtos
1 × $8.00
The Orderflows Trade Opportunities Encyclopedia with Michael Valtos
1 × $8.00 -
×
 ICT Prodigy Trading Course – $650K in Payouts with Alex Solignani
1 × $15.00
ICT Prodigy Trading Course – $650K in Payouts with Alex Solignani
1 × $15.00 -
×
 The Best Option Trading Course with David Jaffee - Best Stock Strategy
1 × $15.00
The Best Option Trading Course with David Jaffee - Best Stock Strategy
1 × $15.00 -
×
 Intra-Day Trading Tactics with Greg Capra
1 × $6.00
Intra-Day Trading Tactics with Greg Capra
1 × $6.00 -
×
 The Orderflow Masterclass with PrimeTrading
1 × $17.00
The Orderflow Masterclass with PrimeTrading
1 × $17.00 -
×
 Evolution Markets (Full Main Course)
1 × $5.00
Evolution Markets (Full Main Course)
1 × $5.00

TTM Slingshot & Value Charts Indicators
$6.00
File Size: Coming soon!
Delivery Time: 1–12 hours
Media Type: Online Course
TTM Slingshot & Value Charts Indicators
Introduction to TTM Slingshot & Value Charts
In the dynamic world of trading, having the right tools can make all the difference. Two such powerful tools are the TTM Slingshot and Value Charts Indicators. These indicators provide traders with crucial insights, helping them navigate market complexities and make informed decisions.
Understanding TTM Slingshot
What is TTM Slingshot?
The TTM Slingshot is an advanced trading indicator developed by John Carter. It combines multiple moving averages to identify potential breakout points in the market. By analyzing the relationship between these moving averages, the TTM Slingshot helps traders spot opportunities for entering or exiting trades.
Key Features of TTM Slingshot
- Multiple Moving Averages: Uses short-term and long-term moving averages.
- Breakout Identification: Detects potential breakout points.
- Versatility: Applicable across various markets and timeframes.
Benefits of Using TTM Slingshot
Enhanced Market Analysis
The TTM Slingshot provides a detailed analysis of market trends, allowing traders to anticipate significant price movements. This indicator’s ability to pinpoint breakout points is invaluable for making timely trading decisions.
Improved Trading Accuracy
By combining multiple moving averages, the TTM Slingshot offers a comprehensive view of the market. This integration reduces noise and enhances the accuracy of predictions, leading to more successful trades.
Setting Up TTM Slingshot
Choosing the Right Platform
To utilize the TTM Slingshot, you’ll need a trading platform that supports custom indicators. Platforms like Thinkorswim and TradeStation are popular choices among traders.
Installing the Indicator
- Download the Indicator: Obtain the TTM Slingshot file compatible with your trading platform.
- Open Your Platform: Launch the trading platform.
- Add the Indicator: Navigate to the ‘Indicators’ section and add the TTM Slingshot file.
- Customize Settings: Adjust the settings to align with your trading strategy.
Understanding Value Charts Indicators
What are Value Charts Indicators?
Value Charts Indicators are tools that measure the relative value of a security based on its price history. These indicators help traders determine whether a security is overvalued, undervalued, or fairly valued, providing a clear picture of potential trading opportunities.
Key Features of Value Charts Indicators
- Relative Value Measurement: Assesses the value of a security.
- Overbought/Oversold Conditions: Identifies extreme market conditions.
- Visual Representation: Displays value levels on a chart for easy interpretation.
Benefits of Using Value Charts Indicators
Identifying Market Extremes
Value Charts Indicators are excellent for spotting overbought and oversold conditions. By identifying these extremes, traders can make strategic decisions about entering or exiting positions.
Enhancing Risk Management
These indicators aid in risk management by providing insights into the relative value of a security. Traders can use this information to set stop-loss levels and protect their investments.
Setting Up Value Charts Indicators
Selecting the Appropriate Platform
Choose a trading platform that supports Value Charts Indicators. Many modern trading platforms, such as NinjaTrader and MetaTrader, offer these indicators.
Installing the Indicator
- Download the Indicator: Obtain the Value Charts Indicator file for your platform.
- Open Your Platform: Start the trading platform.
- Add the Indicator: Go to the ‘Indicators’ section and add the Value Charts file.
- Configure Settings: Customize the settings to fit your trading approach.
How to Use TTM Slingshot & Value Charts Together
Combining Indicators for Better Insights
Using TTM Slingshot and Value Charts Indicators together can enhance your market analysis. While TTM Slingshot identifies breakout points, Value Charts Indicators help assess the relative value of the security, providing a more comprehensive view.
Practical Application
- Entry Points: Use TTM Slingshot to identify breakout points and confirm with Value Charts Indicators to ensure the security is not overvalued.
- Exit Points: Value Charts Indicators can signal overbought conditions, indicating a good time to exit, while TTM Slingshot confirms the end of a trend.
Advanced Strategies with TTM Slingshot & Value Charts
Pairing with Other Indicators
For even more robust analysis, pair TTM Slingshot and Value Charts Indicators with other tools such as RSI (Relative Strength Index) and MACD (Moving Average Convergence Divergence).
Developing a Trading Plan
Create a detailed trading plan that incorporates these indicators. Define your entry and exit points, risk management strategies, and the specific market conditions you’re targeting.
Real-Life Examples
Successful Trade Case Study
Consider a scenario where the TTM Slingshot indicates a breakout, and Value Charts Indicators show the security is undervalued. Entering a trade at this point could lead to significant profits as the price moves to its fair value.
Learning from Mistakes
Analyze trades where the indicators did not predict the expected outcome. Understanding these failures can help refine your strategy and improve future performance.
Conclusion
Maximizing Your Trading Success
The TTM Slingshot and Value Charts Indicators are powerful tools that, when used together, can significantly enhance your trading strategy. By providing insights into market trends and relative value, these indicators help you make more informed decisions.
Taking the Next Step
Start by setting up these indicators on your trading platform. Practice interpreting the signals and integrating them into your trading strategy to see the benefits firsthand.

FAQs
What is the TTM Slingshot indicator?
The TTM Slingshot is a trading tool that uses multiple moving averages to identify breakout points in the market.
How do Value Charts Indicators work?
Value Charts Indicators measure the relative value of a security, helping traders identify overbought and oversold conditions.
Can these indicators be used together?
Yes, combining TTM Slingshot and Value Charts Indicators provides a comprehensive analysis of market trends and security value.
Which platforms support these indicators?
Platforms like Thinkorswim, TradeStation, NinjaTrader, and MetaTrader support TTM Slingshot and Value Charts Indicators.
How do I install these indicators?
Download the respective indicator files, open your trading platform, and add the indicators through the ‘Indicators’ section.
Be the first to review “TTM Slingshot & Value Charts Indicators”
You must be logged in to post a review.
Related products

Forex Trading
The Complete Guide to Multiple Time Frame Analysis & Reading Price Action with Aiman Almansoori
Original price was: $1,399.00.$13.00Current price is: $13.00.
Original price was: $997.00.$13.00Current price is: $13.00.
Original price was: $649.00.$20.00Current price is: $20.00.
Forex Trading
Original price was: $239.00.$8.00Current price is: $8.00.
Forex Trading
Original price was: $1,898.00.$10.00Current price is: $10.00.
Original price was: $1,800.00.$54.00Current price is: $54.00.
Original price was: $497.00.$11.00Current price is: $11.00.

Forex Trading
Original price was: $2,995.00.$31.00Current price is: $31.00.

Forex Trading
Original price was: $550.00.$5.00Current price is: $5.00.

Original price was: $139.00.$23.00Current price is: $23.00.
Original price was: $197.00.$5.00Current price is: $5.00.
Original price was: $4,995.00.$15.00Current price is: $15.00.
Original price was: $895.00.$15.00Current price is: $15.00.
Original price was: $999.00.$5.00Current price is: $5.00.
Original price was: $1,200.00.$23.00Current price is: $23.00.
Forex Trading
Original price was: $1,098.00.$39.00Current price is: $39.00.

Forex Trading
Original price was: $697.00.$5.00Current price is: $5.00.
Forex Trading
Original price was: $850.00.$23.00Current price is: $23.00.
Original price was: $799.00.$15.00Current price is: $15.00.
Forex Trading
Original price was: $4,997.00.$27.00Current price is: $27.00.

Reviews
There are no reviews yet.