-
×
 The Indices Orderflow Masterclass with The Forex Scalpers
1 × $23.00
The Indices Orderflow Masterclass with The Forex Scalpers
1 × $23.00 -
×
 Quantamentals - The Next Great Forefront Of Trading and Investing with Trading Markets
1 × $8.00
Quantamentals - The Next Great Forefront Of Trading and Investing with Trading Markets
1 × $8.00 -
×
 Order flow self-study training program with iMFtracker
1 × $10.00
Order flow self-study training program with iMFtracker
1 × $10.00 -
×
 WITS Turbo Seminars with Brian James Sklenka
1 × $6.00
WITS Turbo Seminars with Brian James Sklenka
1 × $6.00 -
×
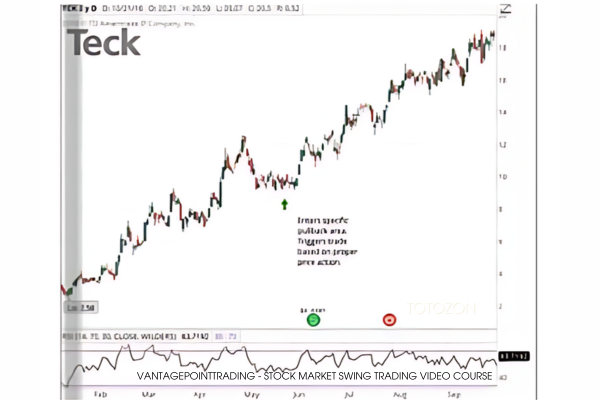 Vantagepointtrading - Stock Market Swing Trading Video Course
1 × $15.00
Vantagepointtrading - Stock Market Swing Trading Video Course
1 × $15.00 -
×
 Deep Dive Butterfly Trading Strategy Class with SJG Trades
1 × $41.00
Deep Dive Butterfly Trading Strategy Class with SJG Trades
1 × $41.00 -
×
 The Naked Eye: Raw Data Analytics with Edgar Torres - Raw Data Analytics
1 × $8.00
The Naked Eye: Raw Data Analytics with Edgar Torres - Raw Data Analytics
1 × $8.00 -
×
 Zen in the Markets with Edward Allen Toppel
1 × $6.00
Zen in the Markets with Edward Allen Toppel
1 × $6.00 -
×
 XLT - Futures Trading Course
1 × $54.00
XLT - Futures Trading Course
1 × $54.00 -
×
 Triple Play Trading Ideas & Mentoring with MarketGauge
1 × $54.00
Triple Play Trading Ideas & Mentoring with MarketGauge
1 × $54.00 -
×
 Winning with Value Charts with Dave Stendahl
1 × $6.00
Winning with Value Charts with Dave Stendahl
1 × $6.00 -
×
 The Undergroundtrader.com Guide to Electronic Trading with Jea Yu
1 × $6.00
The Undergroundtrader.com Guide to Electronic Trading with Jea Yu
1 × $6.00 -
×
 CFA Level 1 – PassMaster 2004 CD with Stalla
1 × $6.00
CFA Level 1 – PassMaster 2004 CD with Stalla
1 × $6.00 -
×
 Astro-Cycles and Speculative Markets with L.J.Jensen
1 × $6.00
Astro-Cycles and Speculative Markets with L.J.Jensen
1 × $6.00 -
×
 Matrix Spread Options Trading Course with Base Camp Trading
1 × $31.00
Matrix Spread Options Trading Course with Base Camp Trading
1 × $31.00 -
×
 The Complete Guide to Multiple Time Frame Analysis & Reading Price Action with Aiman Almansoori
1 × $13.00
The Complete Guide to Multiple Time Frame Analysis & Reading Price Action with Aiman Almansoori
1 × $13.00 -
×
 Video Bundle - 4d & "Into The Abyss" with Blackrabbitfx
1 × $6.00
Video Bundle - 4d & "Into The Abyss" with Blackrabbitfx
1 × $6.00 -
×
 Trading Pivot Points with Andrew Peters
1 × $6.00
Trading Pivot Points with Andrew Peters
1 × $6.00 -
×
 Scalp Strategy and Flipping Small Accounts with Opes Trading Group
1 × $5.00
Scalp Strategy and Flipping Small Accounts with Opes Trading Group
1 × $5.00 -
×
 Crypto Trading Academy with Cheeky Investor - Aussie Day Trader
1 × $13.00
Crypto Trading Academy with Cheeky Investor - Aussie Day Trader
1 × $13.00 -
×
 Trend Following: How Great Traders Make Millions in Up or Down Markets with Michael Covel
1 × $6.00
Trend Following: How Great Traders Make Millions in Up or Down Markets with Michael Covel
1 × $6.00 -
×
 Ultimate Trading Course with Dodgy's Dungeon
1 × $8.00
Ultimate Trading Course with Dodgy's Dungeon
1 × $8.00 -
×
 Zen8 Forex Hedging Program with Hugh Kimura - Trading Heroes
1 × $5.00
Zen8 Forex Hedging Program with Hugh Kimura - Trading Heroes
1 × $5.00 -
×
 Advanced Price Action Course with ZenFX
1 × $5.00
Advanced Price Action Course with ZenFX
1 × $5.00 -
×
 How To Read The Market Professionally with TradeSmart
1 × $27.00
How To Read The Market Professionally with TradeSmart
1 × $27.00 -
×
 ICT Prodigy Trading Course – $650K in Payouts with Alex Solignani
1 × $15.00
ICT Prodigy Trading Course – $650K in Payouts with Alex Solignani
1 × $15.00 -
×
 Butterfly and Condor Workshop with Aeromir
1 × $15.00
Butterfly and Condor Workshop with Aeromir
1 × $15.00 -
×
 Home Run Options Trading Course with Dave Aquino - Base Camp Trading
1 × $11.00
Home Run Options Trading Course with Dave Aquino - Base Camp Trading
1 × $11.00 -
×
 Winning the Losers Game with Charles Ellis
1 × $6.00
Winning the Losers Game with Charles Ellis
1 × $6.00 -
×
 Options Trading & Ultimate MasterClass With Tyrone Abela - FX Evolution
1 × $54.00
Options Trading & Ultimate MasterClass With Tyrone Abela - FX Evolution
1 × $54.00 -
×
 Advanced Strategy Design Techniques Bundle with NinjaTrader
1 × $20.00
Advanced Strategy Design Techniques Bundle with NinjaTrader
1 × $20.00 -
×
 Tradingology Home Study Options Course
1 × $23.00
Tradingology Home Study Options Course
1 × $23.00 -
×
 SQX Mentorship with Tip Toe Hippo
1 × $23.00
SQX Mentorship with Tip Toe Hippo
1 × $23.00 -
×
 Zm Capitals Full course + Ebook with Zain Mokhles - ZmCapitals
1 × $31.00
Zm Capitals Full course + Ebook with Zain Mokhles - ZmCapitals
1 × $31.00 -
×
 Advanced Elliott Wave Analysis : Complex Patterns, Intermarket Relationships, and Global Cash Flow Analysis
1 × $6.00
Advanced Elliott Wave Analysis : Complex Patterns, Intermarket Relationships, and Global Cash Flow Analysis
1 × $6.00 -
×
 Complete Book Set
1 × $8.00
Complete Book Set
1 × $8.00 -
×
 WyseTrade Trading Masterclass Course
1 × $5.00
WyseTrade Trading Masterclass Course
1 × $5.00 -
×
 60 Seconds Sure Shot Strategy with Albert E
1 × $6.00
60 Seconds Sure Shot Strategy with Albert E
1 × $6.00 -
×
 Trend Trading: Timing Market Tides with Kedrick Brown
1 × $6.00
Trend Trading: Timing Market Tides with Kedrick Brown
1 × $6.00 -
×
 Crystal Ball Pack PLUS bonus Live Trade By Pat Mitchell - Trick Trades
1 × $20.00
Crystal Ball Pack PLUS bonus Live Trade By Pat Mitchell - Trick Trades
1 × $20.00 -
×
 Wifxa - INSTITUTIONAL SCALPING
1 × $23.00
Wifxa - INSTITUTIONAL SCALPING
1 × $23.00 -
×
 Trading Masterclass 2.0 with Irek Piekarski
1 × $5.00
Trading Masterclass 2.0 with Irek Piekarski
1 × $5.00 -
×
 XLT– Option Trading Course
1 × $6.00
XLT– Option Trading Course
1 × $6.00 -
×
 W. D Gann 's Square Of 9 Applied To Modern Markets with Sean Avidar - Hexatrade350
1 × $23.00
W. D Gann 's Square Of 9 Applied To Modern Markets with Sean Avidar - Hexatrade350
1 × $23.00 -
×
 Tradezilla 2.0
1 × $5.00
Tradezilla 2.0
1 × $5.00 -
×
 Best of the Best: Collars with Amy Meissner & Scott Ruble
1 × $15.00
Best of the Best: Collars with Amy Meissner & Scott Ruble
1 × $15.00 -
×
 War Room Technicals Vol. 3 with Trick Trades
1 × $6.00
War Room Technicals Vol. 3 with Trick Trades
1 × $6.00 -
×
 High Probability Trading Using Elliott Wave And Fibonacci Analysis withVic Patel - Forex Training Group
1 × $10.00
High Probability Trading Using Elliott Wave And Fibonacci Analysis withVic Patel - Forex Training Group
1 × $10.00 -
×
 ZR Trading Complete Program (Arabic + French)
1 × $10.00
ZR Trading Complete Program (Arabic + French)
1 × $10.00 -
×
 Bond Market Course with The Macro Compass
1 × $15.00
Bond Market Course with The Macro Compass
1 × $15.00 -
×
 Understanding How To Trade Fractals
1 × $15.00
Understanding How To Trade Fractals
1 × $15.00 -
×
 Trading Short TermSame Day Trades Sep 2023 with Dan Sheridan & Mark Fenton - Sheridan Options Mentoring
1 × $31.00
Trading Short TermSame Day Trades Sep 2023 with Dan Sheridan & Mark Fenton - Sheridan Options Mentoring
1 × $31.00 -
×
 The Trading Blueprint with Brad Goh - The Trading Geek
1 × $5.00
The Trading Blueprint with Brad Goh - The Trading Geek
1 × $5.00 -
×
 The Orderflows Trade Opportunities Encyclopedia with Michael Valtos
1 × $8.00
The Orderflows Trade Opportunities Encyclopedia with Michael Valtos
1 × $8.00 -
×
 Forecast 2024 Clarification with Larry Williams
1 × $15.00
Forecast 2024 Clarification with Larry Williams
1 × $15.00 -
×
 0 DTE Options Trading Workshop with Aeromir Corporation
1 × $15.00
0 DTE Options Trading Workshop with Aeromir Corporation
1 × $15.00 -
×
 We Fund Traders - The Whale Order
1 × $5.00
We Fund Traders - The Whale Order
1 × $5.00 -
×
 Bennett McDowell – A Trader’s Money Management System
1 × $6.00
Bennett McDowell – A Trader’s Money Management System
1 × $6.00 -
×
 WondaFX Signature Strategy with WondaFX
1 × $5.00
WondaFX Signature Strategy with WondaFX
1 × $5.00 -
×
 Trading Psychology - How to Think Like a Professional Trader - 4 DVD
1 × $6.00
Trading Psychology - How to Think Like a Professional Trader - 4 DVD
1 × $6.00 -
×
 CREDIT SPREAD SURGERY - Bear Call and Bull Put Mastery with Hari Swaminathan
1 × $6.00
CREDIT SPREAD SURGERY - Bear Call and Bull Put Mastery with Hari Swaminathan
1 × $6.00 -
×
 Backspreads, Diagonals and Butterflies – Advanced Options Strategies
1 × $6.00
Backspreads, Diagonals and Butterflies – Advanced Options Strategies
1 × $6.00 -
×
 Essentials in Quantitative Trading QT01 By HangukQuant's
1 × $23.00
Essentials in Quantitative Trading QT01 By HangukQuant's
1 × $23.00 -
×
 We Trade Waves
1 × $5.00
We Trade Waves
1 × $5.00 -
×
 Certification in Point & Figure Chart & P&F Chart Patterns
1 × $6.00
Certification in Point & Figure Chart & P&F Chart Patterns
1 × $6.00 -
×
 Advanced Seminar
1 × $31.00
Advanced Seminar
1 × $31.00 -
×
 White Phoenix’s The Smart (Money) Approach to Trading with Jayson Casper
1 × $39.00
White Phoenix’s The Smart (Money) Approach to Trading with Jayson Casper
1 × $39.00 -
×
 Blending Quantitative & Traditional Equity Analysis with CFA Institute
1 × $6.00
Blending Quantitative & Traditional Equity Analysis with CFA Institute
1 × $6.00 -
×
 The Best Option Trading Course with David Jaffee - Best Stock Strategy
1 × $15.00
The Best Option Trading Course with David Jaffee - Best Stock Strategy
1 × $15.00 -
×
 Weekly Credit Spreads for Income
1 × $6.00
Weekly Credit Spreads for Income
1 × $6.00 -
×
 BalanceTrader II – For Advanced Traders
1 × $6.00
BalanceTrader II – For Advanced Traders
1 × $6.00 -
×
 Uncover Resilient Stocks in Today’s Market with Peter Worden
1 × $6.00
Uncover Resilient Stocks in Today’s Market with Peter Worden
1 × $6.00 -
×
 ZipTraderU 2022 - Your Map To The Stock Market with ZipTrader
1 × $69.00
ZipTraderU 2022 - Your Map To The Stock Market with ZipTrader
1 × $69.00 -
×
 Value Investing Bootcamp with Nick Kraakman
1 × $15.00
Value Investing Bootcamp with Nick Kraakman
1 × $15.00 -
×
 Carter FX 2.0 with CFX University
1 × $5.00
Carter FX 2.0 with CFX University
1 × $5.00 -
×
 WEBINAR series 5 – EXECUTION: A DETAILED PROCESS with FuturesTrader71
1 × $4.00
WEBINAR series 5 – EXECUTION: A DETAILED PROCESS with FuturesTrader71
1 × $4.00 -
×
 Academy - Pick Stocks Like A Pro
1 × $15.00
Academy - Pick Stocks Like A Pro
1 × $15.00 -
×
 A Convicted Stock Manipulators Guide to Investing with Marino Specogna
1 × $6.00
A Convicted Stock Manipulators Guide to Investing with Marino Specogna
1 × $6.00 -
×
 Comfort Zone Investing: How to Tailor Your Portfolio for High Returns and Peace of Mind with Gillette Edmunds
1 × $6.00
Comfort Zone Investing: How to Tailor Your Portfolio for High Returns and Peace of Mind with Gillette Edmunds
1 × $6.00 -
×
 ValueCharts Ultimate Bundle with Base Camp Trading
1 × $54.00
ValueCharts Ultimate Bundle with Base Camp Trading
1 × $54.00 -
×
 The Orderflow Masterclass with PrimeTrading
1 × $17.00
The Orderflow Masterclass with PrimeTrading
1 × $17.00 -
×
 TRADING NFX Course with Andrew NFX
1 × $5.00
TRADING NFX Course with Andrew NFX
1 × $5.00 -
×
 Astro View Horse Racing Show
1 × $6.00
Astro View Horse Racing Show
1 × $6.00 -
×
 XLT - Forex Trading Course
1 × $6.00
XLT - Forex Trading Course
1 × $6.00 -
×
 Wealth, War & Wisdom with Barton Biggs
1 × $6.00
Wealth, War & Wisdom with Barton Biggs
1 × $6.00 -
×
 What Every Investor Shoud Know About Accounting Fraud with Jeff Madura
1 × $6.00
What Every Investor Shoud Know About Accounting Fraud with Jeff Madura
1 × $6.00 -
×
 Video Package
1 × $6.00
Video Package
1 × $6.00 -
×
 TradeCraft: Your Path to Peak Performance Trading By Adam Grimes
1 × $15.00
TradeCraft: Your Path to Peak Performance Trading By Adam Grimes
1 × $15.00 -
×
 Trading Trend Pullbacks - 3-Step Technical Analysis Method with Richard Deutsch
1 × $6.00
Trading Trend Pullbacks - 3-Step Technical Analysis Method with Richard Deutsch
1 × $6.00 -
×
 The Triad Formula System with Jason Fielder
1 × $6.00
The Triad Formula System with Jason Fielder
1 × $6.00 -
×
 The Prop Trading Code with Brannigan Barrett - Axia Futures
1 × $23.00
The Prop Trading Code with Brannigan Barrett - Axia Futures
1 × $23.00 -
×
 A Litle Keltner, a Litle Wycoff and of lot of Street Smarts with Linda Raschke
1 × $6.00
A Litle Keltner, a Litle Wycoff and of lot of Street Smarts with Linda Raschke
1 × $6.00 -
×
 Unreal Series - Forex Trading Master - Surreal Abilities with Talmadge Harper - Harper Healing
1 × $8.00
Unreal Series - Forex Trading Master - Surreal Abilities with Talmadge Harper - Harper Healing
1 × $8.00 -
×
 Wyckoff Analysis Series. Module 1. Wyckoff Volume Analysis
1 × $6.00
Wyckoff Analysis Series. Module 1. Wyckoff Volume Analysis
1 × $6.00 -
×
 A Day Trading Guide
1 × $54.00
A Day Trading Guide
1 × $54.00 -
×
 Compass Trading System with Right Line Trading
1 × $39.00
Compass Trading System with Right Line Trading
1 × $39.00 -
×
 With All Odds Forex System I & II with Barry Thornton
1 × $6.00
With All Odds Forex System I & II with Barry Thornton
1 × $6.00

TTM Slingshot & Value Charts Indicators
$6.00
File Size: Coming soon!
Delivery Time: 1–12 hours
Media Type: Online Course
TTM Slingshot & Value Charts Indicators
Introduction to TTM Slingshot & Value Charts
In the dynamic world of trading, having the right tools can make all the difference. Two such powerful tools are the TTM Slingshot and Value Charts Indicators. These indicators provide traders with crucial insights, helping them navigate market complexities and make informed decisions.
Understanding TTM Slingshot
What is TTM Slingshot?
The TTM Slingshot is an advanced trading indicator developed by John Carter. It combines multiple moving averages to identify potential breakout points in the market. By analyzing the relationship between these moving averages, the TTM Slingshot helps traders spot opportunities for entering or exiting trades.
Key Features of TTM Slingshot
- Multiple Moving Averages: Uses short-term and long-term moving averages.
- Breakout Identification: Detects potential breakout points.
- Versatility: Applicable across various markets and timeframes.
Benefits of Using TTM Slingshot
Enhanced Market Analysis
The TTM Slingshot provides a detailed analysis of market trends, allowing traders to anticipate significant price movements. This indicator’s ability to pinpoint breakout points is invaluable for making timely trading decisions.
Improved Trading Accuracy
By combining multiple moving averages, the TTM Slingshot offers a comprehensive view of the market. This integration reduces noise and enhances the accuracy of predictions, leading to more successful trades.
Setting Up TTM Slingshot
Choosing the Right Platform
To utilize the TTM Slingshot, you’ll need a trading platform that supports custom indicators. Platforms like Thinkorswim and TradeStation are popular choices among traders.
Installing the Indicator
- Download the Indicator: Obtain the TTM Slingshot file compatible with your trading platform.
- Open Your Platform: Launch the trading platform.
- Add the Indicator: Navigate to the ‘Indicators’ section and add the TTM Slingshot file.
- Customize Settings: Adjust the settings to align with your trading strategy.
Understanding Value Charts Indicators
What are Value Charts Indicators?
Value Charts Indicators are tools that measure the relative value of a security based on its price history. These indicators help traders determine whether a security is overvalued, undervalued, or fairly valued, providing a clear picture of potential trading opportunities.
Key Features of Value Charts Indicators
- Relative Value Measurement: Assesses the value of a security.
- Overbought/Oversold Conditions: Identifies extreme market conditions.
- Visual Representation: Displays value levels on a chart for easy interpretation.
Benefits of Using Value Charts Indicators
Identifying Market Extremes
Value Charts Indicators are excellent for spotting overbought and oversold conditions. By identifying these extremes, traders can make strategic decisions about entering or exiting positions.
Enhancing Risk Management
These indicators aid in risk management by providing insights into the relative value of a security. Traders can use this information to set stop-loss levels and protect their investments.
Setting Up Value Charts Indicators
Selecting the Appropriate Platform
Choose a trading platform that supports Value Charts Indicators. Many modern trading platforms, such as NinjaTrader and MetaTrader, offer these indicators.
Installing the Indicator
- Download the Indicator: Obtain the Value Charts Indicator file for your platform.
- Open Your Platform: Start the trading platform.
- Add the Indicator: Go to the ‘Indicators’ section and add the Value Charts file.
- Configure Settings: Customize the settings to fit your trading approach.
How to Use TTM Slingshot & Value Charts Together
Combining Indicators for Better Insights
Using TTM Slingshot and Value Charts Indicators together can enhance your market analysis. While TTM Slingshot identifies breakout points, Value Charts Indicators help assess the relative value of the security, providing a more comprehensive view.
Practical Application
- Entry Points: Use TTM Slingshot to identify breakout points and confirm with Value Charts Indicators to ensure the security is not overvalued.
- Exit Points: Value Charts Indicators can signal overbought conditions, indicating a good time to exit, while TTM Slingshot confirms the end of a trend.
Advanced Strategies with TTM Slingshot & Value Charts
Pairing with Other Indicators
For even more robust analysis, pair TTM Slingshot and Value Charts Indicators with other tools such as RSI (Relative Strength Index) and MACD (Moving Average Convergence Divergence).
Developing a Trading Plan
Create a detailed trading plan that incorporates these indicators. Define your entry and exit points, risk management strategies, and the specific market conditions you’re targeting.
Real-Life Examples
Successful Trade Case Study
Consider a scenario where the TTM Slingshot indicates a breakout, and Value Charts Indicators show the security is undervalued. Entering a trade at this point could lead to significant profits as the price moves to its fair value.
Learning from Mistakes
Analyze trades where the indicators did not predict the expected outcome. Understanding these failures can help refine your strategy and improve future performance.
Conclusion
Maximizing Your Trading Success
The TTM Slingshot and Value Charts Indicators are powerful tools that, when used together, can significantly enhance your trading strategy. By providing insights into market trends and relative value, these indicators help you make more informed decisions.
Taking the Next Step
Start by setting up these indicators on your trading platform. Practice interpreting the signals and integrating them into your trading strategy to see the benefits firsthand.

FAQs
What is the TTM Slingshot indicator?
The TTM Slingshot is a trading tool that uses multiple moving averages to identify breakout points in the market.
How do Value Charts Indicators work?
Value Charts Indicators measure the relative value of a security, helping traders identify overbought and oversold conditions.
Can these indicators be used together?
Yes, combining TTM Slingshot and Value Charts Indicators provides a comprehensive analysis of market trends and security value.
Which platforms support these indicators?
Platforms like Thinkorswim, TradeStation, NinjaTrader, and MetaTrader support TTM Slingshot and Value Charts Indicators.
How do I install these indicators?
Download the respective indicator files, open your trading platform, and add the indicators through the ‘Indicators’ section.
Be the first to review “TTM Slingshot & Value Charts Indicators”
You must be logged in to post a review.
Related products
Original price was: $997.00.$13.00Current price is: $13.00.
Forex Trading
Original price was: $799.00.$15.00Current price is: $15.00.
Forex Trading
Original price was: $1,898.00.$10.00Current price is: $10.00.
Original price was: $450.00.$23.00Current price is: $23.00.

Original price was: $895.00.$15.00Current price is: $15.00.
Forex Trading
Original price was: $397.00.$31.00Current price is: $31.00.
Original price was: $497.00.$11.00Current price is: $11.00.

Forex Trading
Original price was: $2,000.00.$23.00Current price is: $23.00.
Forex Trading
Original price was: $499.00.$15.00Current price is: $15.00.
Original price was: $1,849.00.$15.00Current price is: $15.00.
Original price was: $649.00.$20.00Current price is: $20.00.

Original price was: $310.00.$23.00Current price is: $23.00.
Forex Trading
Original price was: $797.00.$10.00Current price is: $10.00.
Forex Trading
Original price was: $249.00.$15.00Current price is: $15.00.
Forex Trading
The Complete Guide to Multiple Time Frame Analysis & Reading Price Action with Aiman Almansoori
Original price was: $1,399.00.$13.00Current price is: $13.00.
Forex Trading
Original price was: $2,997.00.$23.00Current price is: $23.00.
Forex Trading
Original price was: $999.00.$15.00Current price is: $15.00.
Original price was: $139.00.$23.00Current price is: $23.00.
Forex Trading
Original price was: $4,997.00.$27.00Current price is: $27.00.

Original price was: $197.00.$5.00Current price is: $5.00.

Reviews
There are no reviews yet.