-
×
 Trading with Wave59 with Earik Beann
1 × $6.00
Trading with Wave59 with Earik Beann
1 × $6.00 -
×
 XJO Quant - High Probability Trading Setups on ASX 200 Index
1 × $31.00
XJO Quant - High Probability Trading Setups on ASX 200 Index
1 × $31.00 -
×
 How to Trade a Vertical Market
1 × $93.00
How to Trade a Vertical Market
1 × $93.00 -
×
 Pivot Day Trader for NinjaTrader
1 × $31.00
Pivot Day Trader for NinjaTrader
1 × $31.00 -
×
 MT4 High Probability Forex Trading Method
1 × $6.00
MT4 High Probability Forex Trading Method
1 × $6.00 -
×
 Trading Mindset, and Three Steps To Profitable Trading with Bruce Banks
1 × $6.00
Trading Mindset, and Three Steps To Profitable Trading with Bruce Banks
1 × $6.00 -
×
 Gann’s Secret with Jeanne Long
1 × $4.00
Gann’s Secret with Jeanne Long
1 × $4.00 -
×
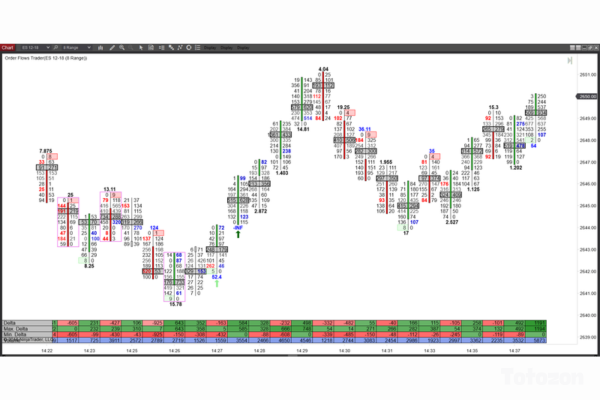 Orderflows - The Imbalance Course
1 × $8.00
Orderflows - The Imbalance Course
1 × $8.00 -
×
 Optionpit - Mastering Iron Condors and Butterflies
1 × $15.00
Optionpit - Mastering Iron Condors and Butterflies
1 × $15.00 -
×
 Futures Spread Trading Intro Course with Thetradingframework
1 × $6.00
Futures Spread Trading Intro Course with Thetradingframework
1 × $6.00 -
×
 Forex Master Levels with Nicola Delic
1 × $15.00
Forex Master Levels with Nicola Delic
1 × $15.00 -
×
 CFA Level 1 - Schweser Study Notes 2006 (schweser.com)
1 × $6.00
CFA Level 1 - Schweser Study Notes 2006 (schweser.com)
1 × $6.00 -
×
 The Use The Moon Trading 2020 Group Webinars Series with Market Occultations
1 × $62.00
The Use The Moon Trading 2020 Group Webinars Series with Market Occultations
1 × $62.00 -
×
 The Naked Eye: Raw Data Analytics with Edgar Torres - Raw Data Analytics
1 × $8.00
The Naked Eye: Raw Data Analytics with Edgar Torres - Raw Data Analytics
1 × $8.00 -
×
 Pristine - Noble DraKoln – The Complete Liverpool Futures Seminar Series
1 × $6.00
Pristine - Noble DraKoln – The Complete Liverpool Futures Seminar Series
1 × $6.00 -
×
 4×4 Course with Gregoire Dupont
1 × $6.00
4×4 Course with Gregoire Dupont
1 × $6.00 -
×
 PFA SD Model Trading System (Apr 2013)
1 × $31.00
PFA SD Model Trading System (Apr 2013)
1 × $31.00 -
×
 Pyrapoint with D.E.Hall
1 × $6.00
Pyrapoint with D.E.Hall
1 × $6.00 -
×
 Trade Hot IPOs-The Promise Of The Future (IPO Course) with Dave Landry
1 × $78.00
Trade Hot IPOs-The Promise Of The Future (IPO Course) with Dave Landry
1 × $78.00 -
×
 High Probability Trading Using Elliott Wave And Fibonacci Analysis withVic Patel - Forex Training Group
1 × $10.00
High Probability Trading Using Elliott Wave And Fibonacci Analysis withVic Patel - Forex Training Group
1 × $10.00 -
×
 NetPicks - Universal Market Trader Course
1 × $6.00
NetPicks - Universal Market Trader Course
1 × $6.00 -
×
 Marder Videos Reports 2019 with Kevin Marder
1 × $34.00
Marder Videos Reports 2019 with Kevin Marder
1 × $34.00 -
×
 Road to consistent profits (Dec 2022) with Jarrod Goodwin - Trading Halls of Knowledge
1 × $31.00
Road to consistent profits (Dec 2022) with Jarrod Goodwin - Trading Halls of Knowledge
1 × $31.00 -
×
 The Best Option Trading Course with David Jaffee - Best Stock Strategy
1 × $15.00
The Best Option Trading Course with David Jaffee - Best Stock Strategy
1 × $15.00 -
×
 Peter Borish Online Trader Program
1 × $15.00
Peter Borish Online Trader Program
1 × $15.00 -
×
 Price Action Trading Volume 2 with Fractal Flow Pro
1 × $6.00
Price Action Trading Volume 2 with Fractal Flow Pro
1 × $6.00 -
×
 NJAT Trading Course with Not Just A Trade
1 × $6.00
NJAT Trading Course with Not Just A Trade
1 × $6.00 -
×
 Trader University with Matthew Kratter
1 × $6.00
Trader University with Matthew Kratter
1 × $6.00 -
×
 The TrendAdvisor Guide to Breakthrough Profits with Chuck Dukas
1 × $6.00
The TrendAdvisor Guide to Breakthrough Profits with Chuck Dukas
1 × $6.00 -
×
 Trend Trading My Way with Markay Latimer
1 × $15.00
Trend Trading My Way with Markay Latimer
1 × $15.00 -
×
 Crystal Ball Pack PLUS bonus Live Trade By Pat Mitchell - Trick Trades
1 × $20.00
Crystal Ball Pack PLUS bonus Live Trade By Pat Mitchell - Trick Trades
1 × $20.00 -
×
 My Trading Strategy with Evolved Traders
1 × $5.00
My Trading Strategy with Evolved Traders
1 × $5.00 -
×
 Come Into My Trading Room: A Complete Guide to Trading with Alexander Elder
1 × $6.00
Come Into My Trading Room: A Complete Guide to Trading with Alexander Elder
1 × $6.00 -
×
 Trading With an Edge with Bruce Gilmore
1 × $6.00
Trading With an Edge with Bruce Gilmore
1 × $6.00 -
×
 Video On Demand Pathway with Trade With Profile
1 × $5.00
Video On Demand Pathway with Trade With Profile
1 × $5.00 -
×
 Automatic Millionaire (Audio Book) with David Bach
1 × $6.00
Automatic Millionaire (Audio Book) with David Bach
1 × $6.00 -
×
 Guide to Scanning for Potential Stock Trades class with Jeff Bierman
1 × $6.00
Guide to Scanning for Potential Stock Trades class with Jeff Bierman
1 × $6.00 -
×
 Newsbeat Bandits Program July 2019
1 × $23.00
Newsbeat Bandits Program July 2019
1 × $23.00 -
×
 Speculating with Futures and Traditional Commodities Part II (Liverpool Group) - Noble DraKoln
1 × $6.00
Speculating with Futures and Traditional Commodities Part II (Liverpool Group) - Noble DraKoln
1 × $6.00 -
×
 The Trading Blueprint with Brad Goh - The Trading Geek
1 × $5.00
The Trading Blueprint with Brad Goh - The Trading Geek
1 × $5.00 -
×
 Candlestick Trading Forum Trading Seminar with Stephen W.Bigalow
1 × $4.00
Candlestick Trading Forum Trading Seminar with Stephen W.Bigalow
1 × $4.00 -
×
 Paradox Forex Course
1 × $5.00
Paradox Forex Course
1 × $5.00 -
×
 Mastering Metatrader 4 in 90 Minutes & Members Site with Alan Benefield
1 × $15.00
Mastering Metatrader 4 in 90 Minutes & Members Site with Alan Benefield
1 × $15.00 -
×
 Mind of a Trader with Alpesh Patel
1 × $6.00
Mind of a Trader with Alpesh Patel
1 × $6.00 -
×
 Winning on Wall Street (Updated & Revised Ed.) with Martin Zweig
1 × $6.00
Winning on Wall Street (Updated & Revised Ed.) with Martin Zweig
1 × $6.00 -
×
 Introduction To The STRAT Course with Rob Smith
1 × $8.00
Introduction To The STRAT Course with Rob Smith
1 × $8.00 -
×
 Wealth Management with Dimitris Chorafas
1 × $6.00
Wealth Management with Dimitris Chorafas
1 × $6.00 -
×
 SPX All Put Flat ButterFly with Mark Fenton - Sheridan Options Mentoring
1 × $39.00
SPX All Put Flat ButterFly with Mark Fenton - Sheridan Options Mentoring
1 × $39.00 -
×
 Market Timing & Technical Analysis with Alan Shaw
1 × $6.00
Market Timing & Technical Analysis with Alan Shaw
1 × $6.00 -
×
 Bond Market Course with The Macro Compass
1 × $15.00
Bond Market Course with The Macro Compass
1 × $15.00 -
×
 The Management of Equity Investments with Dimitris Chorafas
1 × $6.00
The Management of Equity Investments with Dimitris Chorafas
1 × $6.00 -
×
 Chart Your Way to Profits (2nd Ed.) with Tim Knight
1 × $6.00
Chart Your Way to Profits (2nd Ed.) with Tim Knight
1 × $6.00 -
×
 Professional Training Program with OpenTrader
1 × $6.00
Professional Training Program with OpenTrader
1 × $6.00 -
×
 SQX Mentorship with Tip Toe Hippo
1 × $23.00
SQX Mentorship with Tip Toe Hippo
1 × $23.00 -
×
 Long-Term Memory in the Stock Market Prices (Article) with Andrew W.Lo
1 × $6.00
Long-Term Memory in the Stock Market Prices (Article) with Andrew W.Lo
1 × $6.00 -
×
 PDFT (Price Driven Forex Trading) Course with Avi Frister
1 × $6.00
PDFT (Price Driven Forex Trading) Course with Avi Frister
1 × $6.00 -
×
 Advanced Iron Condor Course in 2021
1 × $6.00
Advanced Iron Condor Course in 2021
1 × $6.00 -
×
 How to Manage Profit and Cash Flow: Mining the Numbers for Gold with John Tracy & Tage Tracy
1 × $6.00
How to Manage Profit and Cash Flow: Mining the Numbers for Gold with John Tracy & Tage Tracy
1 × $6.00 -
×
 The Key to Profits in Tough Times
1 × $6.00
The Key to Profits in Tough Times
1 × $6.00 -
×
 The Handbook of Equity Style Management (3rd Ed) with Daniel Coggin & Frank Fabozzi
1 × $6.00
The Handbook of Equity Style Management (3rd Ed) with Daniel Coggin & Frank Fabozzi
1 × $6.00 -
×
 Nasdaq Scalper Complete Video Course with Vadym Graifer - RealityTrader
1 × $23.00
Nasdaq Scalper Complete Video Course with Vadym Graifer - RealityTrader
1 × $23.00 -
×
 Stealth Trader (Ebook) with Andy Jordan - Trading Educators
1 × $132.00
Stealth Trader (Ebook) with Andy Jordan - Trading Educators
1 × $132.00 -
×
 WondaFX Signature Strategy with WondaFX
1 × $5.00
WondaFX Signature Strategy with WondaFX
1 × $5.00 -
×
 Full Credit Spreads with Ryan Litchfield
1 × $6.00
Full Credit Spreads with Ryan Litchfield
1 × $6.00 -
×
 Hiden Collective Factors in Speculative Trading with Bertrand Roehner
1 × $6.00
Hiden Collective Factors in Speculative Trading with Bertrand Roehner
1 × $6.00 -
×
 Fibonacci Trading: How to Master the Time and Price Advantage with Carolyn Boroden
1 × $6.00
Fibonacci Trading: How to Master the Time and Price Advantage with Carolyn Boroden
1 × $6.00 -
×
 Trading Hub 3.0 (Ebook)
1 × $6.00
Trading Hub 3.0 (Ebook)
1 × $6.00 -
×
 Power Charting - Robert’s Indicator Webinar
1 × $6.00
Power Charting - Robert’s Indicator Webinar
1 × $6.00 -
×
 Zanzibar System for the EuroFx with Joe Ross
1 × $4.00
Zanzibar System for the EuroFx with Joe Ross
1 × $4.00 -
×
 TradeCraft: Your Path to Peak Performance Trading By Adam Grimes
1 × $15.00
TradeCraft: Your Path to Peak Performance Trading By Adam Grimes
1 × $15.00 -
×
 Essentials in Quantitative Trading QT01 By HangukQuant's
1 × $23.00
Essentials in Quantitative Trading QT01 By HangukQuant's
1 × $23.00

TTM Slingshot & Value Charts Indicators
$6.00
File Size: Coming soon!
Delivery Time: 1–12 hours
Media Type: Online Course
TTM Slingshot & Value Charts Indicators
Introduction to TTM Slingshot & Value Charts
In the dynamic world of trading, having the right tools can make all the difference. Two such powerful tools are the TTM Slingshot and Value Charts Indicators. These indicators provide traders with crucial insights, helping them navigate market complexities and make informed decisions.
Understanding TTM Slingshot
What is TTM Slingshot?
The TTM Slingshot is an advanced trading indicator developed by John Carter. It combines multiple moving averages to identify potential breakout points in the market. By analyzing the relationship between these moving averages, the TTM Slingshot helps traders spot opportunities for entering or exiting trades.
Key Features of TTM Slingshot
- Multiple Moving Averages: Uses short-term and long-term moving averages.
- Breakout Identification: Detects potential breakout points.
- Versatility: Applicable across various markets and timeframes.
Benefits of Using TTM Slingshot
Enhanced Market Analysis
The TTM Slingshot provides a detailed analysis of market trends, allowing traders to anticipate significant price movements. This indicator’s ability to pinpoint breakout points is invaluable for making timely trading decisions.
Improved Trading Accuracy
By combining multiple moving averages, the TTM Slingshot offers a comprehensive view of the market. This integration reduces noise and enhances the accuracy of predictions, leading to more successful trades.
Setting Up TTM Slingshot
Choosing the Right Platform
To utilize the TTM Slingshot, you’ll need a trading platform that supports custom indicators. Platforms like Thinkorswim and TradeStation are popular choices among traders.
Installing the Indicator
- Download the Indicator: Obtain the TTM Slingshot file compatible with your trading platform.
- Open Your Platform: Launch the trading platform.
- Add the Indicator: Navigate to the ‘Indicators’ section and add the TTM Slingshot file.
- Customize Settings: Adjust the settings to align with your trading strategy.
Understanding Value Charts Indicators
What are Value Charts Indicators?
Value Charts Indicators are tools that measure the relative value of a security based on its price history. These indicators help traders determine whether a security is overvalued, undervalued, or fairly valued, providing a clear picture of potential trading opportunities.
Key Features of Value Charts Indicators
- Relative Value Measurement: Assesses the value of a security.
- Overbought/Oversold Conditions: Identifies extreme market conditions.
- Visual Representation: Displays value levels on a chart for easy interpretation.
Benefits of Using Value Charts Indicators
Identifying Market Extremes
Value Charts Indicators are excellent for spotting overbought and oversold conditions. By identifying these extremes, traders can make strategic decisions about entering or exiting positions.
Enhancing Risk Management
These indicators aid in risk management by providing insights into the relative value of a security. Traders can use this information to set stop-loss levels and protect their investments.
Setting Up Value Charts Indicators
Selecting the Appropriate Platform
Choose a trading platform that supports Value Charts Indicators. Many modern trading platforms, such as NinjaTrader and MetaTrader, offer these indicators.
Installing the Indicator
- Download the Indicator: Obtain the Value Charts Indicator file for your platform.
- Open Your Platform: Start the trading platform.
- Add the Indicator: Go to the ‘Indicators’ section and add the Value Charts file.
- Configure Settings: Customize the settings to fit your trading approach.
How to Use TTM Slingshot & Value Charts Together
Combining Indicators for Better Insights
Using TTM Slingshot and Value Charts Indicators together can enhance your market analysis. While TTM Slingshot identifies breakout points, Value Charts Indicators help assess the relative value of the security, providing a more comprehensive view.
Practical Application
- Entry Points: Use TTM Slingshot to identify breakout points and confirm with Value Charts Indicators to ensure the security is not overvalued.
- Exit Points: Value Charts Indicators can signal overbought conditions, indicating a good time to exit, while TTM Slingshot confirms the end of a trend.
Advanced Strategies with TTM Slingshot & Value Charts
Pairing with Other Indicators
For even more robust analysis, pair TTM Slingshot and Value Charts Indicators with other tools such as RSI (Relative Strength Index) and MACD (Moving Average Convergence Divergence).
Developing a Trading Plan
Create a detailed trading plan that incorporates these indicators. Define your entry and exit points, risk management strategies, and the specific market conditions you’re targeting.
Real-Life Examples
Successful Trade Case Study
Consider a scenario where the TTM Slingshot indicates a breakout, and Value Charts Indicators show the security is undervalued. Entering a trade at this point could lead to significant profits as the price moves to its fair value.
Learning from Mistakes
Analyze trades where the indicators did not predict the expected outcome. Understanding these failures can help refine your strategy and improve future performance.
Conclusion
Maximizing Your Trading Success
The TTM Slingshot and Value Charts Indicators are powerful tools that, when used together, can significantly enhance your trading strategy. By providing insights into market trends and relative value, these indicators help you make more informed decisions.
Taking the Next Step
Start by setting up these indicators on your trading platform. Practice interpreting the signals and integrating them into your trading strategy to see the benefits firsthand.

FAQs
What is the TTM Slingshot indicator?
The TTM Slingshot is a trading tool that uses multiple moving averages to identify breakout points in the market.
How do Value Charts Indicators work?
Value Charts Indicators measure the relative value of a security, helping traders identify overbought and oversold conditions.
Can these indicators be used together?
Yes, combining TTM Slingshot and Value Charts Indicators provides a comprehensive analysis of market trends and security value.
Which platforms support these indicators?
Platforms like Thinkorswim, TradeStation, NinjaTrader, and MetaTrader support TTM Slingshot and Value Charts Indicators.
How do I install these indicators?
Download the respective indicator files, open your trading platform, and add the indicators through the ‘Indicators’ section.
Be the first to review “TTM Slingshot & Value Charts Indicators”
You must be logged in to post a review.
Related products
Forex Trading
Original price was: $499.00.$15.00Current price is: $15.00.

Forex Trading
Original price was: $999.00.$15.00Current price is: $15.00.
Forex Trading
Original price was: $850.00.$23.00Current price is: $23.00.

Original price was: $999.00.$5.00Current price is: $5.00.

Original price was: $695.00.$41.00Current price is: $41.00.
Forex Trading
Original price was: $1,898.00.$10.00Current price is: $10.00.

Original price was: $450.00.$23.00Current price is: $23.00.

Original price was: $700.00.$39.00Current price is: $39.00.

Original price was: $139.00.$23.00Current price is: $23.00.

Original price was: $997.00.$13.00Current price is: $13.00.

Forex Trading
Original price was: $4,997.00.$27.00Current price is: $27.00.
Original price was: $4,995.00.$15.00Current price is: $15.00.

Original price was: $497.00.$31.00Current price is: $31.00.
Original price was: $1,849.00.$15.00Current price is: $15.00.

Forex Trading
Original price was: $500.00.$5.00Current price is: $5.00.

Forex Trading
Original price was: $1,098.00.$39.00Current price is: $39.00.
Original price was: $997.00.$8.00Current price is: $8.00.

Original price was: $1,800.00.$54.00Current price is: $54.00.

Forex Trading
Original price was: $2,995.00.$31.00Current price is: $31.00.

Forex Trading
Original price was: $249.00.$15.00Current price is: $15.00.

Reviews
There are no reviews yet.