-
×
 0 DTE Options Trading Workshop with Aeromir Corporation
1 × $15.00
0 DTE Options Trading Workshop with Aeromir Corporation
1 × $15.00 -
×
 The Pattern Trader with Mark Shawzin
1 × $6.00
The Pattern Trader with Mark Shawzin
1 × $6.00 -
×
 Safety in the Markets 9-DVD Series with David Bowden
1 × $6.00
Safety in the Markets 9-DVD Series with David Bowden
1 × $6.00 -
×
 High Probability Trading Using Elliott Wave And Fibonacci Analysis withVic Patel - Forex Training Group
1 × $10.00
High Probability Trading Using Elliott Wave And Fibonacci Analysis withVic Patel - Forex Training Group
1 × $10.00 -
×
 Deep Dive Butterfly Trading Strategy Class with SJG Trades
1 × $41.00
Deep Dive Butterfly Trading Strategy Class with SJG Trades
1 × $41.00 -
×
 How To Read The Market Professionally with TradeSmart
1 × $27.00
How To Read The Market Professionally with TradeSmart
1 × $27.00 -
×
 The Trading Blueprint with Brad Goh - The Trading Geek
1 × $5.00
The Trading Blueprint with Brad Goh - The Trading Geek
1 × $5.00 -
×
 Home Run Options Trading Course with Dave Aquino - Base Camp Trading
1 × $11.00
Home Run Options Trading Course with Dave Aquino - Base Camp Trading
1 × $11.00 -
×
 The Best Option Trading Course with David Jaffee - Best Stock Strategy
1 × $15.00
The Best Option Trading Course with David Jaffee - Best Stock Strategy
1 × $15.00 -
×
 SQX Mentorship with Tip Toe Hippo
1 × $23.00
SQX Mentorship with Tip Toe Hippo
1 × $23.00 -
×
 Matrix Spread Options Trading Course with Base Camp Trading
1 × $31.00
Matrix Spread Options Trading Course with Base Camp Trading
1 × $31.00 -
×
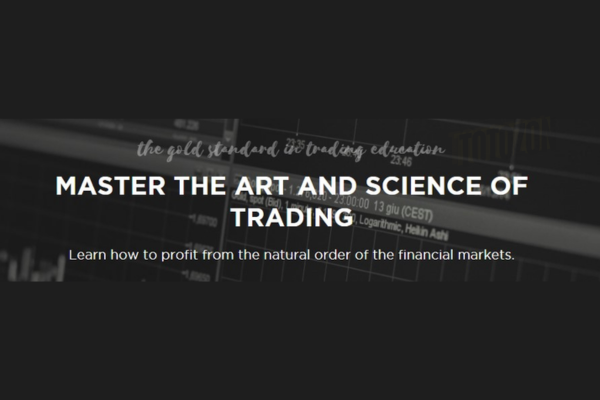 The Gold Standard in Trading Education with Six Figure Capital
1 × $5.00
The Gold Standard in Trading Education with Six Figure Capital
1 × $5.00 -
×
 The Complete Guide to Multiple Time Frame Analysis & Reading Price Action with Aiman Almansoori
1 × $13.00
The Complete Guide to Multiple Time Frame Analysis & Reading Price Action with Aiman Almansoori
1 × $13.00 -
×
 Butterfly and Condor Workshop with Aeromir
1 × $15.00
Butterfly and Condor Workshop with Aeromir
1 × $15.00 -
×
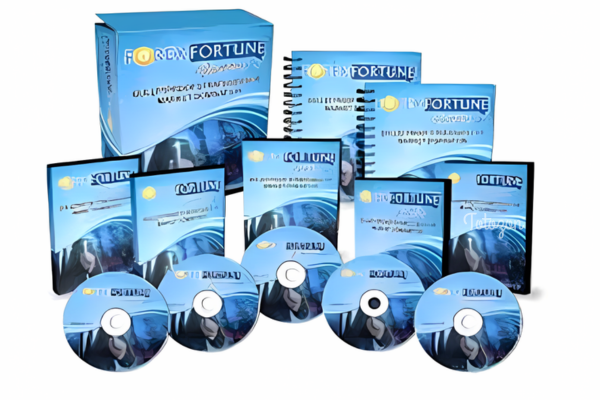 Forex Fortune Factory 2.0 with Nehemiah Douglass & Cottrell Phillip
1 × $6.00
Forex Fortune Factory 2.0 with Nehemiah Douglass & Cottrell Phillip
1 × $6.00 -
×
 Trading Short TermSame Day Trades Sep 2023 with Dan Sheridan & Mark Fenton - Sheridan Options Mentoring
1 × $31.00
Trading Short TermSame Day Trades Sep 2023 with Dan Sheridan & Mark Fenton - Sheridan Options Mentoring
1 × $31.00 -
×
 White Phoenix’s The Smart (Money) Approach to Trading with Jayson Casper
1 × $39.00
White Phoenix’s The Smart (Money) Approach to Trading with Jayson Casper
1 × $39.00 -
×
 If You Are So Smart Why Aren’t You Rich with Ben Branch
1 × $6.00
If You Are So Smart Why Aren’t You Rich with Ben Branch
1 × $6.00 -
×
 Ultimate Trading Course with Dodgy's Dungeon
1 × $8.00
Ultimate Trading Course with Dodgy's Dungeon
1 × $8.00 -
×
 The Indices Orderflow Masterclass with The Forex Scalpers
1 × $23.00
The Indices Orderflow Masterclass with The Forex Scalpers
1 × $23.00 -
×
 Trading With an Edge with Bruce Gilmore
1 × $6.00
Trading With an Edge with Bruce Gilmore
1 × $6.00 -
×
 WondaFX Signature Strategy with WondaFX
1 × $5.00
WondaFX Signature Strategy with WondaFX
1 × $5.00 -
×
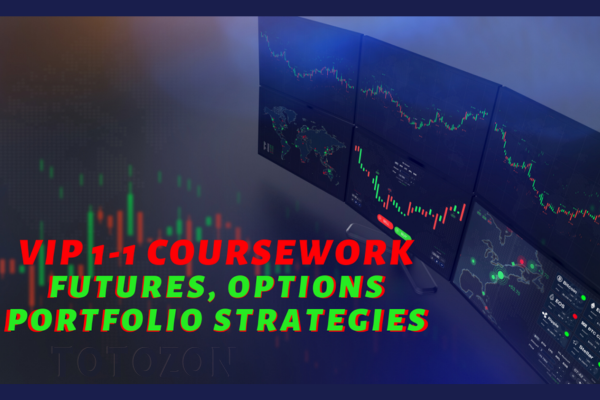 VIP - One on One Coursework with Talkin Options
1 × $15.00
VIP - One on One Coursework with Talkin Options
1 × $15.00 -
×
 Compass Trading System with Right Line Trading
1 × $39.00
Compass Trading System with Right Line Trading
1 × $39.00 -
×
 Theo Trade - 128 Course Bundle
1 × $93.00
Theo Trade - 128 Course Bundle
1 × $93.00 -
×
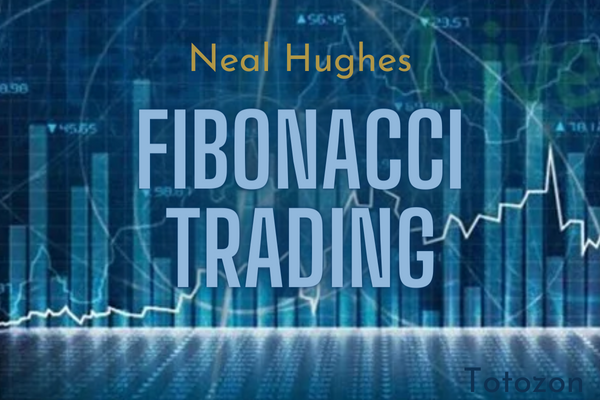 Advanced Fibonacci Trading with Neal Hughes
1 × $6.00
Advanced Fibonacci Trading with Neal Hughes
1 × $6.00 -
×
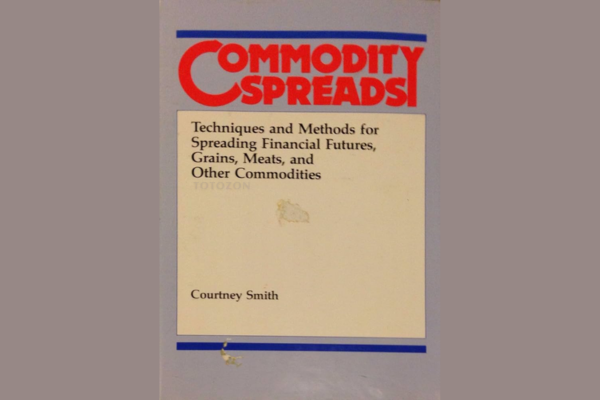 Commodity Spreads: Techniques and Methods for Spreading Financial Futures, Grains, Meats & Other Commodities with Courtney Smith
1 × $6.00
Commodity Spreads: Techniques and Methods for Spreading Financial Futures, Grains, Meats & Other Commodities with Courtney Smith
1 × $6.00 -
×
 ICT Prodigy Trading Course – $650K in Payouts with Alex Solignani
1 × $15.00
ICT Prodigy Trading Course – $650K in Payouts with Alex Solignani
1 × $15.00 -
×
 The Naked Eye: Raw Data Analytics with Edgar Torres - Raw Data Analytics
1 × $8.00
The Naked Eye: Raw Data Analytics with Edgar Torres - Raw Data Analytics
1 × $8.00 -
×
 Video Package
1 × $6.00
Video Package
1 × $6.00 -
×
 Algo Trading Masterclass with Ali Casey - StatOasis
1 × $23.00
Algo Trading Masterclass with Ali Casey - StatOasis
1 × $23.00 -
×
 WealthFRX Trading Mastery 3.0
1 × $5.00
WealthFRX Trading Mastery 3.0
1 × $5.00 -
×
 Scalp Strategy and Flipping Small Accounts with Opes Trading Group
1 × $5.00
Scalp Strategy and Flipping Small Accounts with Opes Trading Group
1 × $5.00 -
×
 5 Week Live Web Seminar (Video & WorkBook ) with Larry Connors
1 × $6.00
5 Week Live Web Seminar (Video & WorkBook ) with Larry Connors
1 × $6.00 -
×
 Quantamentals - The Next Great Forefront Of Trading and Investing with Trading Markets
1 × $8.00
Quantamentals - The Next Great Forefront Of Trading and Investing with Trading Markets
1 × $8.00 -
×
 Options Trading & Ultimate MasterClass With Tyrone Abela - FX Evolution
1 × $54.00
Options Trading & Ultimate MasterClass With Tyrone Abela - FX Evolution
1 × $54.00 -
×
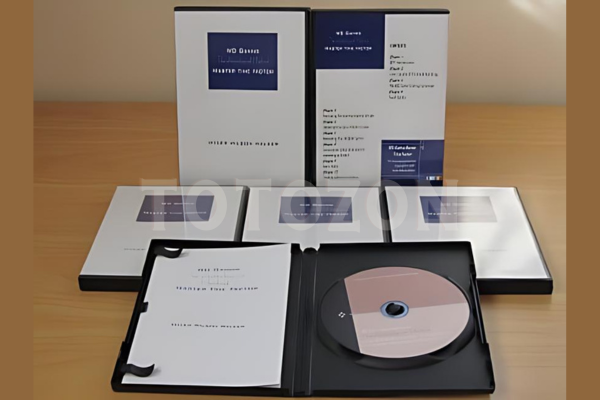 WD Gann’s Master Time Factor DVD With Miles Wilson Walker
1 × $6.00
WD Gann’s Master Time Factor DVD With Miles Wilson Walker
1 × $6.00 -
×
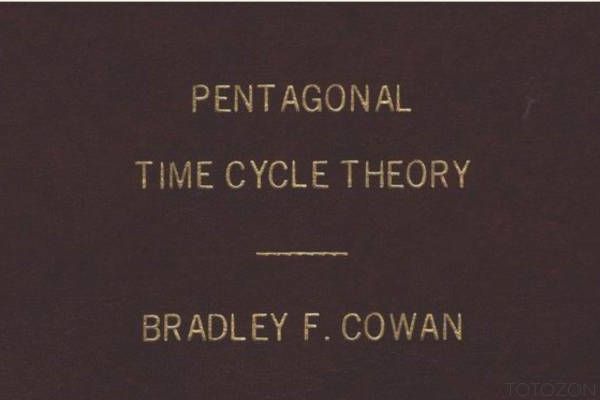 Pentagonal Time Cycle Theory
1 × $6.00
Pentagonal Time Cycle Theory
1 × $6.00 -
×
 A Non-Random Walk Down Wall Street with Andrew W.Lo
1 × $6.00
A Non-Random Walk Down Wall Street with Andrew W.Lo
1 × $6.00 -
×
 W. D Gann 's Square Of 9 Applied To Modern Markets with Sean Avidar - Hexatrade350
1 × $23.00
W. D Gann 's Square Of 9 Applied To Modern Markets with Sean Avidar - Hexatrade350
1 × $23.00 -
×
 The A14 Weekly Option Strategy Workshop with Amy Meissner
1 × $23.00
The A14 Weekly Option Strategy Workshop with Amy Meissner
1 × $23.00 -
×
 Forecast 2024 Clarification with Larry Williams
1 × $15.00
Forecast 2024 Clarification with Larry Williams
1 × $15.00 -
×
 Best of the Best: Collars with Amy Meissner & Scott Ruble
1 × $15.00
Best of the Best: Collars with Amy Meissner & Scott Ruble
1 × $15.00 -
×
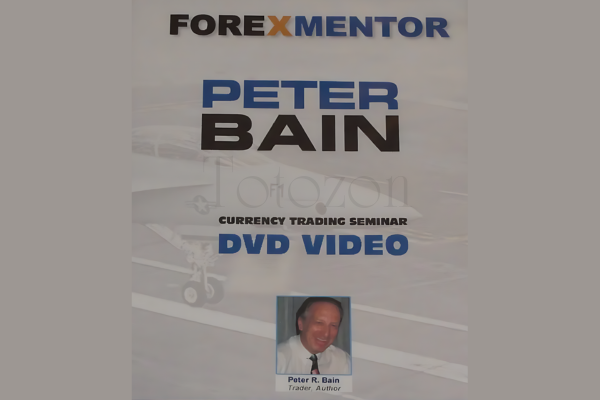 Currency Trading Seminar with Peter Bain
1 × $6.00
Currency Trading Seminar with Peter Bain
1 × $6.00 -
×
 TradeCraft: Your Path to Peak Performance Trading By Adam Grimes
1 × $15.00
TradeCraft: Your Path to Peak Performance Trading By Adam Grimes
1 × $15.00 -
×
 Winning – Zodiacal Timing Revised 1980 with Joyce Wehrman
1 × $6.00
Winning – Zodiacal Timing Revised 1980 with Joyce Wehrman
1 × $6.00 -
×
 XLT - Forex Trading Course
1 × $6.00
XLT - Forex Trading Course
1 × $6.00 -
×
 Active Trading Course Notes with Alan Hull
1 × $6.00
Active Trading Course Notes with Alan Hull
1 × $6.00 -
×
 XJO Quant - High Probability Trading Setups on ASX 200 Index
1 × $31.00
XJO Quant - High Probability Trading Setups on ASX 200 Index
1 × $31.00 -
×
 The Prop Trading Code with Brannigan Barrett - Axia Futures
1 × $23.00
The Prop Trading Code with Brannigan Barrett - Axia Futures
1 × $23.00 -
×
 ATM Forex 2009 System Manual, Videos & Indicators with Keith Cotterill
1 × $6.00
ATM Forex 2009 System Manual, Videos & Indicators with Keith Cotterill
1 × $6.00 -
×
 Advanced Spread Trading with Guy Bower - MasterClass Trader
1 × $15.00
Advanced Spread Trading with Guy Bower - MasterClass Trader
1 × $15.00 -
×
 Trend Following: How Great Traders Make Millions in Up or Down Markets with Michael Covel
1 × $6.00
Trend Following: How Great Traders Make Millions in Up or Down Markets with Michael Covel
1 × $6.00 -
×
 $20 – 52k 20 pips a day challange with Rafał Zuchowicz - TopMasterTrader
1 × $5.00
$20 – 52k 20 pips a day challange with Rafał Zuchowicz - TopMasterTrader
1 × $5.00 -
×
 TRADING NFX Course with Andrew NFX
1 × $5.00
TRADING NFX Course with Andrew NFX
1 × $5.00 -
×
 4 Class Bundle
1 × $31.00
4 Class Bundle
1 × $31.00 -
×
 Wyckoff Analytics Courses Collection
1 × $27.00
Wyckoff Analytics Courses Collection
1 × $27.00 -
×
 Trading For a Living By Thomas Carr (Dr. Stoxx)
1 × $34.00
Trading For a Living By Thomas Carr (Dr. Stoxx)
1 × $34.00 -
×
 Crypto Trading Academy with Cheeky Investor - Aussie Day Trader
1 × $13.00
Crypto Trading Academy with Cheeky Investor - Aussie Day Trader
1 × $13.00 -
×
 Bond Market Course with The Macro Compass
1 × $15.00
Bond Market Course with The Macro Compass
1 × $15.00 -
×
 Astro-Cycles and Speculative Markets with L.J.Jensen
1 × $6.00
Astro-Cycles and Speculative Markets with L.J.Jensen
1 × $6.00 -
×
 Complete Short Black Scholes Options Trading Pricing Course
1 × $6.00
Complete Short Black Scholes Options Trading Pricing Course
1 × $6.00 -
×
 AutoTrader-Fully Automated Trading System with Trading123
1 × $46.00
AutoTrader-Fully Automated Trading System with Trading123
1 × $46.00 -
×
 Day Trading 101 How To Day Trade Stocks for Passive Income
1 × $6.00
Day Trading 101 How To Day Trade Stocks for Passive Income
1 × $6.00 -
×
 Trading With Venus
1 × $31.00
Trading With Venus
1 × $31.00 -
×
 7 Steps to Success Trading Options Online with Larry Spears
1 × $4.00
7 Steps to Success Trading Options Online with Larry Spears
1 × $4.00 -
×
 Becoming a Disciplined Trader: Techniques for Achieving Peak Trading Performance with Ari Kiev
1 × $6.00
Becoming a Disciplined Trader: Techniques for Achieving Peak Trading Performance with Ari Kiev
1 × $6.00 -
×
 Learn how to trade Volatility 75 Index Technical Analysis with Patrick Muke
1 × $6.00
Learn how to trade Volatility 75 Index Technical Analysis with Patrick Muke
1 × $6.00 -
×
 Crystal Ball Pack PLUS bonus Live Trade By Pat Mitchell - Trick Trades
1 × $20.00
Crystal Ball Pack PLUS bonus Live Trade By Pat Mitchell - Trick Trades
1 × $20.00

TTM Slingshot & Value Charts Indicators
$6.00
File Size: Coming soon!
Delivery Time: 1–12 hours
Media Type: Online Course
TTM Slingshot & Value Charts Indicators
Introduction to TTM Slingshot & Value Charts
In the dynamic world of trading, having the right tools can make all the difference. Two such powerful tools are the TTM Slingshot and Value Charts Indicators. These indicators provide traders with crucial insights, helping them navigate market complexities and make informed decisions.
Understanding TTM Slingshot
What is TTM Slingshot?
The TTM Slingshot is an advanced trading indicator developed by John Carter. It combines multiple moving averages to identify potential breakout points in the market. By analyzing the relationship between these moving averages, the TTM Slingshot helps traders spot opportunities for entering or exiting trades.
Key Features of TTM Slingshot
- Multiple Moving Averages: Uses short-term and long-term moving averages.
- Breakout Identification: Detects potential breakout points.
- Versatility: Applicable across various markets and timeframes.
Benefits of Using TTM Slingshot
Enhanced Market Analysis
The TTM Slingshot provides a detailed analysis of market trends, allowing traders to anticipate significant price movements. This indicator’s ability to pinpoint breakout points is invaluable for making timely trading decisions.
Improved Trading Accuracy
By combining multiple moving averages, the TTM Slingshot offers a comprehensive view of the market. This integration reduces noise and enhances the accuracy of predictions, leading to more successful trades.
Setting Up TTM Slingshot
Choosing the Right Platform
To utilize the TTM Slingshot, you’ll need a trading platform that supports custom indicators. Platforms like Thinkorswim and TradeStation are popular choices among traders.
Installing the Indicator
- Download the Indicator: Obtain the TTM Slingshot file compatible with your trading platform.
- Open Your Platform: Launch the trading platform.
- Add the Indicator: Navigate to the ‘Indicators’ section and add the TTM Slingshot file.
- Customize Settings: Adjust the settings to align with your trading strategy.
Understanding Value Charts Indicators
What are Value Charts Indicators?
Value Charts Indicators are tools that measure the relative value of a security based on its price history. These indicators help traders determine whether a security is overvalued, undervalued, or fairly valued, providing a clear picture of potential trading opportunities.
Key Features of Value Charts Indicators
- Relative Value Measurement: Assesses the value of a security.
- Overbought/Oversold Conditions: Identifies extreme market conditions.
- Visual Representation: Displays value levels on a chart for easy interpretation.
Benefits of Using Value Charts Indicators
Identifying Market Extremes
Value Charts Indicators are excellent for spotting overbought and oversold conditions. By identifying these extremes, traders can make strategic decisions about entering or exiting positions.
Enhancing Risk Management
These indicators aid in risk management by providing insights into the relative value of a security. Traders can use this information to set stop-loss levels and protect their investments.
Setting Up Value Charts Indicators
Selecting the Appropriate Platform
Choose a trading platform that supports Value Charts Indicators. Many modern trading platforms, such as NinjaTrader and MetaTrader, offer these indicators.
Installing the Indicator
- Download the Indicator: Obtain the Value Charts Indicator file for your platform.
- Open Your Platform: Start the trading platform.
- Add the Indicator: Go to the ‘Indicators’ section and add the Value Charts file.
- Configure Settings: Customize the settings to fit your trading approach.
How to Use TTM Slingshot & Value Charts Together
Combining Indicators for Better Insights
Using TTM Slingshot and Value Charts Indicators together can enhance your market analysis. While TTM Slingshot identifies breakout points, Value Charts Indicators help assess the relative value of the security, providing a more comprehensive view.
Practical Application
- Entry Points: Use TTM Slingshot to identify breakout points and confirm with Value Charts Indicators to ensure the security is not overvalued.
- Exit Points: Value Charts Indicators can signal overbought conditions, indicating a good time to exit, while TTM Slingshot confirms the end of a trend.
Advanced Strategies with TTM Slingshot & Value Charts
Pairing with Other Indicators
For even more robust analysis, pair TTM Slingshot and Value Charts Indicators with other tools such as RSI (Relative Strength Index) and MACD (Moving Average Convergence Divergence).
Developing a Trading Plan
Create a detailed trading plan that incorporates these indicators. Define your entry and exit points, risk management strategies, and the specific market conditions you’re targeting.
Real-Life Examples
Successful Trade Case Study
Consider a scenario where the TTM Slingshot indicates a breakout, and Value Charts Indicators show the security is undervalued. Entering a trade at this point could lead to significant profits as the price moves to its fair value.
Learning from Mistakes
Analyze trades where the indicators did not predict the expected outcome. Understanding these failures can help refine your strategy and improve future performance.
Conclusion
Maximizing Your Trading Success
The TTM Slingshot and Value Charts Indicators are powerful tools that, when used together, can significantly enhance your trading strategy. By providing insights into market trends and relative value, these indicators help you make more informed decisions.
Taking the Next Step
Start by setting up these indicators on your trading platform. Practice interpreting the signals and integrating them into your trading strategy to see the benefits firsthand.

FAQs
What is the TTM Slingshot indicator?
The TTM Slingshot is a trading tool that uses multiple moving averages to identify breakout points in the market.
How do Value Charts Indicators work?
Value Charts Indicators measure the relative value of a security, helping traders identify overbought and oversold conditions.
Can these indicators be used together?
Yes, combining TTM Slingshot and Value Charts Indicators provides a comprehensive analysis of market trends and security value.
Which platforms support these indicators?
Platforms like Thinkorswim, TradeStation, NinjaTrader, and MetaTrader support TTM Slingshot and Value Charts Indicators.
How do I install these indicators?
Download the respective indicator files, open your trading platform, and add the indicators through the ‘Indicators’ section.
Be the first to review “TTM Slingshot & Value Charts Indicators”
You must be logged in to post a review.
Related products
Forex Trading
Original price was: $4,997.00.$27.00Current price is: $27.00.

Forex Trading
Original price was: $2,995.00.$31.00Current price is: $31.00.

Forex Trading
Original price was: $850.00.$23.00Current price is: $23.00.
Forex Trading
Original price was: $397.00.$31.00Current price is: $31.00.
Original price was: $997.00.$8.00Current price is: $8.00.

Forex Trading
Original price was: $125.00.$17.00Current price is: $17.00.
Forex Trading
Original price was: $999.00.$15.00Current price is: $15.00.
Forex Trading
Original price was: $1,898.00.$10.00Current price is: $10.00.
Original price was: $139.00.$23.00Current price is: $23.00.
Original price was: $1,849.00.$15.00Current price is: $15.00.
Forex Trading
Original price was: $799.00.$15.00Current price is: $15.00.
Forex Trading
Original price was: $500.00.$5.00Current price is: $5.00.
Original price was: $997.00.$13.00Current price is: $13.00.

Original price was: $299.00.$8.00Current price is: $8.00.
Forex Trading
Original price was: $249.00.$15.00Current price is: $15.00.
Original price was: $799.00.$15.00Current price is: $15.00.
Original price was: $700.00.$39.00Current price is: $39.00.
Original price was: $497.00.$31.00Current price is: $31.00.
Original price was: $497.00.$11.00Current price is: $11.00.
Forex Trading
Quantamentals – The Next Great Forefront Of Trading and Investing with Trading Markets
Original price was: $1,495.00.$8.00Current price is: $8.00.

Reviews
There are no reviews yet.