-
×
 Pristine - Trading the Pristine Method 2
1 × $6.00
Pristine - Trading the Pristine Method 2
1 × $6.00 -
×
 Market Gems Manual with Barbara J.Simon
1 × $6.00
Market Gems Manual with Barbara J.Simon
1 × $6.00 -
×
 WickOrTreat Trading Course with WickOrTreat
1 × $6.00
WickOrTreat Trading Course with WickOrTreat
1 × $6.00 -
×
 Advanced Iron Condor Course in 2021
1 × $6.00
Advanced Iron Condor Course in 2021
1 × $6.00 -
×
 Algo Wizard Essentials Course with Srategy Quant
1 × $13.00
Algo Wizard Essentials Course with Srategy Quant
1 × $13.00 -
×
 Pro9Trader 2016 Ultimate Suite v3.7
1 × $62.00
Pro9Trader 2016 Ultimate Suite v3.7
1 × $62.00 -
×
 Investing in stocks: Avoid stock market loss
1 × $15.00
Investing in stocks: Avoid stock market loss
1 × $15.00 -
×
 0 DTE Options Trading Workshop with Aeromir Corporation
1 × $15.00
0 DTE Options Trading Workshop with Aeromir Corporation
1 × $15.00 -
×
 Ultimate Trading Course with Dodgy's Dungeon
1 × $8.00
Ultimate Trading Course with Dodgy's Dungeon
1 × $8.00 -
×
 Complete Trading System with Segma Singh
1 × $6.00
Complete Trading System with Segma Singh
1 × $6.00 -
×
 Advanced Pattern Recognition with John Cameron
1 × $23.00
Advanced Pattern Recognition with John Cameron
1 × $23.00 -
×
 W. D Gann 's Square Of 9 Applied To Modern Markets with Sean Avidar - Hexatrade350
1 × $23.00
W. D Gann 's Square Of 9 Applied To Modern Markets with Sean Avidar - Hexatrade350
1 × $23.00 -
×
 CM APR (A Pivot Reverse) Trade Method with Austin Passamonte
1 × $6.00
CM APR (A Pivot Reverse) Trade Method with Austin Passamonte
1 × $6.00 -
×
 SRs Trend Rider 2.0
1 × $6.00
SRs Trend Rider 2.0
1 × $6.00 -
×
 ICT – Inner Circle Trader 2020 Weekly Review
1 × $20.00
ICT – Inner Circle Trader 2020 Weekly Review
1 × $20.00 -
×
 Market Stalkers Level 1 - Swing trading school (2020)
1 × $8.00
Market Stalkers Level 1 - Swing trading school (2020)
1 × $8.00 -
×
 Elliott Wave Simplified with Clif Droke
1 × $6.00
Elliott Wave Simplified with Clif Droke
1 × $6.00 -
×
 Marus FX 2023
1 × $5.00
Marus FX 2023
1 × $5.00 -
×
 The A14 Weekly Option Strategy Workshop with Amy Meissner
1 × $23.00
The A14 Weekly Option Strategy Workshop with Amy Meissner
1 × $23.00 -
×
 The Gorilla Game (Revised Ed.) with Greoffrey A.Moore & Paul Johnson
1 × $6.00
The Gorilla Game (Revised Ed.) with Greoffrey A.Moore & Paul Johnson
1 × $6.00 -
×
 How to Overlay Technical Indicators with Keith Raphael
1 × $6.00
How to Overlay Technical Indicators with Keith Raphael
1 × $6.00 -
×
 Secrets of Investors on WallStreet (Audio) with Ken Fisher
1 × $6.00
Secrets of Investors on WallStreet (Audio) with Ken Fisher
1 × $6.00 -
×
 WondaFX Signature Strategy with WondaFX
1 × $5.00
WondaFX Signature Strategy with WondaFX
1 × $5.00 -
×
 What Every Investor Shoud Know About Accounting Fraud with Jeff Madura
1 × $6.00
What Every Investor Shoud Know About Accounting Fraud with Jeff Madura
1 × $6.00 -
×
 Stock Trading Using Planetary Time Cycles – The Gann Method Volume I,II + Gann Astro Vol III Horoscopes and Trading Methods By Michael S. Jenkins – Stock Cycles Forecast
1 × $6.00
Stock Trading Using Planetary Time Cycles – The Gann Method Volume I,II + Gann Astro Vol III Horoscopes and Trading Methods By Michael S. Jenkins – Stock Cycles Forecast
1 × $6.00 -
×
 A Mathematician Plays The Stock Market with John Allen Paulos
1 × $6.00
A Mathematician Plays The Stock Market with John Allen Paulos
1 × $6.00 -
×
 Essentials in Quantitative Trading QT01 By HangukQuant's
1 × $23.00
Essentials in Quantitative Trading QT01 By HangukQuant's
1 × $23.00 -
×
 FXJake Webinars with Walter Peters
1 × $6.00
FXJake Webinars with Walter Peters
1 × $6.00 -
×
 Crypto Trading Academy with Cheeky Investor - Aussie Day Trader
1 × $13.00
Crypto Trading Academy with Cheeky Investor - Aussie Day Trader
1 × $13.00 -
×
 A Bull in China with Jim Rogers
1 × $6.00
A Bull in China with Jim Rogers
1 × $6.00 -
×
 TradeCraft: Your Path to Peak Performance Trading By Adam Grimes
1 × $15.00
TradeCraft: Your Path to Peak Performance Trading By Adam Grimes
1 × $15.00 -
×
 Scalp Strategy and Flipping Small Accounts with Opes Trading Group
1 × $5.00
Scalp Strategy and Flipping Small Accounts with Opes Trading Group
1 × $5.00 -
×
 Options, Futures & Other Derivatives (5th Ed.)
1 × $6.00
Options, Futures & Other Derivatives (5th Ed.)
1 × $6.00 -
×
 Best of the Best: Collars with Amy Meissner & Scott Ruble
1 × $15.00
Best of the Best: Collars with Amy Meissner & Scott Ruble
1 × $15.00 -
×
 Jeffrey Kennedy’s Package ( Discount 25% )
1 × $31.00
Jeffrey Kennedy’s Package ( Discount 25% )
1 × $31.00 -
×
 The Indices Orderflow Masterclass with The Forex Scalpers
1 × $23.00
The Indices Orderflow Masterclass with The Forex Scalpers
1 × $23.00 -
×
 Ichimoku Cloud Trading System Class with Jeff Bierman
1 × $6.00
Ichimoku Cloud Trading System Class with Jeff Bierman
1 × $6.00 -
×
 Lessons 1-30 & Tradestation Code with Charles Drummond
1 × $6.00
Lessons 1-30 & Tradestation Code with Charles Drummond
1 × $6.00 -
×
 Advanced Options Trading with Lucas Downey
1 × $15.00
Advanced Options Trading with Lucas Downey
1 × $15.00 -
×
 Order flow self-study training program with iMFtracker
1 × $10.00
Order flow self-study training program with iMFtracker
1 × $10.00 -
×
 Forecast 2024 Clarification with Larry Williams
1 × $15.00
Forecast 2024 Clarification with Larry Williams
1 × $15.00 -
×
 Matrix Spread Options Trading Course with Base Camp Trading
1 × $31.00
Matrix Spread Options Trading Course with Base Camp Trading
1 × $31.00 -
×
 Dynamic Trading Indicators with Mark W.Helweg, David C.Stendahl
1 × $6.00
Dynamic Trading Indicators with Mark W.Helweg, David C.Stendahl
1 × $6.00 -
×
 The Orderflows Trade Opportunities Encyclopedia with Michael Valtos
1 × $8.00
The Orderflows Trade Opportunities Encyclopedia with Michael Valtos
1 × $8.00 -
×
 Algo Trading Masterclass with Ali Casey - StatOasis
1 × $23.00
Algo Trading Masterclass with Ali Casey - StatOasis
1 × $23.00 -
×
 The Prop Trading Code with Brannigan Barrett - Axia Futures
1 × $23.00
The Prop Trading Code with Brannigan Barrett - Axia Futures
1 × $23.00 -
×
 Beat the Market with Edward O.Thorp
1 × $6.00
Beat the Market with Edward O.Thorp
1 × $6.00 -
×
 Online Investing Hacks with Bonnie Biafore
1 × $6.00
Online Investing Hacks with Bonnie Biafore
1 × $6.00 -
×
 CFA Level 2 - Examination Book Afternoon Section (1999)
1 × $6.00
CFA Level 2 - Examination Book Afternoon Section (1999)
1 × $6.00 -
×
 Advanced Course with Jtrader
1 × $6.00
Advanced Course with Jtrader
1 × $6.00 -
×
 Crystal Ball Pack PLUS bonus Live Trade By Pat Mitchell - Trick Trades
1 × $20.00
Crystal Ball Pack PLUS bonus Live Trade By Pat Mitchell - Trick Trades
1 × $20.00 -
×
 The Options Applications Handbook: Hedging and Speculating Techniques for Professional Investors - Erik Banks & Paul Siegel
1 × $6.00
The Options Applications Handbook: Hedging and Speculating Techniques for Professional Investors - Erik Banks & Paul Siegel
1 × $6.00 -
×
 Options Trading & Ultimate MasterClass With Tyrone Abela - FX Evolution
1 × $54.00
Options Trading & Ultimate MasterClass With Tyrone Abela - FX Evolution
1 × $54.00 -
×
 Mutual Funds for Dummies (6th edition) with Eric Tyson
1 × $6.00
Mutual Funds for Dummies (6th edition) with Eric Tyson
1 × $6.00 -
×
 Advanced Course with Dimitri Wallace - Gold Minds Global
1 × $6.00
Advanced Course with Dimitri Wallace - Gold Minds Global
1 × $6.00 -
×
 The Instagram DM Automation Playbook with Natasha Takahashi
1 × $6.00
The Instagram DM Automation Playbook with Natasha Takahashi
1 × $6.00 -
×
 $20 – 52k 20 pips a day challange with Rafał Zuchowicz - TopMasterTrader
1 × $5.00
$20 – 52k 20 pips a day challange with Rafał Zuchowicz - TopMasterTrader
1 × $5.00 -
×
 The Introduction to the Magee System of Technical Analysis CD with John Magee
1 × $6.00
The Introduction to the Magee System of Technical Analysis CD with John Magee
1 × $6.00 -
×
 Portfolio Optimization & Perfomance Analysis with Jean-Luc Prigent
1 × $6.00
Portfolio Optimization & Perfomance Analysis with Jean-Luc Prigent
1 × $6.00 -
×
 Portfolio Management in Practice with Christine Brentani
1 × $6.00
Portfolio Management in Practice with Christine Brentani
1 × $6.00 -
×
 The TrendAdvisor Guide to Breakthrough Profits with Chuck Dukas
1 × $6.00
The TrendAdvisor Guide to Breakthrough Profits with Chuck Dukas
1 × $6.00 -
×
 TRADING NFX Course with Andrew NFX
1 × $5.00
TRADING NFX Course with Andrew NFX
1 × $5.00 -
×
 ABC Waves TOS Indicator & Live Class with Simpler Options
1 × $6.00
ABC Waves TOS Indicator & Live Class with Simpler Options
1 × $6.00 -
×
 Trend Trading My Way with Markay Latimer
1 × $15.00
Trend Trading My Way with Markay Latimer
1 × $15.00 -
×
 Activedaytrader - Workshop Options For Income
1 × $15.00
Activedaytrader - Workshop Options For Income
1 × $15.00 -
×
 Market Neutral Strategies with Bruce I.Jacobs & Kenneth N.Levy
1 × $6.00
Market Neutral Strategies with Bruce I.Jacobs & Kenneth N.Levy
1 × $6.00 -
×
 Tradeguider - Wyckoff VSA eBook Collection
1 × $23.00
Tradeguider - Wyckoff VSA eBook Collection
1 × $23.00 -
×
 SQX Mentorship with Tip Toe Hippo
1 × $23.00
SQX Mentorship with Tip Toe Hippo
1 × $23.00 -
×
 Stock Detective Investor: Finding Market Gems Online with Kevin Lichtman & Lynn Duke
1 × $6.00
Stock Detective Investor: Finding Market Gems Online with Kevin Lichtman & Lynn Duke
1 × $6.00 -
×
 Fractal Energy Trading with Doc Severson
1 × $6.00
Fractal Energy Trading with Doc Severson
1 × $6.00 -
×
 Capital On Demand Masterclass with Attorney & Nate Dodson
1 × $311.00
Capital On Demand Masterclass with Attorney & Nate Dodson
1 × $311.00 -
×
 Selective Forex Trading with Don Snellgrove
1 × $6.00
Selective Forex Trading with Don Snellgrove
1 × $6.00 -
×
 Investment Psychology. Explained Classic Strategies to Beat the Markets with Martin Pring
1 × $6.00
Investment Psychology. Explained Classic Strategies to Beat the Markets with Martin Pring
1 × $6.00 -
×
 Butterfly and Condor Workshop with Aeromir
1 × $15.00
Butterfly and Condor Workshop with Aeromir
1 × $15.00 -
×
 Profiletraders - Market Profile Day Trading
1 × $15.00
Profiletraders - Market Profile Day Trading
1 × $15.00 -
×
 Alternative Beta Strategies & Hedge Fund Replication with Lars Jaeger & Jeffrey Pease
1 × $6.00
Alternative Beta Strategies & Hedge Fund Replication with Lars Jaeger & Jeffrey Pease
1 × $6.00 -
×
 Pairs Trading The Final Frontier with Don Kaufman
1 × $6.00
Pairs Trading The Final Frontier with Don Kaufman
1 × $6.00 -
×
 USDX Trading Course with Jared Martinez - MTI
1 × $6.00
USDX Trading Course with Jared Martinez - MTI
1 × $6.00 -
×
 Ambush Trading Method on Wheat & Corn with Marco Mayer
1 × $4.00
Ambush Trading Method on Wheat & Corn with Marco Mayer
1 × $4.00 -
×
 Beginner Forex Mastery Course with Harrison Uwah - MHU FX Academy
1 × $78.00
Beginner Forex Mastery Course with Harrison Uwah - MHU FX Academy
1 × $78.00 -
×
 Build A Solid Foundation For Trading Options with Corey Halliday
1 × $6.00
Build A Solid Foundation For Trading Options with Corey Halliday
1 × $6.00 -
×
 Trading Secrets of the Inner Circle with Andrew Goodwin
1 × $6.00
Trading Secrets of the Inner Circle with Andrew Goodwin
1 × $6.00 -
×
 ABCs of Trading and Tech Analysis (Online Investor Expo, Las Vegas 2000) with Tom Bierovic
1 × $6.00
ABCs of Trading and Tech Analysis (Online Investor Expo, Las Vegas 2000) with Tom Bierovic
1 × $6.00 -
×
 4 Class Bundle
1 × $31.00
4 Class Bundle
1 × $31.00 -
×
 Advanced Forex Mastery Course with Alpha Forex Global
1 × $5.00
Advanced Forex Mastery Course with Alpha Forex Global
1 × $5.00 -
×
 Perfect Strategy - SPX Daily Options Income with Peter Titus - Marwood Research
1 × $15.00
Perfect Strategy - SPX Daily Options Income with Peter Titus - Marwood Research
1 × $15.00 -
×
 AI For Traders with Trading Markets
1 × $31.00
AI For Traders with Trading Markets
1 × $31.00 -
×
 Annual Forecast Reports - Forecast 2023 with Larry Williams
1 × $8.00
Annual Forecast Reports - Forecast 2023 with Larry Williams
1 × $8.00 -
×
 Perfecting Execution and Trade Management Online Masterclass with The Trading Framework
1 × $6.00
Perfecting Execution and Trade Management Online Masterclass with The Trading Framework
1 × $6.00 -
×
 Secrets of Great Investors (Audio Book 471 MB) with Louis Rukeyser
1 × $6.00
Secrets of Great Investors (Audio Book 471 MB) with Louis Rukeyser
1 × $6.00 -
×
 FX At One Glance - Ichimoku Advanced Japanese Techniques
1 × $15.00
FX At One Glance - Ichimoku Advanced Japanese Techniques
1 × $15.00 -
×
 Create Your Own ETF Hedge Fund: A Do-It-Yourself ETF Strategy for Private Wealth Management with David Fry
1 × $6.00
Create Your Own ETF Hedge Fund: A Do-It-Yourself ETF Strategy for Private Wealth Management with David Fry
1 × $6.00 -
×
 Fibonacci Ratios with Pattern Recognition - Larry Pesavento & Steven Shapiro
1 × $6.00
Fibonacci Ratios with Pattern Recognition - Larry Pesavento & Steven Shapiro
1 × $6.00 -
×
 Stupid Trader – Play Safe!
1 × $6.00
Stupid Trader – Play Safe!
1 × $6.00 -
×
 Great Market Technicians of the 21st Century. Galileo, Fibonacci & Beethoven with Constance Brown
1 × $6.00
Great Market Technicians of the 21st Century. Galileo, Fibonacci & Beethoven with Constance Brown
1 × $6.00

TTM Slingshot & Value Charts Indicators
$6.00
File Size: Coming soon!
Delivery Time: 1–12 hours
Media Type: Online Course
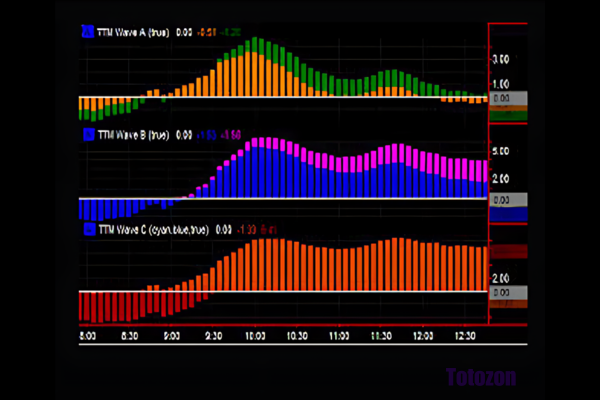
TTM Slingshot & Value Charts Indicators
Introduction to TTM Slingshot & Value Charts
In the dynamic world of trading, having the right tools can make all the difference. Two such powerful tools are the TTM Slingshot and Value Charts Indicators. These indicators provide traders with crucial insights, helping them navigate market complexities and make informed decisions.
Understanding TTM Slingshot
What is TTM Slingshot?
The TTM Slingshot is an advanced trading indicator developed by John Carter. It combines multiple moving averages to identify potential breakout points in the market. By analyzing the relationship between these moving averages, the TTM Slingshot helps traders spot opportunities for entering or exiting trades.
Key Features of TTM Slingshot
- Multiple Moving Averages: Uses short-term and long-term moving averages.
- Breakout Identification: Detects potential breakout points.
- Versatility: Applicable across various markets and timeframes.
Benefits of Using TTM Slingshot
Enhanced Market Analysis
The TTM Slingshot provides a detailed analysis of market trends, allowing traders to anticipate significant price movements. This indicator’s ability to pinpoint breakout points is invaluable for making timely trading decisions.
Improved Trading Accuracy
By combining multiple moving averages, the TTM Slingshot offers a comprehensive view of the market. This integration reduces noise and enhances the accuracy of predictions, leading to more successful trades.
Setting Up TTM Slingshot
Choosing the Right Platform
To utilize the TTM Slingshot, you’ll need a trading platform that supports custom indicators. Platforms like Thinkorswim and TradeStation are popular choices among traders.
Installing the Indicator
- Download the Indicator: Obtain the TTM Slingshot file compatible with your trading platform.
- Open Your Platform: Launch the trading platform.
- Add the Indicator: Navigate to the ‘Indicators’ section and add the TTM Slingshot file.
- Customize Settings: Adjust the settings to align with your trading strategy.
Understanding Value Charts Indicators
What are Value Charts Indicators?
Value Charts Indicators are tools that measure the relative value of a security based on its price history. These indicators help traders determine whether a security is overvalued, undervalued, or fairly valued, providing a clear picture of potential trading opportunities.
Key Features of Value Charts Indicators
- Relative Value Measurement: Assesses the value of a security.
- Overbought/Oversold Conditions: Identifies extreme market conditions.
- Visual Representation: Displays value levels on a chart for easy interpretation.
Benefits of Using Value Charts Indicators
Identifying Market Extremes
Value Charts Indicators are excellent for spotting overbought and oversold conditions. By identifying these extremes, traders can make strategic decisions about entering or exiting positions.
Enhancing Risk Management
These indicators aid in risk management by providing insights into the relative value of a security. Traders can use this information to set stop-loss levels and protect their investments.
Setting Up Value Charts Indicators
Selecting the Appropriate Platform
Choose a trading platform that supports Value Charts Indicators. Many modern trading platforms, such as NinjaTrader and MetaTrader, offer these indicators.
Installing the Indicator
- Download the Indicator: Obtain the Value Charts Indicator file for your platform.
- Open Your Platform: Start the trading platform.
- Add the Indicator: Go to the ‘Indicators’ section and add the Value Charts file.
- Configure Settings: Customize the settings to fit your trading approach.
How to Use TTM Slingshot & Value Charts Together
Combining Indicators for Better Insights
Using TTM Slingshot and Value Charts Indicators together can enhance your market analysis. While TTM Slingshot identifies breakout points, Value Charts Indicators help assess the relative value of the security, providing a more comprehensive view.
Practical Application
- Entry Points: Use TTM Slingshot to identify breakout points and confirm with Value Charts Indicators to ensure the security is not overvalued.
- Exit Points: Value Charts Indicators can signal overbought conditions, indicating a good time to exit, while TTM Slingshot confirms the end of a trend.
Advanced Strategies with TTM Slingshot & Value Charts
Pairing with Other Indicators
For even more robust analysis, pair TTM Slingshot and Value Charts Indicators with other tools such as RSI (Relative Strength Index) and MACD (Moving Average Convergence Divergence).
Developing a Trading Plan
Create a detailed trading plan that incorporates these indicators. Define your entry and exit points, risk management strategies, and the specific market conditions you’re targeting.
Real-Life Examples
Successful Trade Case Study
Consider a scenario where the TTM Slingshot indicates a breakout, and Value Charts Indicators show the security is undervalued. Entering a trade at this point could lead to significant profits as the price moves to its fair value.
Learning from Mistakes
Analyze trades where the indicators did not predict the expected outcome. Understanding these failures can help refine your strategy and improve future performance.
Conclusion
Maximizing Your Trading Success
The TTM Slingshot and Value Charts Indicators are powerful tools that, when used together, can significantly enhance your trading strategy. By providing insights into market trends and relative value, these indicators help you make more informed decisions.
Taking the Next Step
Start by setting up these indicators on your trading platform. Practice interpreting the signals and integrating them into your trading strategy to see the benefits firsthand.

FAQs
What is the TTM Slingshot indicator?
The TTM Slingshot is a trading tool that uses multiple moving averages to identify breakout points in the market.
How do Value Charts Indicators work?
Value Charts Indicators measure the relative value of a security, helping traders identify overbought and oversold conditions.
Can these indicators be used together?
Yes, combining TTM Slingshot and Value Charts Indicators provides a comprehensive analysis of market trends and security value.
Which platforms support these indicators?
Platforms like Thinkorswim, TradeStation, NinjaTrader, and MetaTrader support TTM Slingshot and Value Charts Indicators.
How do I install these indicators?
Download the respective indicator files, open your trading platform, and add the indicators through the ‘Indicators’ section.
Be the first to review “TTM Slingshot & Value Charts Indicators”
You must be logged in to post a review.
Related products
Forex Trading
Original price was: $1,898.00.$10.00Current price is: $10.00.
Original price was: $139.00.$23.00Current price is: $23.00.
Forex Trading
Original price was: $2,995.00.$31.00Current price is: $31.00.

Forex Trading
Original price was: $697.00.$5.00Current price is: $5.00.

Original price was: $2,120.00.$15.00Current price is: $15.00.

Original price was: $497.00.$11.00Current price is: $11.00.

Original price was: $997.00.$8.00Current price is: $8.00.
Forex Trading
Original price was: $999.00.$15.00Current price is: $15.00.
Forex Trading
Original price was: $500.00.$5.00Current price is: $5.00.
Original price was: $997.00.$13.00Current price is: $13.00.
Original price was: $1,800.00.$54.00Current price is: $54.00.
Forex Trading
Original price was: $249.00.$15.00Current price is: $15.00.

Forex Trading
Original price was: $4,997.00.$27.00Current price is: $27.00.
Original price was: $450.00.$23.00Current price is: $23.00.

Forex Trading
The Complete Guide to Multiple Time Frame Analysis & Reading Price Action with Aiman Almansoori
Original price was: $1,399.00.$13.00Current price is: $13.00.
Original price was: $4,995.00.$15.00Current price is: $15.00.
Forex Trading
Original price was: $799.00.$15.00Current price is: $15.00.
Forex Trading
Original price was: $2,997.00.$23.00Current price is: $23.00.

Forex Trading
Original price was: $125.00.$17.00Current price is: $17.00.

Forex Trading
Original price was: $499.00.$15.00Current price is: $15.00.

Reviews
There are no reviews yet.