-
×
 Trading Weekly Options for Income in 2016 with Dan Sheridan
1 × $23.00
Trading Weekly Options for Income in 2016 with Dan Sheridan
1 × $23.00 -
×
 ActiveBeta Indexes. Capturing Systematic Sources of Active Equity Returns (HTML) with Andrew Lo
1 × $6.00
ActiveBeta Indexes. Capturing Systematic Sources of Active Equity Returns (HTML) with Andrew Lo
1 × $6.00 -
×
 Euro Fractal Trading System with Cynthia Marcy, Erol Bortucene
1 × $6.00
Euro Fractal Trading System with Cynthia Marcy, Erol Bortucene
1 × $6.00 -
×
 Advanced Spread Trading with Guy Bower - MasterClass Trader
1 × $15.00
Advanced Spread Trading with Guy Bower - MasterClass Trader
1 × $15.00 -
×
 GTA Professional Course with Gova Trading Academy
1 × $5.00
GTA Professional Course with Gova Trading Academy
1 × $5.00 -
×
 The Complete Guide to Multiple Time Frame Analysis & Reading Price Action with Aiman Almansoori
1 × $13.00
The Complete Guide to Multiple Time Frame Analysis & Reading Price Action with Aiman Almansoori
1 × $13.00 -
×
 Market Analysis Companion for Metastock with Martin Pring
1 × $6.00
Market Analysis Companion for Metastock with Martin Pring
1 × $6.00 -
×
 TRADING NFX Course with Andrew NFX
1 × $5.00
TRADING NFX Course with Andrew NFX
1 × $5.00 -
×
 Market Risk Analysis, Volume IV, Value at Risk Models with Carol Alexander
1 × $6.00
Market Risk Analysis, Volume IV, Value at Risk Models with Carol Alexander
1 × $6.00 -
×
 Forecast 2024 Clarification with Larry Williams
1 × $15.00
Forecast 2024 Clarification with Larry Williams
1 × $15.00 -
×
 Essentials in Quantitative Trading QT01 By HangukQuant's
1 × $23.00
Essentials in Quantitative Trading QT01 By HangukQuant's
1 × $23.00 -
×
 The A14 Weekly Option Strategy Workshop with Amy Meissner
1 × $23.00
The A14 Weekly Option Strategy Workshop with Amy Meissner
1 × $23.00 -
×
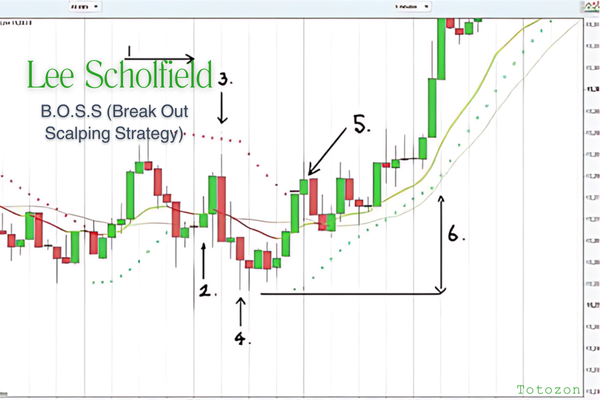 B.O.S.S (Break Out Scalping Strategy) with Lee Scholfield
1 × $6.00
B.O.S.S (Break Out Scalping Strategy) with Lee Scholfield
1 × $6.00 -
×
 Options Trading & Ultimate MasterClass With Tyrone Abela - FX Evolution
1 × $54.00
Options Trading & Ultimate MasterClass With Tyrone Abela - FX Evolution
1 × $54.00 -
×
 How to avoid the GAP
1 × $6.00
How to avoid the GAP
1 × $6.00 -
×
 $20 – 52k 20 pips a day challange with Rafał Zuchowicz - TopMasterTrader
1 × $5.00
$20 – 52k 20 pips a day challange with Rafał Zuchowicz - TopMasterTrader
1 × $5.00 -
×
 Growth Traders Toolbox Course with Julian Komar
1 × $5.00
Growth Traders Toolbox Course with Julian Komar
1 × $5.00 -
×
 Traders Classroom Collection Volume 1-4 with Jeffrey Kennedy
1 × $15.00
Traders Classroom Collection Volume 1-4 with Jeffrey Kennedy
1 × $15.00 -
×
 Trading Non-Farm Payroll Report
1 × $6.00
Trading Non-Farm Payroll Report
1 × $6.00 -
×
 Investment Mathematics with Andrew Adams
1 × $6.00
Investment Mathematics with Andrew Adams
1 × $6.00 -
×
 Mastering the Geometry of Market Energy with Charles Drummond
1 × $6.00
Mastering the Geometry of Market Energy with Charles Drummond
1 × $6.00 -
×
 Analysis of Equity Investments: Valuation with John Stowe, Thomas Robinson, Jerald Pinto & Dennis McLeavey
1 × $6.00
Analysis of Equity Investments: Valuation with John Stowe, Thomas Robinson, Jerald Pinto & Dennis McLeavey
1 × $6.00 -
×
 Technical Analysis for Long-Term Investors with Clay Allen
1 × $6.00
Technical Analysis for Long-Term Investors with Clay Allen
1 × $6.00 -
×
 Computerized Trading with Mark Jurik
1 × $6.00
Computerized Trading with Mark Jurik
1 × $6.00 -
×
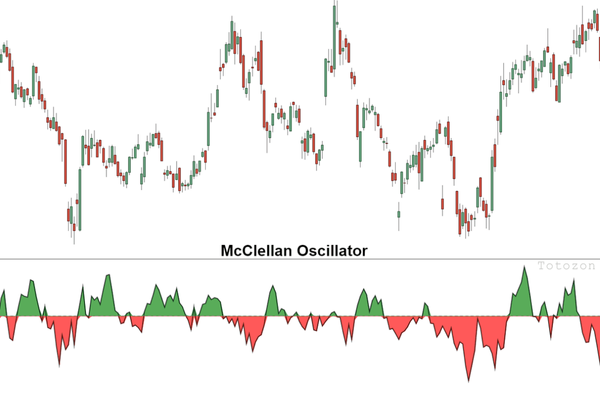 The McClellan Oscillator and Other Tools for with Tom McClellan
1 × $6.00
The McClellan Oscillator and Other Tools for with Tom McClellan
1 × $6.00 -
×
 Forex Power Strategy Course with Jason Steele
1 × $6.00
Forex Power Strategy Course with Jason Steele
1 × $6.00 -
×
 Quantitative Technical Analysis: An integrated approach to trading system development and trading management
1 × $6.00
Quantitative Technical Analysis: An integrated approach to trading system development and trading management
1 × $6.00 -
×
 Advanced Fibonacci Trading with Neal Hughes
1 × $6.00
Advanced Fibonacci Trading with Neal Hughes
1 × $6.00 -
×
 Wyckoff Analytics Courses Collection
1 × $27.00
Wyckoff Analytics Courses Collection
1 × $27.00 -
×
 MAM EA (Unlocked) with Christopher Wilson
1 × $6.00
MAM EA (Unlocked) with Christopher Wilson
1 × $6.00 -
×
 WondaFX Signature Strategy with WondaFX
1 × $5.00
WondaFX Signature Strategy with WondaFX
1 × $5.00 -
×
 Mutual Funds for Dummies (6th edition) with Eric Tyson
1 × $6.00
Mutual Funds for Dummies (6th edition) with Eric Tyson
1 × $6.00 -
×
 ICT Prodigy Trading Course – $650K in Payouts with Alex Solignani
1 × $15.00
ICT Prodigy Trading Course – $650K in Payouts with Alex Solignani
1 × $15.00 -
×
 Scalp Strategy and Flipping Small Accounts with Opes Trading Group
1 × $5.00
Scalp Strategy and Flipping Small Accounts with Opes Trading Group
1 × $5.00 -
×
 How to Trade in Stocks
1 × $6.00
How to Trade in Stocks
1 × $6.00 -
×
 0 DTE Options Trading Workshop with Aeromir Corporation
1 × $15.00
0 DTE Options Trading Workshop with Aeromir Corporation
1 × $15.00 -
×
 The Best Option Trading Course with David Jaffee - Best Stock Strategy
1 × $15.00
The Best Option Trading Course with David Jaffee - Best Stock Strategy
1 × $15.00 -
×
 Adx Mastery Complete Course
1 × $6.00
Adx Mastery Complete Course
1 × $6.00 -
×
 Neowave. Inovations that Make Elliott Wave Work Better for You with Glenn Neely
1 × $6.00
Neowave. Inovations that Make Elliott Wave Work Better for You with Glenn Neely
1 × $6.00 -
×
 AI For Traders with Trading Markets
1 × $31.00
AI For Traders with Trading Markets
1 × $31.00 -
×
 Getting Started in Technical Analysis with Jack Schwager
1 × $6.00
Getting Started in Technical Analysis with Jack Schwager
1 × $6.00 -
×
 Krautgap By John Piper
1 × $6.00
Krautgap By John Piper
1 × $6.00 -
×
 TraderSumo Academy Course
1 × $13.00
TraderSumo Academy Course
1 × $13.00 -
×
 The Naked Eye: Raw Data Analytics with Edgar Torres - Raw Data Analytics
1 × $8.00
The Naked Eye: Raw Data Analytics with Edgar Torres - Raw Data Analytics
1 × $8.00 -
×
 OPTIONS FOR BEGINNERS
1 × $6.00
OPTIONS FOR BEGINNERS
1 × $6.00 -
×
 Master Time Factor & Forecasting with Mathematical Rules
1 × $6.00
Master Time Factor & Forecasting with Mathematical Rules
1 × $6.00 -
×
 Tradingmarkets - Introduction to AmiBroker Programming
1 × $15.00
Tradingmarkets - Introduction to AmiBroker Programming
1 × $15.00 -
×
 Perfect Publishing System Elite with Johnny Andrews
1 × $6.00
Perfect Publishing System Elite with Johnny Andrews
1 × $6.00 -
×
 Cyclic Analysis. A BreakThrough in Transaction Timing with Cyclitec Services
1 × $6.00
Cyclic Analysis. A BreakThrough in Transaction Timing with Cyclitec Services
1 × $6.00 -
×
 The Complete Guide to Option Selling, 2nd 2009 with James Cordier & Michael Gross
1 × $6.00
The Complete Guide to Option Selling, 2nd 2009 with James Cordier & Michael Gross
1 × $6.00 -
×
 Momentum Options Trading Course with Eric Jellerson
1 × $272.00
Momentum Options Trading Course with Eric Jellerson
1 × $272.00 -
×
 SQX Mentorship with Tip Toe Hippo
1 × $23.00
SQX Mentorship with Tip Toe Hippo
1 × $23.00 -
×
 Practical Approach to Ninjatrader 8 Platform with Rajandran R
1 × $6.00
Practical Approach to Ninjatrader 8 Platform with Rajandran R
1 × $6.00 -
×
 Arcane 2.0 Course
1 × $6.00
Arcane 2.0 Course
1 × $6.00 -
×
 Part I Basic and Part II Beyond the Basic with Strategic Trading
1 × $6.00
Part I Basic and Part II Beyond the Basic with Strategic Trading
1 × $6.00 -
×
 Pine Script Mastery Course with Matthew Slabosz
1 × $5.00
Pine Script Mastery Course with Matthew Slabosz
1 × $5.00 -
×
 Build a Professional Trading System using Amibroker with Trading Tuitions - Marwood Research
1 × $23.00
Build a Professional Trading System using Amibroker with Trading Tuitions - Marwood Research
1 × $23.00 -
×
 How To Trade Fundamental News Release 2022 with Patrick Muke
1 × $6.00
How To Trade Fundamental News Release 2022 with Patrick Muke
1 × $6.00 -
×
 Better Trading with the Guppy Multiple Moving Average WorkBook with Daryl Guppy
1 × $6.00
Better Trading with the Guppy Multiple Moving Average WorkBook with Daryl Guppy
1 × $6.00 -
×
 OFA - Intensive Boot Camp 5 Day Course
1 × $6.00
OFA - Intensive Boot Camp 5 Day Course
1 × $6.00 -
×
 High Probability Trading Using Elliott Wave And Fibonacci Analysis withVic Patel - Forex Training Group
1 × $10.00
High Probability Trading Using Elliott Wave And Fibonacci Analysis withVic Patel - Forex Training Group
1 × $10.00 -
×
 Activedaytrader - Mastering Technicals
1 × $15.00
Activedaytrader - Mastering Technicals
1 × $15.00 -
×
 Supply and Demand Video Course with JamesFXS
1 × $13.00
Supply and Demand Video Course with JamesFXS
1 × $13.00 -
×
 FXStreet Unrecorded Webinars Sept & Oct, 2011 with Sam Seiden
1 × $6.00
FXStreet Unrecorded Webinars Sept & Oct, 2011 with Sam Seiden
1 × $6.00 -
×
 Hedge Fund of Funds Investing with Joseph Nicholas
1 × $6.00
Hedge Fund of Funds Investing with Joseph Nicholas
1 × $6.00 -
×
 Beat the Market with Edward O.Thorp
1 × $6.00
Beat the Market with Edward O.Thorp
1 × $6.00 -
×
 Investing in stocks: Avoid stock market loss
1 × $15.00
Investing in stocks: Avoid stock market loss
1 × $15.00 -
×
 The New Science of Asset Allocation with Thomas Schneeweis
1 × $6.00
The New Science of Asset Allocation with Thomas Schneeweis
1 × $6.00 -
×
 Online Course - Why Wave Analysis Belongs in Every Trader's Toolbox with Jeffrey Kennedy - Elliott Wave
1 × $15.00
Online Course - Why Wave Analysis Belongs in Every Trader's Toolbox with Jeffrey Kennedy - Elliott Wave
1 × $15.00 -
×
 Revolutionary Proven 3 Step with NFTs Cracked
1 × $6.00
Revolutionary Proven 3 Step with NFTs Cracked
1 × $6.00 -
×
 Options Education FULL Course 30+ Hours with Macrohedged
1 × $23.00
Options Education FULL Course 30+ Hours with Macrohedged
1 × $23.00 -
×
 Trading Short TermSame Day Trades Sep 2023 with Dan Sheridan & Mark Fenton - Sheridan Options Mentoring
1 × $31.00
Trading Short TermSame Day Trades Sep 2023 with Dan Sheridan & Mark Fenton - Sheridan Options Mentoring
1 × $31.00 -
×
 Hedge Fund Investment Management with Izze Nelken
1 × $6.00
Hedge Fund Investment Management with Izze Nelken
1 × $6.00 -
×
 Concerning The More Certain Fundamentals Of Astrology
1 × $6.00
Concerning The More Certain Fundamentals Of Astrology
1 × $6.00 -
×
 Option Hydra - Mar 2020 Edition - Basics with Rajandran R
1 × $23.00
Option Hydra - Mar 2020 Edition - Basics with Rajandran R
1 × $23.00 -
×
 Trading Aplications of Japanese Candlestick Charting with Gary S.Wagner & Bradley L.Matheny
1 × $6.00
Trading Aplications of Japanese Candlestick Charting with Gary S.Wagner & Bradley L.Matheny
1 × $6.00 -
×
 Power Combo with Random Walk Trading
1 × $15.00
Power Combo with Random Walk Trading
1 × $15.00 -
×
 Elliott Wave Swing High Low Indicator for ThinkorSwim with Fibonacci
1 × $6.00
Elliott Wave Swing High Low Indicator for ThinkorSwim with Fibonacci
1 × $6.00 -
×
 VIP - One on One Coursework with Talkin Options
1 × $15.00
VIP - One on One Coursework with Talkin Options
1 × $15.00 -
×
 Capital Flows and Crises with Barry Eichengreen
1 × $6.00
Capital Flows and Crises with Barry Eichengreen
1 × $6.00 -
×
 Secrets of Swiss Banking with Hoyt Barber
1 × $6.00
Secrets of Swiss Banking with Hoyt Barber
1 × $6.00 -
×
 Investing in Corporate Bonds and Credit Risk with Frank Hagenstein
1 × $6.00
Investing in Corporate Bonds and Credit Risk with Frank Hagenstein
1 × $6.00 -
×
 Crystal Ball Pack PLUS bonus Live Trade By Pat Mitchell - Trick Trades
1 × $20.00
Crystal Ball Pack PLUS bonus Live Trade By Pat Mitchell - Trick Trades
1 × $20.00 -
×
 Trade Chart Patterns Like The Pros with Suri Duddella
1 × $6.00
Trade Chart Patterns Like The Pros with Suri Duddella
1 × $6.00 -
×
 Ultimate Trading Course with Dodgy's Dungeon
1 × $8.00
Ultimate Trading Course with Dodgy's Dungeon
1 × $8.00 -
×
 Power Charting - Robert’s Indicator Webinar
1 × $6.00
Power Charting - Robert’s Indicator Webinar
1 × $6.00 -
×
 Forex Trading Course with Mike Norman
1 × $17.00
Forex Trading Course with Mike Norman
1 × $17.00 -
×
 3 Volatility Strategies with Quantified Strategies
1 × $23.00
3 Volatility Strategies with Quantified Strategies
1 × $23.00 -
×
 Support and Resistance Trading with Rob Booker
1 × $6.00
Support and Resistance Trading with Rob Booker
1 × $6.00 -
×
 Home Run Options Trading Course with Dave Aquino - Base Camp Trading
1 × $11.00
Home Run Options Trading Course with Dave Aquino - Base Camp Trading
1 × $11.00 -
×
 Monthly Income with Short Strangles, Dan's Way - Dan Sheridan - Sheridan Options Mentoring
1 × $69.00
Monthly Income with Short Strangles, Dan's Way - Dan Sheridan - Sheridan Options Mentoring
1 × $69.00 -
×
 Freak Forex Fundamentals with Ken FX Freak
1 × $6.00
Freak Forex Fundamentals with Ken FX Freak
1 × $6.00 -
×
 Penny Stock Mastery
1 × $31.00
Penny Stock Mastery
1 × $31.00 -
×
 Order flow self-study training program with iMFtracker
1 × $10.00
Order flow self-study training program with iMFtracker
1 × $10.00 -
×
 Apteros Trading Fall Intensive 2021 - Trading Intensive
1 × $54.00
Apteros Trading Fall Intensive 2021 - Trading Intensive
1 × $54.00 -
×
 Level II Profit System with Sammy Chua
1 × $6.00
Level II Profit System with Sammy Chua
1 × $6.00 -
×
 Index Funds with Mark Hebner
1 × $6.00
Index Funds with Mark Hebner
1 × $6.00 -
×
 Zap Seminar - Ablesys
1 × $6.00
Zap Seminar - Ablesys
1 × $6.00 -
×
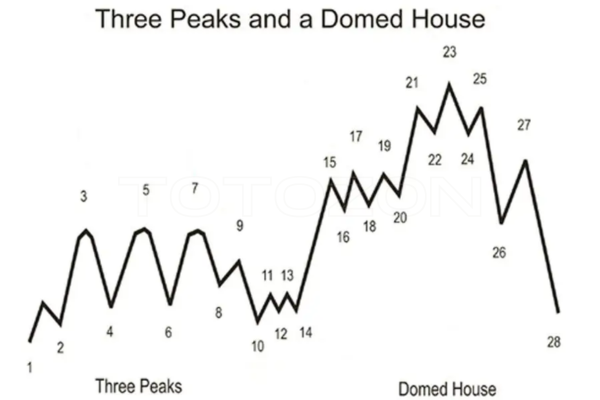 George Lindays. 3 Peaks and the Domed House Revised with Barclay T.Leib
1 × $6.00
George Lindays. 3 Peaks and the Domed House Revised with Barclay T.Leib
1 × $6.00 -
×
 MACK - PATS Simple ES Scalping Strategy
1 × $15.00
MACK - PATS Simple ES Scalping Strategy
1 × $15.00 -
×
 Traders Secret Library
1 × $6.00
Traders Secret Library
1 × $6.00 -
×
 Masterclass 2.0 with Dave Teaches
1 × $31.00
Masterclass 2.0 with Dave Teaches
1 × $31.00 -
×
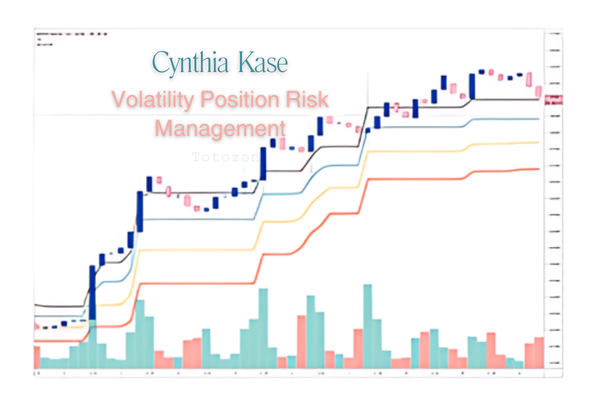 Volatility Position Risk Management with Cynthia Kase
1 × $6.00
Volatility Position Risk Management with Cynthia Kase
1 × $6.00 -
×
 How to Collect Income Being Short with Don Kaufman
1 × $6.00
How to Collect Income Being Short with Don Kaufman
1 × $6.00 -
×
 Investment Fables with Aswath Damodaran
1 × $6.00
Investment Fables with Aswath Damodaran
1 × $6.00 -
×
 Build A Solid Foundation For Trading Options with Corey Halliday
1 × $6.00
Build A Solid Foundation For Trading Options with Corey Halliday
1 × $6.00 -
×
 Butterfly and Condor Workshop with Aeromir
1 × $15.00
Butterfly and Condor Workshop with Aeromir
1 × $15.00 -
×
 Alpha Quant Program with Lucas Inglese - Quantreo
1 × $15.00
Alpha Quant Program with Lucas Inglese - Quantreo
1 × $15.00 -
×
 Crypto Trading Academy with Cheeky Investor - Aussie Day Trader
1 × $13.00
Crypto Trading Academy with Cheeky Investor - Aussie Day Trader
1 × $13.00 -
×
 FX Prosperity Academy with Leonard Williams Jr
1 × $5.00
FX Prosperity Academy with Leonard Williams Jr
1 × $5.00 -
×
 How To Read The Market Professionally with TradeSmart
1 × $27.00
How To Read The Market Professionally with TradeSmart
1 × $27.00 -
×
 Range Trading with D.Singleton
1 × $6.00
Range Trading with D.Singleton
1 × $6.00 -
×
 Trading Analysis Crash Course
1 × $23.00
Trading Analysis Crash Course
1 × $23.00 -
×
 Pocketing Premium Master Class (Basic) with Henrry Gambell
1 × $31.00
Pocketing Premium Master Class (Basic) with Henrry Gambell
1 × $31.00 -
×
 Pre-Previews. 23 Articles and Forecasts
1 × $6.00
Pre-Previews. 23 Articles and Forecasts
1 × $6.00 -
×
 New Market Timing Techniques
1 × $6.00
New Market Timing Techniques
1 × $6.00 -
×
 Intro To Short Selling with Madaz Money
1 × $31.00
Intro To Short Selling with Madaz Money
1 × $31.00 -
×
 Scalping the Forex
1 × $6.00
Scalping the Forex
1 × $6.00 -
×
 CFA Level 1 - Schweser Study Notes 2006 (schweser.com)
1 × $6.00
CFA Level 1 - Schweser Study Notes 2006 (schweser.com)
1 × $6.00

TTM Slingshot & Value Charts Indicators
$6.00
File Size: Coming soon!
Delivery Time: 1–12 hours
Media Type: Online Course
TTM Slingshot & Value Charts Indicators
Introduction to TTM Slingshot & Value Charts
In the dynamic world of trading, having the right tools can make all the difference. Two such powerful tools are the TTM Slingshot and Value Charts Indicators. These indicators provide traders with crucial insights, helping them navigate market complexities and make informed decisions.
Understanding TTM Slingshot
What is TTM Slingshot?
The TTM Slingshot is an advanced trading indicator developed by John Carter. It combines multiple moving averages to identify potential breakout points in the market. By analyzing the relationship between these moving averages, the TTM Slingshot helps traders spot opportunities for entering or exiting trades.
Key Features of TTM Slingshot
- Multiple Moving Averages: Uses short-term and long-term moving averages.
- Breakout Identification: Detects potential breakout points.
- Versatility: Applicable across various markets and timeframes.
Benefits of Using TTM Slingshot
Enhanced Market Analysis
The TTM Slingshot provides a detailed analysis of market trends, allowing traders to anticipate significant price movements. This indicator’s ability to pinpoint breakout points is invaluable for making timely trading decisions.
Improved Trading Accuracy
By combining multiple moving averages, the TTM Slingshot offers a comprehensive view of the market. This integration reduces noise and enhances the accuracy of predictions, leading to more successful trades.
Setting Up TTM Slingshot
Choosing the Right Platform
To utilize the TTM Slingshot, you’ll need a trading platform that supports custom indicators. Platforms like Thinkorswim and TradeStation are popular choices among traders.
Installing the Indicator
- Download the Indicator: Obtain the TTM Slingshot file compatible with your trading platform.
- Open Your Platform: Launch the trading platform.
- Add the Indicator: Navigate to the ‘Indicators’ section and add the TTM Slingshot file.
- Customize Settings: Adjust the settings to align with your trading strategy.
Understanding Value Charts Indicators
What are Value Charts Indicators?
Value Charts Indicators are tools that measure the relative value of a security based on its price history. These indicators help traders determine whether a security is overvalued, undervalued, or fairly valued, providing a clear picture of potential trading opportunities.
Key Features of Value Charts Indicators
- Relative Value Measurement: Assesses the value of a security.
- Overbought/Oversold Conditions: Identifies extreme market conditions.
- Visual Representation: Displays value levels on a chart for easy interpretation.
Benefits of Using Value Charts Indicators
Identifying Market Extremes
Value Charts Indicators are excellent for spotting overbought and oversold conditions. By identifying these extremes, traders can make strategic decisions about entering or exiting positions.
Enhancing Risk Management
These indicators aid in risk management by providing insights into the relative value of a security. Traders can use this information to set stop-loss levels and protect their investments.
Setting Up Value Charts Indicators
Selecting the Appropriate Platform
Choose a trading platform that supports Value Charts Indicators. Many modern trading platforms, such as NinjaTrader and MetaTrader, offer these indicators.
Installing the Indicator
- Download the Indicator: Obtain the Value Charts Indicator file for your platform.
- Open Your Platform: Start the trading platform.
- Add the Indicator: Go to the ‘Indicators’ section and add the Value Charts file.
- Configure Settings: Customize the settings to fit your trading approach.
How to Use TTM Slingshot & Value Charts Together
Combining Indicators for Better Insights
Using TTM Slingshot and Value Charts Indicators together can enhance your market analysis. While TTM Slingshot identifies breakout points, Value Charts Indicators help assess the relative value of the security, providing a more comprehensive view.
Practical Application
- Entry Points: Use TTM Slingshot to identify breakout points and confirm with Value Charts Indicators to ensure the security is not overvalued.
- Exit Points: Value Charts Indicators can signal overbought conditions, indicating a good time to exit, while TTM Slingshot confirms the end of a trend.
Advanced Strategies with TTM Slingshot & Value Charts
Pairing with Other Indicators
For even more robust analysis, pair TTM Slingshot and Value Charts Indicators with other tools such as RSI (Relative Strength Index) and MACD (Moving Average Convergence Divergence).
Developing a Trading Plan
Create a detailed trading plan that incorporates these indicators. Define your entry and exit points, risk management strategies, and the specific market conditions you’re targeting.
Real-Life Examples
Successful Trade Case Study
Consider a scenario where the TTM Slingshot indicates a breakout, and Value Charts Indicators show the security is undervalued. Entering a trade at this point could lead to significant profits as the price moves to its fair value.
Learning from Mistakes
Analyze trades where the indicators did not predict the expected outcome. Understanding these failures can help refine your strategy and improve future performance.
Conclusion
Maximizing Your Trading Success
The TTM Slingshot and Value Charts Indicators are powerful tools that, when used together, can significantly enhance your trading strategy. By providing insights into market trends and relative value, these indicators help you make more informed decisions.
Taking the Next Step
Start by setting up these indicators on your trading platform. Practice interpreting the signals and integrating them into your trading strategy to see the benefits firsthand.

FAQs
What is the TTM Slingshot indicator?
The TTM Slingshot is a trading tool that uses multiple moving averages to identify breakout points in the market.
How do Value Charts Indicators work?
Value Charts Indicators measure the relative value of a security, helping traders identify overbought and oversold conditions.
Can these indicators be used together?
Yes, combining TTM Slingshot and Value Charts Indicators provides a comprehensive analysis of market trends and security value.
Which platforms support these indicators?
Platforms like Thinkorswim, TradeStation, NinjaTrader, and MetaTrader support TTM Slingshot and Value Charts Indicators.
How do I install these indicators?
Download the respective indicator files, open your trading platform, and add the indicators through the ‘Indicators’ section.
Be the first to review “TTM Slingshot & Value Charts Indicators”
You must be logged in to post a review.
Related products
Forex Trading
Original price was: $500.00.$5.00Current price is: $5.00.

Original price was: $450.00.$23.00Current price is: $23.00.
Original price was: $197.00.$5.00Current price is: $5.00.
Original price was: $649.00.$20.00Current price is: $20.00.
Forex Trading
Original price was: $550.00.$5.00Current price is: $5.00.
Original price was: $895.00.$15.00Current price is: $15.00.

Original price was: $299.00.$8.00Current price is: $8.00.

Forex Trading
Original price was: $2,000.00.$23.00Current price is: $23.00.
Forex Trading
Original price was: $999.00.$15.00Current price is: $15.00.
Forex Trading
Original price was: $2,995.00.$31.00Current price is: $31.00.
Original price was: $310.00.$23.00Current price is: $23.00.
Forex Trading
Original price was: $2,997.00.$23.00Current price is: $23.00.

Forex Trading
Original price was: $499.00.$15.00Current price is: $15.00.
Forex Trading
Original price was: $4,997.00.$27.00Current price is: $27.00.
Original price was: $1,800.00.$54.00Current price is: $54.00.

Original price was: $4,995.00.$15.00Current price is: $15.00.
Forex Trading
Original price was: $797.00.$10.00Current price is: $10.00.

Original price was: $1,200.00.$23.00Current price is: $23.00.
Forex Trading
Original price was: $397.00.$31.00Current price is: $31.00.

Forex Trading
Original price was: $697.00.$5.00Current price is: $5.00.

Reviews
There are no reviews yet.