-
×
 The Orderflows Trade Opportunities Encyclopedia with Michael Valtos
1 × $8.00
The Orderflows Trade Opportunities Encyclopedia with Michael Valtos
1 × $8.00 -
×
 Forecast 2024 Clarification with Larry Williams
1 × $15.00
Forecast 2024 Clarification with Larry Williams
1 × $15.00 -
×
 M3-4u Trading System with John Locke
1 × $5.00
M3-4u Trading System with John Locke
1 × $5.00 -
×
 The Trading Blueprint with Brad Goh - The Trading Geek
1 × $5.00
The Trading Blueprint with Brad Goh - The Trading Geek
1 × $5.00 -
×
 Deep Dive Butterfly Trading Strategy Class with SJG Trades
1 × $41.00
Deep Dive Butterfly Trading Strategy Class with SJG Trades
1 × $41.00 -
×
 WondaFX Signature Strategy with WondaFX
1 × $5.00
WondaFX Signature Strategy with WondaFX
1 × $5.00 -
×
 Hedge Fund Trading Systems with Trading Tuitions
1 × $5.00
Hedge Fund Trading Systems with Trading Tuitions
1 × $5.00 -
×
 Derivates with Philip McBride Johnson
1 × $6.00
Derivates with Philip McBride Johnson
1 × $6.00 -
×
 With All Odds Forex System I & II with Barry Thornton
1 × $6.00
With All Odds Forex System I & II with Barry Thornton
1 × $6.00 -
×
 Best of the Best: Collars with Amy Meissner & Scott Ruble
1 × $15.00
Best of the Best: Collars with Amy Meissner & Scott Ruble
1 × $15.00 -
×
 Smart Money with Chart Engineers
1 × $7.00
Smart Money with Chart Engineers
1 × $7.00 -
×
 Mechanics of Trading Module
1 × $6.00
Mechanics of Trading Module
1 × $6.00 -
×
 Ocean’s CPA Force (Ebook)
1 × $6.00
Ocean’s CPA Force (Ebook)
1 × $6.00 -
×
 Basic Astrotech
1 × $6.00
Basic Astrotech
1 × $6.00 -
×
 Compass Trading System with Right Line Trading
1 × $39.00
Compass Trading System with Right Line Trading
1 × $39.00 -
×
 Intermediate Weekly Calendars
1 × $4.00
Intermediate Weekly Calendars
1 × $4.00 -
×
 Advanced Elliott Wave Analysis : Complex Patterns, Intermarket Relationships, and Global Cash Flow Analysis
1 × $6.00
Advanced Elliott Wave Analysis : Complex Patterns, Intermarket Relationships, and Global Cash Flow Analysis
1 × $6.00 -
×
 Butterfly and Condor Workshop with Aeromir
1 × $15.00
Butterfly and Condor Workshop with Aeromir
1 × $15.00 -
×
 W. D Gann 's Square Of 9 Applied To Modern Markets with Sean Avidar - Hexatrade350
1 × $23.00
W. D Gann 's Square Of 9 Applied To Modern Markets with Sean Avidar - Hexatrade350
1 × $23.00 -
×
 Trading Short TermSame Day Trades Sep 2023 with Dan Sheridan & Mark Fenton - Sheridan Options Mentoring
1 × $31.00
Trading Short TermSame Day Trades Sep 2023 with Dan Sheridan & Mark Fenton - Sheridan Options Mentoring
1 × $31.00 -
×
 Mastering Level 2 with ClayTrader
1 × $197.00
Mastering Level 2 with ClayTrader
1 × $197.00 -
×
 Schooloftrade - SOT Beginners Course (May 2014)
1 × $23.00
Schooloftrade - SOT Beginners Course (May 2014)
1 × $23.00 -
×
 Market Consistency: Model Calibration in Imperfect Markets with Malcolm Kemp
1 × $6.00
Market Consistency: Model Calibration in Imperfect Markets with Malcolm Kemp
1 × $6.00 -
×
 The Best Option Trading Course with David Jaffee - Best Stock Strategy
1 × $15.00
The Best Option Trading Course with David Jaffee - Best Stock Strategy
1 × $15.00 -
×
 The A14 Weekly Option Strategy Workshop with Amy Meissner
1 × $23.00
The A14 Weekly Option Strategy Workshop with Amy Meissner
1 × $23.00 -
×
 ICT Prodigy Trading Course – $650K in Payouts with Alex Solignani
1 × $15.00
ICT Prodigy Trading Course – $650K in Payouts with Alex Solignani
1 × $15.00 -
×
 0 DTE Options Trading Workshop with Aeromir Corporation
1 × $15.00
0 DTE Options Trading Workshop with Aeromir Corporation
1 × $15.00 -
×
 The Complete Guide to Multiple Time Frame Analysis & Reading Price Action with Aiman Almansoori
1 × $13.00
The Complete Guide to Multiple Time Frame Analysis & Reading Price Action with Aiman Almansoori
1 × $13.00 -
×
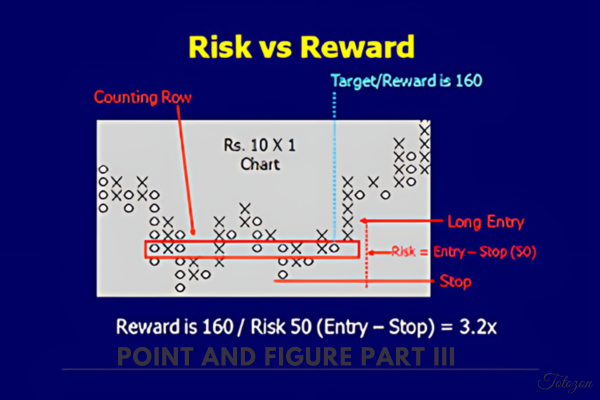 Point And Figure Part III By Bruce Fraser & Roman Bogomazov - Wyckoff Analytics
1 × $23.00
Point And Figure Part III By Bruce Fraser & Roman Bogomazov - Wyckoff Analytics
1 × $23.00 -
×
 Advanced Daytrading Seminar with Ken Calhoun
1 × $155.00
Advanced Daytrading Seminar with Ken Calhoun
1 × $155.00 -
×
 Advanced Spread Trading with Guy Bower - MasterClass Trader
1 × $15.00
Advanced Spread Trading with Guy Bower - MasterClass Trader
1 × $15.00 -
×
 Essentials in Quantitative Trading QT01 By HangukQuant's
1 × $23.00
Essentials in Quantitative Trading QT01 By HangukQuant's
1 × $23.00 -
×
 Crypto Trading Academy with Cheeky Investor - Aussie Day Trader
1 × $13.00
Crypto Trading Academy with Cheeky Investor - Aussie Day Trader
1 × $13.00 -
×
 Volume Profile Trading Strategy with Critical Trading
1 × $15.00
Volume Profile Trading Strategy with Critical Trading
1 × $15.00 -
×
 Quantamentals - The Next Great Forefront Of Trading and Investing with Trading Markets
1 × $8.00
Quantamentals - The Next Great Forefront Of Trading and Investing with Trading Markets
1 × $8.00 -
×
 The Price Action Manual, 2nd Ed 2008 with Bryce Gilmore
1 × $4.00
The Price Action Manual, 2nd Ed 2008 with Bryce Gilmore
1 × $4.00 -
×
 Bond Market Course with The Macro Compass
1 × $15.00
Bond Market Course with The Macro Compass
1 × $15.00 -
×
 Ultimate Trading Course with Dodgy's Dungeon
1 × $8.00
Ultimate Trading Course with Dodgy's Dungeon
1 × $8.00 -
×
 Raghee Horner's Workspace Bundle + Live Trading By Raghee Horner - Simpler Trading
1 × $23.00
Raghee Horner's Workspace Bundle + Live Trading By Raghee Horner - Simpler Trading
1 × $23.00 -
×
 Main Online Course with Cue Banks
1 × $90.00
Main Online Course with Cue Banks
1 × $90.00 -
×
 Macro to Micro Volatility Trading with Mark Whistler
1 × $5.00
Macro to Micro Volatility Trading with Mark Whistler
1 × $5.00 -
×
 60 Minute Trader with Chris Kobewka
1 × $6.00
60 Minute Trader with Chris Kobewka
1 × $6.00 -
×
 SQX Mentorship with Tip Toe Hippo
1 × $23.00
SQX Mentorship with Tip Toe Hippo
1 × $23.00 -
×
 WealthFRX Trading Mastery Course 2.0
1 × $5.00
WealthFRX Trading Mastery Course 2.0
1 × $5.00 -
×
 KojoForex Goat Strategy with Kojo Forex Academy
1 × $20.00
KojoForex Goat Strategy with Kojo Forex Academy
1 × $20.00 -
×
 Scanning for Gold with Doug Sutton
1 × $31.00
Scanning for Gold with Doug Sutton
1 × $31.00 -
×
 Road Congestion Pricing in Europe: Implications for the United States with Harry Richardson & Chang-Hee Christine Bae
1 × $6.00
Road Congestion Pricing in Europe: Implications for the United States with Harry Richardson & Chang-Hee Christine Bae
1 × $6.00 -
×
 Crypto Trading Academy with Cheeky Investor - Aussie Day Trader
1 × $13.00
Crypto Trading Academy with Cheeky Investor - Aussie Day Trader
1 × $13.00 -
×
 Boiler Room Trading
1 × $15.00
Boiler Room Trading
1 × $15.00 -
×
 BTC Market Profile
1 × $34.00
BTC Market Profile
1 × $34.00 -
×
 Winning with Options with Michael Thomsett
1 × $6.00
Winning with Options with Michael Thomsett
1 × $6.00 -
×
 Power Income FUTURES Day Trading Course with Trade Out Loud
1 × $31.00
Power Income FUTURES Day Trading Course with Trade Out Loud
1 × $31.00 -
×
 Crystal Ball Pack PLUS bonus Live Trade By Pat Mitchell - Trick Trades
1 × $20.00
Crystal Ball Pack PLUS bonus Live Trade By Pat Mitchell - Trick Trades
1 × $20.00 -
×
 $20 – 52k 20 pips a day challange with Rafał Zuchowicz - TopMasterTrader
1 × $5.00
$20 – 52k 20 pips a day challange with Rafał Zuchowicz - TopMasterTrader
1 × $5.00 -
×
 Price Action Forex Trading Strategies Training Course & Members Videos with Nial Fuller
1 × $28.00
Price Action Forex Trading Strategies Training Course & Members Videos with Nial Fuller
1 × $28.00 -
×
 How To Trade Like a Pro, Not a Hobby with Jason Bond
1 × $62.00
How To Trade Like a Pro, Not a Hobby with Jason Bond
1 × $62.00 -
×
 Option Buying Course
1 × $5.00
Option Buying Course
1 × $5.00 -
×
 Options Plain & Simple with Lenni Jordan
1 × $6.00
Options Plain & Simple with Lenni Jordan
1 × $6.00 -
×
 Gann Wheel 1.2.15 (globalviewtech.com)
1 × $6.00
Gann Wheel 1.2.15 (globalviewtech.com)
1 × $6.00 -
×
 Kaizen Pipsology: Forex Mentorship
1 × $8.00
Kaizen Pipsology: Forex Mentorship
1 × $8.00 -
×
 Market Making Scalping Manual with Gary Norden - Jigsaw Trading
1 × $69.00
Market Making Scalping Manual with Gary Norden - Jigsaw Trading
1 × $69.00 -
×
 FX Masterclass 2.0 with Uprise Academy
1 × $26.00
FX Masterclass 2.0 with Uprise Academy
1 × $26.00 -
×
 Trading The Connors Windows Strategy with Larry Connors
1 × $6.00
Trading The Connors Windows Strategy with Larry Connors
1 × $6.00 -
×
 Trading Order Power Strategies
1 × $6.00
Trading Order Power Strategies
1 × $6.00 -
×
 FTMO Academy Course
1 × $5.00
FTMO Academy Course
1 × $5.00 -
×
 Use The Moon – A Trading System with MARKET OCCULTATIONS
1 × $27.00
Use The Moon – A Trading System with MARKET OCCULTATIONS
1 × $27.00 -
×
 Forex Trading: Comprehensive & Concise Forex Trading Course with Luciano Kelly & Learn Forex Mentor
1 × $6.00
Forex Trading: Comprehensive & Concise Forex Trading Course with Luciano Kelly & Learn Forex Mentor
1 × $6.00 -
×
 Algo Trading Masterclass with Ali Casey - StatOasis
1 × $23.00
Algo Trading Masterclass with Ali Casey - StatOasis
1 × $23.00 -
×
 James Dalton Mind Over Markets Expanded Intensive Series 2018
1 × $6.00
James Dalton Mind Over Markets Expanded Intensive Series 2018
1 × $6.00 -
×
 War Room Technicals Vol 1 with Trick Traders
1 × $6.00
War Room Technicals Vol 1 with Trick Traders
1 × $6.00 -
×
 Strategy Class + Indicators
1 × $31.00
Strategy Class + Indicators
1 × $31.00 -
×
 Sovereign Man Global Offshore and Investment Masterclass
1 × $15.00
Sovereign Man Global Offshore and Investment Masterclass
1 × $15.00 -
×
 Wifxa - INSTITUTIONAL SCALPING
1 × $23.00
Wifxa - INSTITUTIONAL SCALPING
1 × $23.00 -
×
 The Four Biggest Mistakes in Futures Trading (1st Edition) with Jay Kaeppel
1 × $6.00
The Four Biggest Mistakes in Futures Trading (1st Edition) with Jay Kaeppel
1 × $6.00 -
×
 Order flow self-study training program with iMFtracker
1 × $10.00
Order flow self-study training program with iMFtracker
1 × $10.00 -
×
 Trading Weekly Options for Income in 2016 with Dan Sheridan
1 × $23.00
Trading Weekly Options for Income in 2016 with Dan Sheridan
1 × $23.00

TTM Slingshot & Value Charts Indicators
$6.00
File Size: Coming soon!
Delivery Time: 1–12 hours
Media Type: Online Course
TTM Slingshot & Value Charts Indicators
Introduction to TTM Slingshot & Value Charts
In the dynamic world of trading, having the right tools can make all the difference. Two such powerful tools are the TTM Slingshot and Value Charts Indicators. These indicators provide traders with crucial insights, helping them navigate market complexities and make informed decisions.
Understanding TTM Slingshot
What is TTM Slingshot?
The TTM Slingshot is an advanced trading indicator developed by John Carter. It combines multiple moving averages to identify potential breakout points in the market. By analyzing the relationship between these moving averages, the TTM Slingshot helps traders spot opportunities for entering or exiting trades.
Key Features of TTM Slingshot
- Multiple Moving Averages: Uses short-term and long-term moving averages.
- Breakout Identification: Detects potential breakout points.
- Versatility: Applicable across various markets and timeframes.
Benefits of Using TTM Slingshot
Enhanced Market Analysis
The TTM Slingshot provides a detailed analysis of market trends, allowing traders to anticipate significant price movements. This indicator’s ability to pinpoint breakout points is invaluable for making timely trading decisions.
Improved Trading Accuracy
By combining multiple moving averages, the TTM Slingshot offers a comprehensive view of the market. This integration reduces noise and enhances the accuracy of predictions, leading to more successful trades.
Setting Up TTM Slingshot
Choosing the Right Platform
To utilize the TTM Slingshot, you’ll need a trading platform that supports custom indicators. Platforms like Thinkorswim and TradeStation are popular choices among traders.
Installing the Indicator
- Download the Indicator: Obtain the TTM Slingshot file compatible with your trading platform.
- Open Your Platform: Launch the trading platform.
- Add the Indicator: Navigate to the ‘Indicators’ section and add the TTM Slingshot file.
- Customize Settings: Adjust the settings to align with your trading strategy.
Understanding Value Charts Indicators
What are Value Charts Indicators?
Value Charts Indicators are tools that measure the relative value of a security based on its price history. These indicators help traders determine whether a security is overvalued, undervalued, or fairly valued, providing a clear picture of potential trading opportunities.
Key Features of Value Charts Indicators
- Relative Value Measurement: Assesses the value of a security.
- Overbought/Oversold Conditions: Identifies extreme market conditions.
- Visual Representation: Displays value levels on a chart for easy interpretation.
Benefits of Using Value Charts Indicators
Identifying Market Extremes
Value Charts Indicators are excellent for spotting overbought and oversold conditions. By identifying these extremes, traders can make strategic decisions about entering or exiting positions.
Enhancing Risk Management
These indicators aid in risk management by providing insights into the relative value of a security. Traders can use this information to set stop-loss levels and protect their investments.
Setting Up Value Charts Indicators
Selecting the Appropriate Platform
Choose a trading platform that supports Value Charts Indicators. Many modern trading platforms, such as NinjaTrader and MetaTrader, offer these indicators.
Installing the Indicator
- Download the Indicator: Obtain the Value Charts Indicator file for your platform.
- Open Your Platform: Start the trading platform.
- Add the Indicator: Go to the ‘Indicators’ section and add the Value Charts file.
- Configure Settings: Customize the settings to fit your trading approach.
How to Use TTM Slingshot & Value Charts Together
Combining Indicators for Better Insights
Using TTM Slingshot and Value Charts Indicators together can enhance your market analysis. While TTM Slingshot identifies breakout points, Value Charts Indicators help assess the relative value of the security, providing a more comprehensive view.
Practical Application
- Entry Points: Use TTM Slingshot to identify breakout points and confirm with Value Charts Indicators to ensure the security is not overvalued.
- Exit Points: Value Charts Indicators can signal overbought conditions, indicating a good time to exit, while TTM Slingshot confirms the end of a trend.
Advanced Strategies with TTM Slingshot & Value Charts
Pairing with Other Indicators
For even more robust analysis, pair TTM Slingshot and Value Charts Indicators with other tools such as RSI (Relative Strength Index) and MACD (Moving Average Convergence Divergence).
Developing a Trading Plan
Create a detailed trading plan that incorporates these indicators. Define your entry and exit points, risk management strategies, and the specific market conditions you’re targeting.
Real-Life Examples
Successful Trade Case Study
Consider a scenario where the TTM Slingshot indicates a breakout, and Value Charts Indicators show the security is undervalued. Entering a trade at this point could lead to significant profits as the price moves to its fair value.
Learning from Mistakes
Analyze trades where the indicators did not predict the expected outcome. Understanding these failures can help refine your strategy and improve future performance.
Conclusion
Maximizing Your Trading Success
The TTM Slingshot and Value Charts Indicators are powerful tools that, when used together, can significantly enhance your trading strategy. By providing insights into market trends and relative value, these indicators help you make more informed decisions.
Taking the Next Step
Start by setting up these indicators on your trading platform. Practice interpreting the signals and integrating them into your trading strategy to see the benefits firsthand.

FAQs
What is the TTM Slingshot indicator?
The TTM Slingshot is a trading tool that uses multiple moving averages to identify breakout points in the market.
How do Value Charts Indicators work?
Value Charts Indicators measure the relative value of a security, helping traders identify overbought and oversold conditions.
Can these indicators be used together?
Yes, combining TTM Slingshot and Value Charts Indicators provides a comprehensive analysis of market trends and security value.
Which platforms support these indicators?
Platforms like Thinkorswim, TradeStation, NinjaTrader, and MetaTrader support TTM Slingshot and Value Charts Indicators.
How do I install these indicators?
Download the respective indicator files, open your trading platform, and add the indicators through the ‘Indicators’ section.
Be the first to review “TTM Slingshot & Value Charts Indicators”
You must be logged in to post a review.
Related products
Forex Trading
Original price was: $1,898.00.$10.00Current price is: $10.00.
Forex Trading
Original price was: $249.00.$15.00Current price is: $15.00.
Forex Trading
Quantamentals – The Next Great Forefront Of Trading and Investing with Trading Markets
Original price was: $1,495.00.$8.00Current price is: $8.00.
Forex Trading
Original price was: $850.00.$23.00Current price is: $23.00.
Original price was: $197.00.$5.00Current price is: $5.00.

Original price was: $497.00.$11.00Current price is: $11.00.
Forex Trading
Original price was: $550.00.$5.00Current price is: $5.00.
Original price was: $139.00.$23.00Current price is: $23.00.
Original price was: $1,849.00.$15.00Current price is: $15.00.
Forex Trading
Original price was: $697.00.$5.00Current price is: $5.00.
Forex Trading
Original price was: $799.00.$15.00Current price is: $15.00.

Forex Trading
Original price was: $125.00.$17.00Current price is: $17.00.

Original price was: $450.00.$23.00Current price is: $23.00.
Original price was: $895.00.$15.00Current price is: $15.00.

Original price was: $997.00.$8.00Current price is: $8.00.
Original price was: $310.00.$23.00Current price is: $23.00.
Forex Trading
Original price was: $1,098.00.$39.00Current price is: $39.00.
Forex Trading
Original price was: $999.00.$15.00Current price is: $15.00.
Original price was: $2,120.00.$15.00Current price is: $15.00.

Original price was: $4,995.00.$15.00Current price is: $15.00.

Reviews
There are no reviews yet.