-
×
 Best of the Best: Collars with Amy Meissner & Scott Ruble
1 × $15.00
Best of the Best: Collars with Amy Meissner & Scott Ruble
1 × $15.00 -
×
 Winning System For Trading High-Performance Stocks with Tim Cho
1 × $6.00
Winning System For Trading High-Performance Stocks with Tim Cho
1 × $6.00 -
×
 Evolved Traders with Riley Coleman
1 × $5.00
Evolved Traders with Riley Coleman
1 × $5.00 -
×
 Zm Capitals Full course + Ebook with Zain Mokhles - ZmCapitals
1 × $31.00
Zm Capitals Full course + Ebook with Zain Mokhles - ZmCapitals
1 × $31.00 -
×
 Dan Sheridan Butterfly Course + Iron Condor Class Bundle Pack
1 × $23.00
Dan Sheridan Butterfly Course + Iron Condor Class Bundle Pack
1 × $23.00 -
×
 LT Pulse and LT Trend/Ultra
1 × $23.00
LT Pulse and LT Trend/Ultra
1 × $23.00 -
×
 Ichimoku Traders Academy with Tyler Espitia
1 × $31.00
Ichimoku Traders Academy with Tyler Espitia
1 × $31.00 -
×
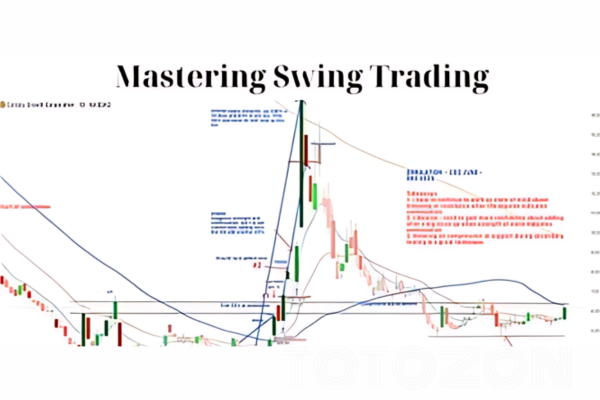 MASTERING SWING TRADING May 2024 with Roman Bogomazov
1 × $194.00
MASTERING SWING TRADING May 2024 with Roman Bogomazov
1 × $194.00 -
×
 ICinDER V2 Cycle Analysis and TrendGuide Pack and Bloodhound Ultimate (May 2015)
1 × $31.00
ICinDER V2 Cycle Analysis and TrendGuide Pack and Bloodhound Ultimate (May 2015)
1 × $31.00 -
×
 Quantifiable Edges Swing Trading Course with Quantifiable Edges
1 × $15.00
Quantifiable Edges Swing Trading Course with Quantifiable Edges
1 × $15.00 -
×
 A- Z Educational Trading Course with InvestiTrade
1 × $39.00
A- Z Educational Trading Course with InvestiTrade
1 × $39.00 -
×
 Advanced Spread Trading with Guy Bower - MasterClass Trader
1 × $15.00
Advanced Spread Trading with Guy Bower - MasterClass Trader
1 × $15.00 -
×
 Robotic Trading: Skill Sharpening with Claytrader
1 × $23.00
Robotic Trading: Skill Sharpening with Claytrader
1 × $23.00 -
×
 Options Trading & Ultimate MasterClass With Tyrone Abela - FX Evolution
1 × $54.00
Options Trading & Ultimate MasterClass With Tyrone Abela - FX Evolution
1 × $54.00 -
×
 Butterfly and Condor Workshop with Aeromir
1 × $15.00
Butterfly and Condor Workshop with Aeromir
1 × $15.00 -
×
 Options Masterclass with WallStreet Trapper
1 × $13.00
Options Masterclass with WallStreet Trapper
1 × $13.00 -
×
 B.O.S.S. Carbon with Pat Mitchell – Trick Trades
1 × $8.00
B.O.S.S. Carbon with Pat Mitchell – Trick Trades
1 × $8.00 -
×
 Practical Speculation with Victor Niederhoffer, Laurel Kenner
1 × $6.00
Practical Speculation with Victor Niederhoffer, Laurel Kenner
1 × $6.00 -
×
 TradeCraft: Your Path to Peak Performance Trading By Adam Grimes
1 × $15.00
TradeCraft: Your Path to Peak Performance Trading By Adam Grimes
1 × $15.00 -
×
 Top 20 SP500 Trading Strategies Course with Larry Connors
1 × $23.00
Top 20 SP500 Trading Strategies Course with Larry Connors
1 × $23.00 -
×
 VSA Advanced Mentorship Course
1 × $31.00
VSA Advanced Mentorship Course
1 × $31.00 -
×
 Forex Fortune Factory with Nehemiah Douglass & Cottrell Phillip
1 × $5.00
Forex Fortune Factory with Nehemiah Douglass & Cottrell Phillip
1 × $5.00 -
×
 Trading Strategies with Ambush and Stealth Combined - Joe Ross
1 × $311.00
Trading Strategies with Ambush and Stealth Combined - Joe Ross
1 × $311.00 -
×
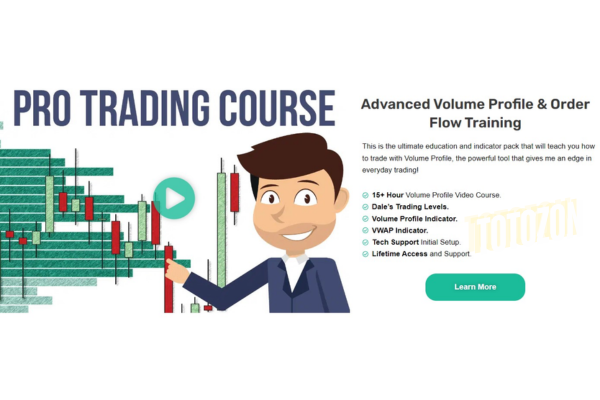 Advanced Volume Profile + Order Flow Video Course with Trader Dale
1 × $13.00
Advanced Volume Profile + Order Flow Video Course with Trader Dale
1 × $13.00 -
×
 Month 01 to 08 2018
1 × $62.00
Month 01 to 08 2018
1 × $62.00 -
×
 Objective Evaluation of Indicators with Constance Brown
1 × $6.00
Objective Evaluation of Indicators with Constance Brown
1 × $6.00 -
×
 Market Evolution
1 × $6.00
Market Evolution
1 × $6.00 -
×
 Algo Trading Masterclass with Ali Casey - StatOasis
1 × $23.00
Algo Trading Masterclass with Ali Casey - StatOasis
1 × $23.00 -
×
 Construct & Trade a High Probability Trading System with John L.Person
1 × $6.00
Construct & Trade a High Probability Trading System with John L.Person
1 × $6.00 -
×
 ChangeWave Investing 2.0 with Tobin Smith
1 × $6.00
ChangeWave Investing 2.0 with Tobin Smith
1 × $6.00 -
×
 Jimdandym Ql4 Courses
1 × $15.00
Jimdandym Ql4 Courses
1 × $15.00 -
×
 Price Action Trading Volume 2 with Fractal Flow Pro
1 × $6.00
Price Action Trading Volume 2 with Fractal Flow Pro
1 × $6.00 -
×
 Learn to Trade Course with Mike Aston
1 × $6.00
Learn to Trade Course with Mike Aston
1 × $6.00 -
×
 Trading to Win with Ari Kiev
1 × $6.00
Trading to Win with Ari Kiev
1 × $6.00 -
×
 MACK - PATS Simple ES Scalping Strategy
1 × $15.00
MACK - PATS Simple ES Scalping Strategy
1 × $15.00 -
×
 High Probability Trading Using Elliott Wave And Fibonacci Analysis withVic Patel - Forex Training Group
1 × $10.00
High Probability Trading Using Elliott Wave And Fibonacci Analysis withVic Patel - Forex Training Group
1 × $10.00 -
×
 Scalpathon by Trading Research Group
1 × $23.00
Scalpathon by Trading Research Group
1 × $23.00 -
×
 Trading Online
1 × $6.00
Trading Online
1 × $6.00 -
×
 Market Trader Forecasting Modeling Course
1 × $6.00
Market Trader Forecasting Modeling Course
1 × $6.00 -
×
 Radioactive Trading Mastery Course
1 × $6.00
Radioactive Trading Mastery Course
1 × $6.00 -
×
 Into The Abbys with Black Rabbit
1 × $18.00
Into The Abbys with Black Rabbit
1 × $18.00 -
×
 Advanced Get 12.0.3485 x86 (August 2014) (+ open code efs, dll's) for Any eSignal Account
1 × $23.00
Advanced Get 12.0.3485 x86 (August 2014) (+ open code efs, dll's) for Any eSignal Account
1 × $23.00 -
×
 BTC Market Profile
1 × $34.00
BTC Market Profile
1 × $34.00 -
×
 Ultimate Trading Course with Dodgy's Dungeon
1 × $8.00
Ultimate Trading Course with Dodgy's Dungeon
1 × $8.00 -
×
 FX GOAT CURRENCIES COURSE 2.0
1 × $13.00
FX GOAT CURRENCIES COURSE 2.0
1 × $13.00 -
×
 The Best Option Trading Course with David Jaffee - Best Stock Strategy
1 × $15.00
The Best Option Trading Course with David Jaffee - Best Stock Strategy
1 × $15.00 -
×
 Tradeguider Mentorship Collection
1 × $54.00
Tradeguider Mentorship Collection
1 × $54.00 -
×
 One Shot One Kill Trading with John Netto
1 × $6.00
One Shot One Kill Trading with John Netto
1 × $6.00 -
×
 Master Class: Income Trading with Option Pit
1 × $101.00
Master Class: Income Trading with Option Pit
1 × $101.00 -
×
 Perfect Strategy - SPX Daily Options Income with Peter Titus - Marwood Research
1 × $15.00
Perfect Strategy - SPX Daily Options Income with Peter Titus - Marwood Research
1 × $15.00 -
×
 Profitable Binary Options Strategies
1 × $5.00
Profitable Binary Options Strategies
1 × $5.00 -
×
 Judgemental Trend Following (Audio) with Russell Sands
1 × $6.00
Judgemental Trend Following (Audio) with Russell Sands
1 × $6.00 -
×
 Fish Forex Robot 4G
1 × $6.00
Fish Forex Robot 4G
1 × $6.00 -
×
 Mechanical Timing Systems. The Key to Consistent Profits & Sharper Trading with Nelson Freeburg
1 × $6.00
Mechanical Timing Systems. The Key to Consistent Profits & Sharper Trading with Nelson Freeburg
1 × $6.00 -
×
 Hot Trading Investing Strategy: ETF and Futures with QSB Funds
1 × $6.00
Hot Trading Investing Strategy: ETF and Futures with QSB Funds
1 × $6.00 -
×
 Scalp Strategy and Flipping Small Accounts with Opes Trading Group
1 × $5.00
Scalp Strategy and Flipping Small Accounts with Opes Trading Group
1 × $5.00 -
×
 Intermediate to Advanced Intensive Q and A with Rob Hoffman
1 × $6.00
Intermediate to Advanced Intensive Q and A with Rob Hoffman
1 × $6.00 -
×
 Mastering the Gaps - Trading Gaps
1 × $15.00
Mastering the Gaps - Trading Gaps
1 × $15.00 -
×
 War Room Psychology Vol. 4 with Pat Mitchell – Trick Trades
1 × $23.00
War Room Psychology Vol. 4 with Pat Mitchell – Trick Trades
1 × $23.00 -
×
 Get Rich with Dividends
1 × $6.00
Get Rich with Dividends
1 × $6.00 -
×
 Volatility Trading with Euan Sinclair
1 × $6.00
Volatility Trading with Euan Sinclair
1 × $6.00 -
×
 TOP Momentum Bundle with Top Trade Tools
1 × $62.00
TOP Momentum Bundle with Top Trade Tools
1 × $62.00 -
×
 AI For Traders with Trading Markets
1 × $31.00
AI For Traders with Trading Markets
1 × $31.00 -
×
 Perfecting Execution and Trade Management Online Masterclass with The Trading Framework
1 × $6.00
Perfecting Execution and Trade Management Online Masterclass with The Trading Framework
1 × $6.00 -
×
 Your Next Great Stock: How to Screen the Market for Tomorrow's Top Performers with Jack Hough
1 × $6.00
Your Next Great Stock: How to Screen the Market for Tomorrow's Top Performers with Jack Hough
1 × $6.00 -
×
 W. D Gann 's Square Of 9 Applied To Modern Markets with Sean Avidar - Hexatrade350
1 × $23.00
W. D Gann 's Square Of 9 Applied To Modern Markets with Sean Avidar - Hexatrade350
1 × $23.00 -
×
 Beginner's Forex Course with Jossenia Pomare
1 × $60.00
Beginner's Forex Course with Jossenia Pomare
1 × $60.00 -
×
 Compass Trading System with Right Line Trading
1 × $39.00
Compass Trading System with Right Line Trading
1 × $39.00 -
×
 SQX Mentorship with Tip Toe Hippo
1 × $23.00
SQX Mentorship with Tip Toe Hippo
1 × $23.00 -
×
 The Indices Orderflow Masterclass with The Forex Scalpers
1 × $23.00
The Indices Orderflow Masterclass with The Forex Scalpers
1 × $23.00 -
×
 Risk Free Projections Course
1 × $85.00
Risk Free Projections Course
1 × $85.00 -
×
 Footprint Deep Dive
1 × $15.00
Footprint Deep Dive
1 × $15.00 -
×
 Quantamentals - The Next Great Forefront Of Trading and Investing with Trading Markets
1 × $8.00
Quantamentals - The Next Great Forefront Of Trading and Investing with Trading Markets
1 × $8.00 -
×
 Neowave. Taking Elliott Wave into the 21st Century with Glenn Neely
1 × $6.00
Neowave. Taking Elliott Wave into the 21st Century with Glenn Neely
1 × $6.00 -
×
 Adz Trading Academy
1 × $5.00
Adz Trading Academy
1 × $5.00 -
×
 The A14 Weekly Option Strategy Workshop with Amy Meissner
1 × $23.00
The A14 Weekly Option Strategy Workshop with Amy Meissner
1 × $23.00

TTM Slingshot & Value Charts Indicators
$6.00
File Size: Coming soon!
Delivery Time: 1–12 hours
Media Type: Online Course
TTM Slingshot & Value Charts Indicators
Introduction to TTM Slingshot & Value Charts
In the dynamic world of trading, having the right tools can make all the difference. Two such powerful tools are the TTM Slingshot and Value Charts Indicators. These indicators provide traders with crucial insights, helping them navigate market complexities and make informed decisions.
Understanding TTM Slingshot
What is TTM Slingshot?
The TTM Slingshot is an advanced trading indicator developed by John Carter. It combines multiple moving averages to identify potential breakout points in the market. By analyzing the relationship between these moving averages, the TTM Slingshot helps traders spot opportunities for entering or exiting trades.
Key Features of TTM Slingshot
- Multiple Moving Averages: Uses short-term and long-term moving averages.
- Breakout Identification: Detects potential breakout points.
- Versatility: Applicable across various markets and timeframes.
Benefits of Using TTM Slingshot
Enhanced Market Analysis
The TTM Slingshot provides a detailed analysis of market trends, allowing traders to anticipate significant price movements. This indicator’s ability to pinpoint breakout points is invaluable for making timely trading decisions.
Improved Trading Accuracy
By combining multiple moving averages, the TTM Slingshot offers a comprehensive view of the market. This integration reduces noise and enhances the accuracy of predictions, leading to more successful trades.
Setting Up TTM Slingshot
Choosing the Right Platform
To utilize the TTM Slingshot, you’ll need a trading platform that supports custom indicators. Platforms like Thinkorswim and TradeStation are popular choices among traders.
Installing the Indicator
- Download the Indicator: Obtain the TTM Slingshot file compatible with your trading platform.
- Open Your Platform: Launch the trading platform.
- Add the Indicator: Navigate to the ‘Indicators’ section and add the TTM Slingshot file.
- Customize Settings: Adjust the settings to align with your trading strategy.
Understanding Value Charts Indicators
What are Value Charts Indicators?
Value Charts Indicators are tools that measure the relative value of a security based on its price history. These indicators help traders determine whether a security is overvalued, undervalued, or fairly valued, providing a clear picture of potential trading opportunities.
Key Features of Value Charts Indicators
- Relative Value Measurement: Assesses the value of a security.
- Overbought/Oversold Conditions: Identifies extreme market conditions.
- Visual Representation: Displays value levels on a chart for easy interpretation.
Benefits of Using Value Charts Indicators
Identifying Market Extremes
Value Charts Indicators are excellent for spotting overbought and oversold conditions. By identifying these extremes, traders can make strategic decisions about entering or exiting positions.
Enhancing Risk Management
These indicators aid in risk management by providing insights into the relative value of a security. Traders can use this information to set stop-loss levels and protect their investments.
Setting Up Value Charts Indicators
Selecting the Appropriate Platform
Choose a trading platform that supports Value Charts Indicators. Many modern trading platforms, such as NinjaTrader and MetaTrader, offer these indicators.
Installing the Indicator
- Download the Indicator: Obtain the Value Charts Indicator file for your platform.
- Open Your Platform: Start the trading platform.
- Add the Indicator: Go to the ‘Indicators’ section and add the Value Charts file.
- Configure Settings: Customize the settings to fit your trading approach.
How to Use TTM Slingshot & Value Charts Together
Combining Indicators for Better Insights
Using TTM Slingshot and Value Charts Indicators together can enhance your market analysis. While TTM Slingshot identifies breakout points, Value Charts Indicators help assess the relative value of the security, providing a more comprehensive view.
Practical Application
- Entry Points: Use TTM Slingshot to identify breakout points and confirm with Value Charts Indicators to ensure the security is not overvalued.
- Exit Points: Value Charts Indicators can signal overbought conditions, indicating a good time to exit, while TTM Slingshot confirms the end of a trend.
Advanced Strategies with TTM Slingshot & Value Charts
Pairing with Other Indicators
For even more robust analysis, pair TTM Slingshot and Value Charts Indicators with other tools such as RSI (Relative Strength Index) and MACD (Moving Average Convergence Divergence).
Developing a Trading Plan
Create a detailed trading plan that incorporates these indicators. Define your entry and exit points, risk management strategies, and the specific market conditions you’re targeting.
Real-Life Examples
Successful Trade Case Study
Consider a scenario where the TTM Slingshot indicates a breakout, and Value Charts Indicators show the security is undervalued. Entering a trade at this point could lead to significant profits as the price moves to its fair value.
Learning from Mistakes
Analyze trades where the indicators did not predict the expected outcome. Understanding these failures can help refine your strategy and improve future performance.
Conclusion
Maximizing Your Trading Success
The TTM Slingshot and Value Charts Indicators are powerful tools that, when used together, can significantly enhance your trading strategy. By providing insights into market trends and relative value, these indicators help you make more informed decisions.
Taking the Next Step
Start by setting up these indicators on your trading platform. Practice interpreting the signals and integrating them into your trading strategy to see the benefits firsthand.

FAQs
What is the TTM Slingshot indicator?
The TTM Slingshot is a trading tool that uses multiple moving averages to identify breakout points in the market.
How do Value Charts Indicators work?
Value Charts Indicators measure the relative value of a security, helping traders identify overbought and oversold conditions.
Can these indicators be used together?
Yes, combining TTM Slingshot and Value Charts Indicators provides a comprehensive analysis of market trends and security value.
Which platforms support these indicators?
Platforms like Thinkorswim, TradeStation, NinjaTrader, and MetaTrader support TTM Slingshot and Value Charts Indicators.
How do I install these indicators?
Download the respective indicator files, open your trading platform, and add the indicators through the ‘Indicators’ section.
Be the first to review “TTM Slingshot & Value Charts Indicators”
You must be logged in to post a review.
Related products

Original price was: $497.00.$31.00Current price is: $31.00.
Original price was: $799.00.$15.00Current price is: $15.00.
Original price was: $139.00.$23.00Current price is: $23.00.

Forex Trading
The Complete Guide to Multiple Time Frame Analysis & Reading Price Action with Aiman Almansoori
Original price was: $1,399.00.$13.00Current price is: $13.00.
Forex Trading
Original price was: $2,997.00.$23.00Current price is: $23.00.

Forex Trading
Original price was: $125.00.$17.00Current price is: $17.00.

Original price was: $497.00.$11.00Current price is: $11.00.

Forex Trading
Original price was: $850.00.$23.00Current price is: $23.00.

Forex Trading
Original price was: $697.00.$5.00Current price is: $5.00.
Forex Trading
Original price was: $799.00.$15.00Current price is: $15.00.

Original price was: $695.00.$41.00Current price is: $41.00.

Forex Trading
Original price was: $999.00.$15.00Current price is: $15.00.
Forex Trading
Original price was: $1,098.00.$39.00Current price is: $39.00.

Forex Trading
Original price was: $397.00.$31.00Current price is: $31.00.
Original price was: $450.00.$23.00Current price is: $23.00.
Forex Trading
Original price was: $2,995.00.$31.00Current price is: $31.00.

Original price was: $1,200.00.$23.00Current price is: $23.00.

Original price was: $997.00.$13.00Current price is: $13.00.

Original price was: $649.00.$20.00Current price is: $20.00.
Forex Trading
Quantamentals – The Next Great Forefront Of Trading and Investing with Trading Markets
Original price was: $1,495.00.$8.00Current price is: $8.00.

Reviews
There are no reviews yet.