-
×
 Butterfly and Condor Workshop with Aeromir
1 × $15.00
Butterfly and Condor Workshop with Aeromir
1 × $15.00 -
×
 The Unified Theory of Markets with Earik Beann
1 × $78.00
The Unified Theory of Markets with Earik Beann
1 × $78.00 -
×
 Trading Short TermSame Day Trades Sep 2023 with Dan Sheridan & Mark Fenton - Sheridan Options Mentoring
1 × $31.00
Trading Short TermSame Day Trades Sep 2023 with Dan Sheridan & Mark Fenton - Sheridan Options Mentoring
1 × $31.00 -
×
 W.O.W. Guaranteed Income with Chuck Hughes
1 × $31.00
W.O.W. Guaranteed Income with Chuck Hughes
1 × $31.00 -
×
 Home Run Options Trading Course with Dave Aquino - Base Camp Trading
1 × $11.00
Home Run Options Trading Course with Dave Aquino - Base Camp Trading
1 × $11.00 -
×
 Quantamentals - The Next Great Forefront Of Trading and Investing with Trading Markets
1 × $8.00
Quantamentals - The Next Great Forefront Of Trading and Investing with Trading Markets
1 × $8.00 -
×
 Advanced Spread Trading with Guy Bower - MasterClass Trader
1 × $15.00
Advanced Spread Trading with Guy Bower - MasterClass Trader
1 × $15.00 -
×
 TRADING NFX Course with Andrew NFX
1 × $5.00
TRADING NFX Course with Andrew NFX
1 × $5.00 -
×
 White Phoenix’s The Smart (Money) Approach to Trading with Jayson Casper
1 × $39.00
White Phoenix’s The Smart (Money) Approach to Trading with Jayson Casper
1 × $39.00 -
×
 How To Read The Market Professionally with TradeSmart
1 × $27.00
How To Read The Market Professionally with TradeSmart
1 × $27.00 -
×
 Ultimate Guide to Stock Investing
1 × $6.00
Ultimate Guide to Stock Investing
1 × $6.00 -
×
 The Trading Mastermind Forex Workshop 14 CDs with Scott Shubert
1 × $6.00
The Trading Mastermind Forex Workshop 14 CDs with Scott Shubert
1 × $6.00 -
×
 0 DTE Options Trading Workshop with Aeromir Corporation
1 × $15.00
0 DTE Options Trading Workshop with Aeromir Corporation
1 × $15.00 -
×
 The Naked Eye: Raw Data Analytics with Edgar Torres - Raw Data Analytics
1 × $8.00
The Naked Eye: Raw Data Analytics with Edgar Torres - Raw Data Analytics
1 × $8.00 -
×
 All About Technical Analysis with Constance Brown
1 × $6.00
All About Technical Analysis with Constance Brown
1 × $6.00 -
×
 Compass Trading System with Right Line Trading
1 × $39.00
Compass Trading System with Right Line Trading
1 × $39.00 -
×
 Crystal Ball Pack PLUS bonus Live Trade By Pat Mitchell - Trick Trades
1 × $20.00
Crystal Ball Pack PLUS bonus Live Trade By Pat Mitchell - Trick Trades
1 × $20.00 -
×
 The Prop Trading Code with Brannigan Barrett - Axia Futures
1 × $23.00
The Prop Trading Code with Brannigan Barrett - Axia Futures
1 × $23.00 -
×
 $20 – 52k 20 pips a day challange with Rafał Zuchowicz - TopMasterTrader
1 × $5.00
$20 – 52k 20 pips a day challange with Rafał Zuchowicz - TopMasterTrader
1 × $5.00 -
×
 Bond Market Course with The Macro Compass
1 × $15.00
Bond Market Course with The Macro Compass
1 × $15.00 -
×
 The A14 Weekly Option Strategy Workshop with Amy Meissner
1 × $23.00
The A14 Weekly Option Strategy Workshop with Amy Meissner
1 × $23.00 -
×
 Zen in the Markets with Edward Allen Toppel
1 × $6.00
Zen in the Markets with Edward Allen Toppel
1 × $6.00 -
×
 WickOrTreat Trading Course with WickOrTreat
1 × $6.00
WickOrTreat Trading Course with WickOrTreat
1 × $6.00 -
×
 Trampoline Trading with Claytrader
1 × $6.00
Trampoline Trading with Claytrader
1 × $6.00 -
×
 TradingWithBilz Course
1 × $10.00
TradingWithBilz Course
1 × $10.00 -
×
 Candlestick Charts with Clive Lambert
1 × $6.00
Candlestick Charts with Clive Lambert
1 × $6.00 -
×
 Compound Stock Earnings Advanced Charting (Video 1.19 GB)
1 × $15.00
Compound Stock Earnings Advanced Charting (Video 1.19 GB)
1 × $15.00 -
×
 XLT– Option Trading Course
1 × $6.00
XLT– Option Trading Course
1 × $6.00 -
×
 The Orderflows Trade Opportunities Encyclopedia with Michael Valtos
1 × $8.00
The Orderflows Trade Opportunities Encyclopedia with Michael Valtos
1 × $8.00 -
×
 Order flow self-study training program with iMFtracker
1 × $10.00
Order flow self-study training program with iMFtracker
1 × $10.00 -
×
 Deep Dive Butterfly Trading Strategy Class with SJG Trades
1 × $41.00
Deep Dive Butterfly Trading Strategy Class with SJG Trades
1 × $41.00 -
×
 Accelerated Learning Techniques in Action with Colin Rose, Jayne Nicholl & Malcolm Nicholl
1 × $6.00
Accelerated Learning Techniques in Action with Colin Rose, Jayne Nicholl & Malcolm Nicholl
1 × $6.00 -
×
 The Tickmaster Indicator with Alphashark
1 × $54.00
The Tickmaster Indicator with Alphashark
1 × $54.00 -
×
 The Orderflow Masterclass with PrimeTrading
1 × $17.00
The Orderflow Masterclass with PrimeTrading
1 × $17.00 -
×
 101 Option Trading Secrets with Kenneth Trester
1 × $6.00
101 Option Trading Secrets with Kenneth Trester
1 × $6.00 -
×
 Winning Stock Selection Simplified (Vol I, II & III) with Peter Worden
1 × $6.00
Winning Stock Selection Simplified (Vol I, II & III) with Peter Worden
1 × $6.00 -
×
 AI For Traders with Trading Markets
1 × $31.00
AI For Traders with Trading Markets
1 × $31.00 -
×
 Ultimate Options Trading Blueprint
1 × $23.00
Ultimate Options Trading Blueprint
1 × $23.00 -
×
 ValueCharts Ultimate Bundle with Base Camp Trading
1 × $54.00
ValueCharts Ultimate Bundle with Base Camp Trading
1 × $54.00 -
×
 Algo Trading Masterclass with Ali Casey - StatOasis
1 × $23.00
Algo Trading Masterclass with Ali Casey - StatOasis
1 × $23.00 -
×
 The TrendAdvisor Guide to Breakthrough Profits with Chuck Dukas
1 × $6.00
The TrendAdvisor Guide to Breakthrough Profits with Chuck Dukas
1 × $6.00 -
×
 VIP - One on One Coursework with Talkin Options
1 × $15.00
VIP - One on One Coursework with Talkin Options
1 × $15.00 -
×
 High Probability Trading Using Elliott Wave And Fibonacci Analysis withVic Patel - Forex Training Group
1 × $10.00
High Probability Trading Using Elliott Wave And Fibonacci Analysis withVic Patel - Forex Training Group
1 × $10.00 -
×
 Advanced Options Trading Strategies Explained
1 × $23.00
Advanced Options Trading Strategies Explained
1 × $23.00 -
×
 Certification in Point & Figure Chart & P&F Chart Patterns
1 × $6.00
Certification in Point & Figure Chart & P&F Chart Patterns
1 × $6.00 -
×
 Options Trading & Ultimate MasterClass With Tyrone Abela - FX Evolution
1 × $54.00
Options Trading & Ultimate MasterClass With Tyrone Abela - FX Evolution
1 × $54.00 -
×
 The Insider's Guide to Forex Trading with Kathy Lien
1 × $6.00
The Insider's Guide to Forex Trading with Kathy Lien
1 × $6.00 -
×
 W. D Gann 's Square Of 9 Applied To Modern Markets with Sean Avidar - Hexatrade350
1 × $23.00
W. D Gann 's Square Of 9 Applied To Modern Markets with Sean Avidar - Hexatrade350
1 × $23.00 -
×
 The Delphi Scalper 4 (delphiscalper.com) with Jason Fielder
1 × $6.00
The Delphi Scalper 4 (delphiscalper.com) with Jason Fielder
1 × $6.00 -
×
 Crypto Trading Academy with Cheeky Investor - Aussie Day Trader
1 × $13.00
Crypto Trading Academy with Cheeky Investor - Aussie Day Trader
1 × $13.00 -
×
 Matrix Spread Options Trading Course with Base Camp Trading
1 × $31.00
Matrix Spread Options Trading Course with Base Camp Trading
1 × $31.00 -
×
 Wheels of Gann. Top Secret Forecast Guide with Pat Reda
1 × $6.00
Wheels of Gann. Top Secret Forecast Guide with Pat Reda
1 × $6.00 -
×
 ICT Prodigy Trading Course – $650K in Payouts with Alex Solignani
1 × $15.00
ICT Prodigy Trading Course – $650K in Payouts with Alex Solignani
1 × $15.00 -
×
 Ultimate Options Trading with Cash Flow Academy
1 × $34.00
Ultimate Options Trading with Cash Flow Academy
1 × $34.00 -
×
 TradeCraft: Your Path to Peak Performance Trading By Adam Grimes
1 × $15.00
TradeCraft: Your Path to Peak Performance Trading By Adam Grimes
1 × $15.00 -
×
 Beat the Market with Edward O.Thorp
1 × $6.00
Beat the Market with Edward O.Thorp
1 × $6.00 -
×
 The Trading Blueprint with Brad Goh - The Trading Geek
1 × $5.00
The Trading Blueprint with Brad Goh - The Trading Geek
1 × $5.00 -
×
 Scalp Strategy and Flipping Small Accounts with Opes Trading Group
1 × $5.00
Scalp Strategy and Flipping Small Accounts with Opes Trading Group
1 × $5.00 -
×
 ValueSpace. Winning the Battle for Market Leadership with Banwari Mittal, Jagdish N.Sheth
1 × $6.00
ValueSpace. Winning the Battle for Market Leadership with Banwari Mittal, Jagdish N.Sheth
1 × $6.00 -
×
 BTC Market Profile
1 × $34.00
BTC Market Profile
1 × $34.00 -
×
 The High probability Intraday Trading System with Doc Severson
1 × $6.00
The High probability Intraday Trading System with Doc Severson
1 × $6.00 -
×
 Value, Price & Profit with Karl Marx
1 × $6.00
Value, Price & Profit with Karl Marx
1 × $6.00 -
×
 Van Tharp Courses Collection
1 × $41.00
Van Tharp Courses Collection
1 × $41.00 -
×
 Ultimate Trading Course with Dodgy's Dungeon
1 × $8.00
Ultimate Trading Course with Dodgy's Dungeon
1 × $8.00 -
×
 Best of the Best: Collars with Amy Meissner & Scott Ruble
1 × $15.00
Best of the Best: Collars with Amy Meissner & Scott Ruble
1 × $15.00 -
×
 The Indices Orderflow Masterclass with The Forex Scalpers
1 × $23.00
The Indices Orderflow Masterclass with The Forex Scalpers
1 × $23.00 -
×
 The Complete Guide to Multiple Time Frame Analysis & Reading Price Action with Aiman Almansoori
1 × $13.00
The Complete Guide to Multiple Time Frame Analysis & Reading Price Action with Aiman Almansoori
1 × $13.00

TTM Slingshot & Value Charts Indicators
$6.00
File Size: Coming soon!
Delivery Time: 1–12 hours
Media Type: Online Course
TTM Slingshot & Value Charts Indicators
Introduction to TTM Slingshot & Value Charts
In the dynamic world of trading, having the right tools can make all the difference. Two such powerful tools are the TTM Slingshot and Value Charts Indicators. These indicators provide traders with crucial insights, helping them navigate market complexities and make informed decisions.
Understanding TTM Slingshot
What is TTM Slingshot?
The TTM Slingshot is an advanced trading indicator developed by John Carter. It combines multiple moving averages to identify potential breakout points in the market. By analyzing the relationship between these moving averages, the TTM Slingshot helps traders spot opportunities for entering or exiting trades.
Key Features of TTM Slingshot
- Multiple Moving Averages: Uses short-term and long-term moving averages.
- Breakout Identification: Detects potential breakout points.
- Versatility: Applicable across various markets and timeframes.
Benefits of Using TTM Slingshot
Enhanced Market Analysis
The TTM Slingshot provides a detailed analysis of market trends, allowing traders to anticipate significant price movements. This indicator’s ability to pinpoint breakout points is invaluable for making timely trading decisions.
Improved Trading Accuracy
By combining multiple moving averages, the TTM Slingshot offers a comprehensive view of the market. This integration reduces noise and enhances the accuracy of predictions, leading to more successful trades.
Setting Up TTM Slingshot
Choosing the Right Platform
To utilize the TTM Slingshot, you’ll need a trading platform that supports custom indicators. Platforms like Thinkorswim and TradeStation are popular choices among traders.
Installing the Indicator
- Download the Indicator: Obtain the TTM Slingshot file compatible with your trading platform.
- Open Your Platform: Launch the trading platform.
- Add the Indicator: Navigate to the ‘Indicators’ section and add the TTM Slingshot file.
- Customize Settings: Adjust the settings to align with your trading strategy.
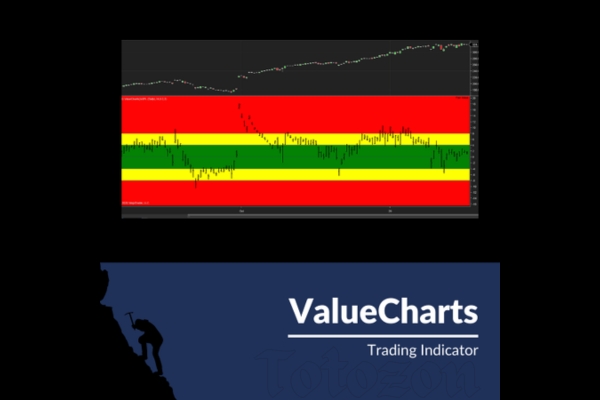
Understanding Value Charts Indicators
What are Value Charts Indicators?
Value Charts Indicators are tools that measure the relative value of a security based on its price history. These indicators help traders determine whether a security is overvalued, undervalued, or fairly valued, providing a clear picture of potential trading opportunities.
Key Features of Value Charts Indicators
- Relative Value Measurement: Assesses the value of a security.
- Overbought/Oversold Conditions: Identifies extreme market conditions.
- Visual Representation: Displays value levels on a chart for easy interpretation.
Benefits of Using Value Charts Indicators
Identifying Market Extremes
Value Charts Indicators are excellent for spotting overbought and oversold conditions. By identifying these extremes, traders can make strategic decisions about entering or exiting positions.
Enhancing Risk Management
These indicators aid in risk management by providing insights into the relative value of a security. Traders can use this information to set stop-loss levels and protect their investments.
Setting Up Value Charts Indicators
Selecting the Appropriate Platform
Choose a trading platform that supports Value Charts Indicators. Many modern trading platforms, such as NinjaTrader and MetaTrader, offer these indicators.
Installing the Indicator
- Download the Indicator: Obtain the Value Charts Indicator file for your platform.
- Open Your Platform: Start the trading platform.
- Add the Indicator: Go to the ‘Indicators’ section and add the Value Charts file.
- Configure Settings: Customize the settings to fit your trading approach.
How to Use TTM Slingshot & Value Charts Together
Combining Indicators for Better Insights
Using TTM Slingshot and Value Charts Indicators together can enhance your market analysis. While TTM Slingshot identifies breakout points, Value Charts Indicators help assess the relative value of the security, providing a more comprehensive view.
Practical Application
- Entry Points: Use TTM Slingshot to identify breakout points and confirm with Value Charts Indicators to ensure the security is not overvalued.
- Exit Points: Value Charts Indicators can signal overbought conditions, indicating a good time to exit, while TTM Slingshot confirms the end of a trend.
Advanced Strategies with TTM Slingshot & Value Charts
Pairing with Other Indicators
For even more robust analysis, pair TTM Slingshot and Value Charts Indicators with other tools such as RSI (Relative Strength Index) and MACD (Moving Average Convergence Divergence).
Developing a Trading Plan
Create a detailed trading plan that incorporates these indicators. Define your entry and exit points, risk management strategies, and the specific market conditions you’re targeting.
Real-Life Examples
Successful Trade Case Study
Consider a scenario where the TTM Slingshot indicates a breakout, and Value Charts Indicators show the security is undervalued. Entering a trade at this point could lead to significant profits as the price moves to its fair value.
Learning from Mistakes
Analyze trades where the indicators did not predict the expected outcome. Understanding these failures can help refine your strategy and improve future performance.
Conclusion
Maximizing Your Trading Success
The TTM Slingshot and Value Charts Indicators are powerful tools that, when used together, can significantly enhance your trading strategy. By providing insights into market trends and relative value, these indicators help you make more informed decisions.
Taking the Next Step
Start by setting up these indicators on your trading platform. Practice interpreting the signals and integrating them into your trading strategy to see the benefits firsthand.

FAQs
What is the TTM Slingshot indicator?
The TTM Slingshot is a trading tool that uses multiple moving averages to identify breakout points in the market.
How do Value Charts Indicators work?
Value Charts Indicators measure the relative value of a security, helping traders identify overbought and oversold conditions.
Can these indicators be used together?
Yes, combining TTM Slingshot and Value Charts Indicators provides a comprehensive analysis of market trends and security value.
Which platforms support these indicators?
Platforms like Thinkorswim, TradeStation, NinjaTrader, and MetaTrader support TTM Slingshot and Value Charts Indicators.
How do I install these indicators?
Download the respective indicator files, open your trading platform, and add the indicators through the ‘Indicators’ section.
Be the first to review “TTM Slingshot & Value Charts Indicators”
You must be logged in to post a review.
Related products
Original price was: $799.00.$15.00Current price is: $15.00.
Original price was: $450.00.$23.00Current price is: $23.00.

Forex Trading
Original price was: $2,997.00.$23.00Current price is: $23.00.
Forex Trading
The Complete Guide to Multiple Time Frame Analysis & Reading Price Action with Aiman Almansoori
Original price was: $1,399.00.$13.00Current price is: $13.00.
Forex Trading
Original price was: $999.00.$15.00Current price is: $15.00.
Original price was: $997.00.$8.00Current price is: $8.00.

Forex Trading
Original price was: $249.00.$15.00Current price is: $15.00.
Forex Trading
Original price was: $397.00.$31.00Current price is: $31.00.
Forex Trading
Original price was: $797.00.$10.00Current price is: $10.00.
Forex Trading
Original price was: $239.00.$8.00Current price is: $8.00.
Forex Trading
Original price was: $1,898.00.$10.00Current price is: $10.00.
Original price was: $999.00.$5.00Current price is: $5.00.
Forex Trading
Original price was: $799.00.$15.00Current price is: $15.00.
Original price was: $299.00.$8.00Current price is: $8.00.
Original price was: $497.00.$11.00Current price is: $11.00.
Forex Trading
Original price was: $125.00.$17.00Current price is: $17.00.
Original price was: $997.00.$13.00Current price is: $13.00.
Original price was: $695.00.$41.00Current price is: $41.00.
Original price was: $1,200.00.$23.00Current price is: $23.00.
Original price was: $4,995.00.$15.00Current price is: $15.00.

Reviews
There are no reviews yet.