-
×
 War Room Psychology Vol. 1 with Pat Mitchell – Trick Trades
1 × $23.00
War Room Psychology Vol. 1 with Pat Mitchell – Trick Trades
1 × $23.00 -
×
 TIMfundamentals with Timothy Sykes
1 × $5.00
TIMfundamentals with Timothy Sykes
1 × $5.00 -
×
 Quantamentals - The Next Great Forefront Of Trading and Investing with Trading Markets
1 × $8.00
Quantamentals - The Next Great Forefront Of Trading and Investing with Trading Markets
1 × $8.00 -
×
 Strategies of a Winning Trader 2023 with Gareth Soloway
1 × $209.00
Strategies of a Winning Trader 2023 with Gareth Soloway
1 × $209.00 -
×
 $20 – 52k 20 pips a day challange with Rafał Zuchowicz - TopMasterTrader
1 × $5.00
$20 – 52k 20 pips a day challange with Rafał Zuchowicz - TopMasterTrader
1 × $5.00 -
×
 Channel Surfing Video Course
1 × $23.00
Channel Surfing Video Course
1 × $23.00 -
×
 Triple Your Trading Profits Couse with David Jenyns
1 × $6.00
Triple Your Trading Profits Couse with David Jenyns
1 × $6.00 -
×
 VintagEducation - The Fast Track Forex Bootcamp
1 × $6.00
VintagEducation - The Fast Track Forex Bootcamp
1 × $6.00 -
×
 Video Package
1 × $6.00
Video Package
1 × $6.00 -
×
 CFA Level 2 - Examination Book Afternoon Section (1999)
1 × $6.00
CFA Level 2 - Examination Book Afternoon Section (1999)
1 × $6.00 -
×
 Interactive Course
1 × $6.00
Interactive Course
1 × $6.00 -
×
 A Day Trading Guide
1 × $54.00
A Day Trading Guide
1 × $54.00 -
×
 Cheat Code Trading System
1 × $13.00
Cheat Code Trading System
1 × $13.00 -
×
 Building Automated Trading Systems C++.NET with Benjamin Van Vliet
1 × $6.00
Building Automated Trading Systems C++.NET with Benjamin Van Vliet
1 × $6.00 -
×
 W. D Gann 's Square Of 9 Applied To Modern Markets with Sean Avidar - Hexatrade350
1 × $23.00
W. D Gann 's Square Of 9 Applied To Modern Markets with Sean Avidar - Hexatrade350
1 × $23.00 -
×
 Access All Areas with Marwood Research
1 × $54.00
Access All Areas with Marwood Research
1 × $54.00 -
×
 Charles Cottle Package ( Discount 50% )
1 × $23.00
Charles Cottle Package ( Discount 50% )
1 × $23.00 -
×
 Boomerang Day Trader (Aug 2012)
1 × $54.00
Boomerang Day Trader (Aug 2012)
1 × $54.00 -
×
 White Phoenix’s The Smart (Money) Approach to Trading with Jayson Casper
1 × $39.00
White Phoenix’s The Smart (Money) Approach to Trading with Jayson Casper
1 × $39.00 -
×
 IBD Advanced Buying Strategies Home Study Program
1 × $10.00
IBD Advanced Buying Strategies Home Study Program
1 × $10.00 -
×
 WYCKOFF TRADING COURSE (WTC) PART I – ANALYSIS (Fall 2021) with Roman Bogomazov
1 × $209.00
WYCKOFF TRADING COURSE (WTC) PART I – ANALYSIS (Fall 2021) with Roman Bogomazov
1 × $209.00 -
×
 TRADE THE BANKS TRAINING PACKAGE
1 × $15.00
TRADE THE BANKS TRAINING PACKAGE
1 × $15.00 -
×
 Timing the Market with Unique Indicators with Sherman McCellan
1 × $6.00
Timing the Market with Unique Indicators with Sherman McCellan
1 × $6.00 -
×
 Radioactive Trading Mastery Course
1 × $6.00
Radioactive Trading Mastery Course
1 × $6.00 -
×
 The Complete Guide to Multiple Time Frame Analysis & Reading Price Action with Aiman Almansoori
1 × $13.00
The Complete Guide to Multiple Time Frame Analysis & Reading Price Action with Aiman Almansoori
1 × $13.00 -
×
 Quantifiable Edges VIX Trading Course with Amibroker Code - Quantifiable Edges
1 × $15.00
Quantifiable Edges VIX Trading Course with Amibroker Code - Quantifiable Edges
1 × $15.00 -
×
 Private Seminar with Alan Andrew
1 × $6.00
Private Seminar with Alan Andrew
1 × $6.00 -
×
 Winning System For Trading High-Performance Stocks with Tim Cho
1 × $6.00
Winning System For Trading High-Performance Stocks with Tim Cho
1 × $6.00 -
×
 TRAING IRON CONDORS IN ANY ENVIRONMENT with Sheridan Options Mentoring
1 × $15.00
TRAING IRON CONDORS IN ANY ENVIRONMENT with Sheridan Options Mentoring
1 × $15.00 -
×
 Certification in Point & Figure Chart & P&F Chart Patterns
1 × $6.00
Certification in Point & Figure Chart & P&F Chart Patterns
1 × $6.00 -
×
 Profit Wave Trade Strategy with Base Camp Trading
1 × $4.00
Profit Wave Trade Strategy with Base Camp Trading
1 × $4.00 -
×
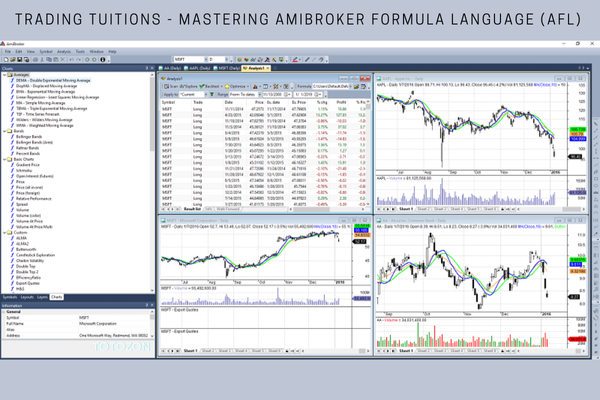 Trading Tuitions - Mastering Amibroker Formula Language (AFL)
1 × $15.00
Trading Tuitions - Mastering Amibroker Formula Language (AFL)
1 × $15.00 -
×
 The Handbook of Commodity Investing with Frank Fabozzi, Roland Fuss & Dieter Kaiser
1 × $6.00
The Handbook of Commodity Investing with Frank Fabozzi, Roland Fuss & Dieter Kaiser
1 × $6.00 -
×
 Alexander Elder Package ( Discount 28% )
1 × $31.00
Alexander Elder Package ( Discount 28% )
1 × $31.00 -
×
 Market Timing & Technical Analysis with Alan Shaw
1 × $6.00
Market Timing & Technical Analysis with Alan Shaw
1 × $6.00 -
×
 SQX Mentorship with Tip Toe Hippo
1 × $23.00
SQX Mentorship with Tip Toe Hippo
1 × $23.00 -
×
 Trading the Elliott Waves with Robert Prechter
1 × $15.00
Trading the Elliott Waves with Robert Prechter
1 × $15.00 -
×
 Raghee Horner's Workspace Bundle + Live Trading By Raghee Horner - Simpler Trading
1 × $23.00
Raghee Horner's Workspace Bundle + Live Trading By Raghee Horner - Simpler Trading
1 × $23.00 -
×
 Options Trading & Ultimate MasterClass With Tyrone Abela - FX Evolution
1 × $54.00
Options Trading & Ultimate MasterClass With Tyrone Abela - FX Evolution
1 × $54.00 -
×
 The Four Biggest Mistakes in Futures Trading (1st Edition) with Jay Kaeppel
1 × $6.00
The Four Biggest Mistakes in Futures Trading (1st Edition) with Jay Kaeppel
1 × $6.00 -
×
 Essentials in Quantitative Trading QT01 By HangukQuant's
1 × $23.00
Essentials in Quantitative Trading QT01 By HangukQuant's
1 × $23.00 -
×
 Crystal Ball Pack PLUS bonus Live Trade By Pat Mitchell - Trick Trades
1 × $20.00
Crystal Ball Pack PLUS bonus Live Trade By Pat Mitchell - Trick Trades
1 × $20.00 -
×
 Trading Strategies for Capital Markets with Joseph Benning
1 × $6.00
Trading Strategies for Capital Markets with Joseph Benning
1 × $6.00 -
×
 The Superstock Investor with Charles LaLoggia
1 × $6.00
The Superstock Investor with Charles LaLoggia
1 × $6.00 -
×
 ICinDER V2 Cycle Analysis and TrendGuide Pack and Bloodhound Ultimate (May 2015)
1 × $31.00
ICinDER V2 Cycle Analysis and TrendGuide Pack and Bloodhound Ultimate (May 2015)
1 × $31.00 -
×
 Trade What You See, Not What You Believe with Larry Pesavento
1 × $6.00
Trade What You See, Not What You Believe with Larry Pesavento
1 × $6.00 -
×
 Volume Profile Trading Strategy with Critical Trading
1 × $15.00
Volume Profile Trading Strategy with Critical Trading
1 × $15.00 -
×
 Use the News with Maria Bartiromo
1 × $6.00
Use the News with Maria Bartiromo
1 × $6.00 -
×
 Unusual Options Activity Master Course with Andrew Keene - AlphaShark
1 × $15.00
Unusual Options Activity Master Course with Andrew Keene - AlphaShark
1 × $15.00 -
×
 Advanced Spread Trading with Guy Bower - MasterClass Trader
1 × $15.00
Advanced Spread Trading with Guy Bower - MasterClass Trader
1 × $15.00 -
×
 Aeron V5 Scalper+Grid
1 × $23.00
Aeron V5 Scalper+Grid
1 × $23.00 -
×
 TRADING NFX Course with Andrew NFX
1 × $5.00
TRADING NFX Course with Andrew NFX
1 × $5.00 -
×
 Valuation of Internet & Technology Stocks with Brian Kettell
1 × $6.00
Valuation of Internet & Technology Stocks with Brian Kettell
1 × $6.00 -
×
 The Orderflow Masterclass with PrimeTrading
1 × $17.00
The Orderflow Masterclass with PrimeTrading
1 × $17.00 -
×
 Forecast 2024 Clarification with Larry Williams
1 × $15.00
Forecast 2024 Clarification with Larry Williams
1 × $15.00 -
×
 The Naked Eye: Raw Data Analytics with Edgar Torres - Raw Data Analytics
1 × $8.00
The Naked Eye: Raw Data Analytics with Edgar Torres - Raw Data Analytics
1 × $8.00 -
×
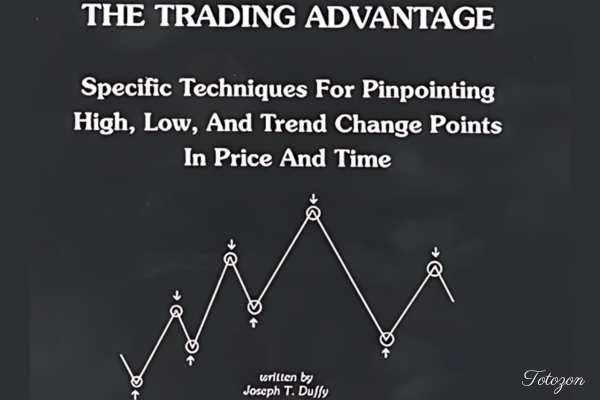 The Trading Avantage with Joseph Duffy
1 × $6.00
The Trading Avantage with Joseph Duffy
1 × $6.00 -
×
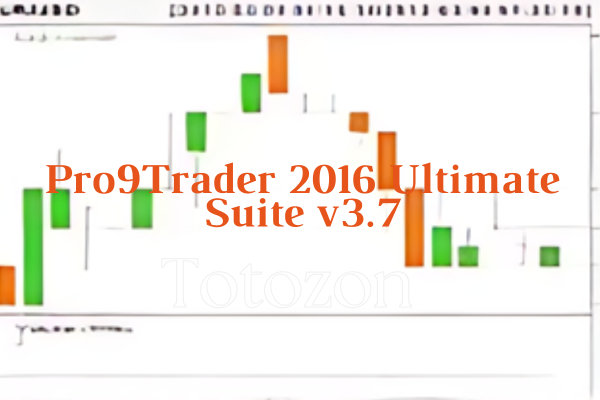 Pro9Trader 2016 Ultimate Suite v3.7
1 × $62.00
Pro9Trader 2016 Ultimate Suite v3.7
1 × $62.00 -
×
 Bear Market Success Workshop with Base Camp Trading
1 × $15.00
Bear Market Success Workshop with Base Camp Trading
1 × $15.00 -
×
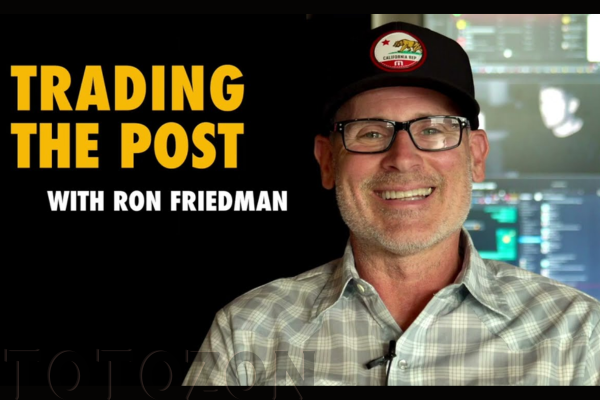 Trading the Post with Ron Friedman
1 × $5.00
Trading the Post with Ron Friedman
1 × $5.00 -
×
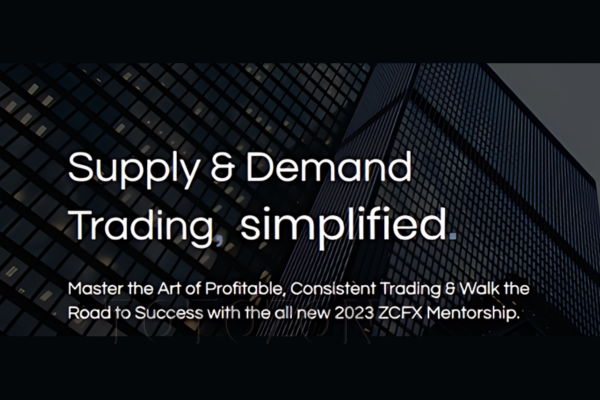 ZCFX Trading Course 2023 with ZCFX Trading
1 × $5.00
ZCFX Trading Course 2023 with ZCFX Trading
1 × $5.00 -
×
 Wealth, War & Wisdom with Barton Biggs
1 × $6.00
Wealth, War & Wisdom with Barton Biggs
1 × $6.00 -
×
 WondaFX Signature Strategy with WondaFX
1 × $5.00
WondaFX Signature Strategy with WondaFX
1 × $5.00 -
×
 The Orderflows Trade Opportunities Encyclopedia with Michael Valtos
1 × $8.00
The Orderflows Trade Opportunities Encyclopedia with Michael Valtos
1 × $8.00 -
×
 Activedaytrader - Bond Trading Bootcamp
1 × $8.00
Activedaytrader - Bond Trading Bootcamp
1 × $8.00 -
×
 Trading Price Action Reversals (Kindle) with Al Brooks
1 × $6.00
Trading Price Action Reversals (Kindle) with Al Brooks
1 × $6.00 -
×
 Low Timeframe Supply & Demand with RROP
1 × $5.00
Low Timeframe Supply & Demand with RROP
1 × $5.00 -
×
 Trader University Course
1 × $5.00
Trader University Course
1 × $5.00 -
×
 Trading to Win Course: One Day at Time (2004 ed.) with Bruce Gilmore
1 × $6.00
Trading to Win Course: One Day at Time (2004 ed.) with Bruce Gilmore
1 × $6.00 -
×
 Planting Landmines for Explosive Profits with Dave Slingshot
1 × $6.00
Planting Landmines for Explosive Profits with Dave Slingshot
1 × $6.00 -
×
 ABCs of Trading and Tech Analysis (Online Investor Expo, Las Vegas 2000) with Tom Bierovic
1 × $6.00
ABCs of Trading and Tech Analysis (Online Investor Expo, Las Vegas 2000) with Tom Bierovic
1 × $6.00 -
×
 Elliott Wave Swing High Low Indicator for ThinkorSwim with Fibonacci
1 × $6.00
Elliott Wave Swing High Low Indicator for ThinkorSwim with Fibonacci
1 × $6.00 -
×
 Triple Squeeze Indicator TOS
1 × $6.00
Triple Squeeze Indicator TOS
1 × $6.00 -
×
 0 DTE Options Trading Workshop with Aeromir Corporation
1 × $15.00
0 DTE Options Trading Workshop with Aeromir Corporation
1 × $15.00 -
×
 Bulk REO 2.0
1 × $23.00
Bulk REO 2.0
1 × $23.00 -
×
 Options University - FX Options Trading Course 2008
1 × $6.00
Options University - FX Options Trading Course 2008
1 × $6.00 -
×
 Sacredscience - R.N.Elliott – Nature’s Law. The secret of the Universe
1 × $6.00
Sacredscience - R.N.Elliott – Nature’s Law. The secret of the Universe
1 × $6.00 -
×
 High Probability Trading Using Elliott Wave And Fibonacci Analysis withVic Patel - Forex Training Group
1 × $10.00
High Probability Trading Using Elliott Wave And Fibonacci Analysis withVic Patel - Forex Training Group
1 × $10.00 -
×
 VXX Made Easy By Option Pit
1 × $62.00
VXX Made Easy By Option Pit
1 × $62.00 -
×
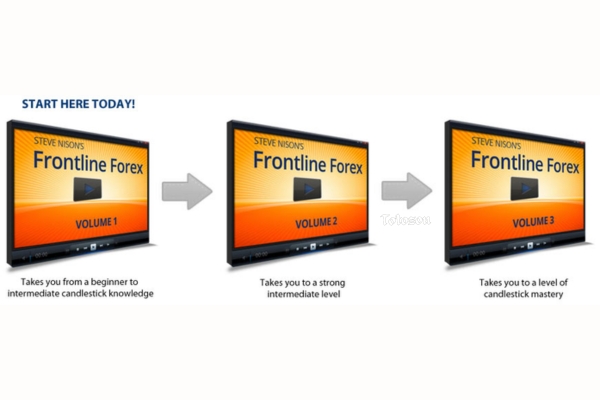 Frontline Forex Vol 1-3 with Steve Nison - Candle Charts
1 × $54.00
Frontline Forex Vol 1-3 with Steve Nison - Candle Charts
1 × $54.00 -
×
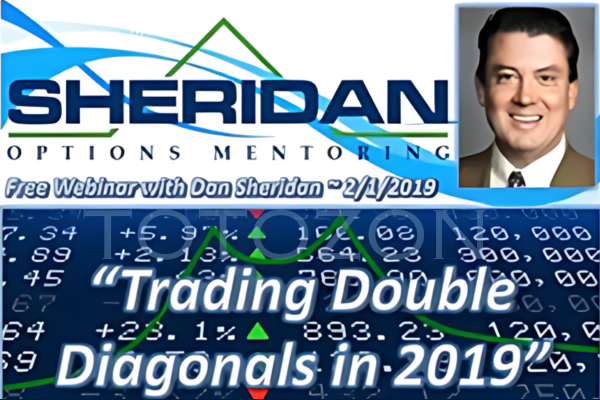 Trading Double Diagonals in 2019 with Dan Sheridan - Sheridan Options Mentoring
1 × $5.00
Trading Double Diagonals in 2019 with Dan Sheridan - Sheridan Options Mentoring
1 × $5.00 -
×
 Deep Dive Butterfly Trading Strategy Class with SJG Trades
1 × $41.00
Deep Dive Butterfly Trading Strategy Class with SJG Trades
1 × $41.00 -
×
 Matrix Spread Options Trading Course with Base Camp Trading
1 × $31.00
Matrix Spread Options Trading Course with Base Camp Trading
1 × $31.00

TTM Slingshot & Value Charts Indicators
$6.00
File Size: Coming soon!
Delivery Time: 1–12 hours
Media Type: Online Course
TTM Slingshot & Value Charts Indicators
Introduction to TTM Slingshot & Value Charts
In the dynamic world of trading, having the right tools can make all the difference. Two such powerful tools are the TTM Slingshot and Value Charts Indicators. These indicators provide traders with crucial insights, helping them navigate market complexities and make informed decisions.
Understanding TTM Slingshot
What is TTM Slingshot?
The TTM Slingshot is an advanced trading indicator developed by John Carter. It combines multiple moving averages to identify potential breakout points in the market. By analyzing the relationship between these moving averages, the TTM Slingshot helps traders spot opportunities for entering or exiting trades.
Key Features of TTM Slingshot
- Multiple Moving Averages: Uses short-term and long-term moving averages.
- Breakout Identification: Detects potential breakout points.
- Versatility: Applicable across various markets and timeframes.
Benefits of Using TTM Slingshot
Enhanced Market Analysis
The TTM Slingshot provides a detailed analysis of market trends, allowing traders to anticipate significant price movements. This indicator’s ability to pinpoint breakout points is invaluable for making timely trading decisions.
Improved Trading Accuracy
By combining multiple moving averages, the TTM Slingshot offers a comprehensive view of the market. This integration reduces noise and enhances the accuracy of predictions, leading to more successful trades.
Setting Up TTM Slingshot
Choosing the Right Platform
To utilize the TTM Slingshot, you’ll need a trading platform that supports custom indicators. Platforms like Thinkorswim and TradeStation are popular choices among traders.
Installing the Indicator
- Download the Indicator: Obtain the TTM Slingshot file compatible with your trading platform.
- Open Your Platform: Launch the trading platform.
- Add the Indicator: Navigate to the ‘Indicators’ section and add the TTM Slingshot file.
- Customize Settings: Adjust the settings to align with your trading strategy.
Understanding Value Charts Indicators
What are Value Charts Indicators?
Value Charts Indicators are tools that measure the relative value of a security based on its price history. These indicators help traders determine whether a security is overvalued, undervalued, or fairly valued, providing a clear picture of potential trading opportunities.
Key Features of Value Charts Indicators
- Relative Value Measurement: Assesses the value of a security.
- Overbought/Oversold Conditions: Identifies extreme market conditions.
- Visual Representation: Displays value levels on a chart for easy interpretation.
Benefits of Using Value Charts Indicators
Identifying Market Extremes
Value Charts Indicators are excellent for spotting overbought and oversold conditions. By identifying these extremes, traders can make strategic decisions about entering or exiting positions.
Enhancing Risk Management
These indicators aid in risk management by providing insights into the relative value of a security. Traders can use this information to set stop-loss levels and protect their investments.
Setting Up Value Charts Indicators
Selecting the Appropriate Platform
Choose a trading platform that supports Value Charts Indicators. Many modern trading platforms, such as NinjaTrader and MetaTrader, offer these indicators.
Installing the Indicator
- Download the Indicator: Obtain the Value Charts Indicator file for your platform.
- Open Your Platform: Start the trading platform.
- Add the Indicator: Go to the ‘Indicators’ section and add the Value Charts file.
- Configure Settings: Customize the settings to fit your trading approach.
How to Use TTM Slingshot & Value Charts Together
Combining Indicators for Better Insights
Using TTM Slingshot and Value Charts Indicators together can enhance your market analysis. While TTM Slingshot identifies breakout points, Value Charts Indicators help assess the relative value of the security, providing a more comprehensive view.
Practical Application
- Entry Points: Use TTM Slingshot to identify breakout points and confirm with Value Charts Indicators to ensure the security is not overvalued.
- Exit Points: Value Charts Indicators can signal overbought conditions, indicating a good time to exit, while TTM Slingshot confirms the end of a trend.
Advanced Strategies with TTM Slingshot & Value Charts
Pairing with Other Indicators
For even more robust analysis, pair TTM Slingshot and Value Charts Indicators with other tools such as RSI (Relative Strength Index) and MACD (Moving Average Convergence Divergence).
Developing a Trading Plan
Create a detailed trading plan that incorporates these indicators. Define your entry and exit points, risk management strategies, and the specific market conditions you’re targeting.
Real-Life Examples
Successful Trade Case Study
Consider a scenario where the TTM Slingshot indicates a breakout, and Value Charts Indicators show the security is undervalued. Entering a trade at this point could lead to significant profits as the price moves to its fair value.
Learning from Mistakes
Analyze trades where the indicators did not predict the expected outcome. Understanding these failures can help refine your strategy and improve future performance.
Conclusion
Maximizing Your Trading Success
The TTM Slingshot and Value Charts Indicators are powerful tools that, when used together, can significantly enhance your trading strategy. By providing insights into market trends and relative value, these indicators help you make more informed decisions.
Taking the Next Step
Start by setting up these indicators on your trading platform. Practice interpreting the signals and integrating them into your trading strategy to see the benefits firsthand.

FAQs
What is the TTM Slingshot indicator?
The TTM Slingshot is a trading tool that uses multiple moving averages to identify breakout points in the market.
How do Value Charts Indicators work?
Value Charts Indicators measure the relative value of a security, helping traders identify overbought and oversold conditions.
Can these indicators be used together?
Yes, combining TTM Slingshot and Value Charts Indicators provides a comprehensive analysis of market trends and security value.
Which platforms support these indicators?
Platforms like Thinkorswim, TradeStation, NinjaTrader, and MetaTrader support TTM Slingshot and Value Charts Indicators.
How do I install these indicators?
Download the respective indicator files, open your trading platform, and add the indicators through the ‘Indicators’ section.
Be the first to review “TTM Slingshot & Value Charts Indicators”
You must be logged in to post a review.
Related products

Original price was: $1,849.00.$15.00Current price is: $15.00.

Forex Trading
Original price was: $799.00.$15.00Current price is: $15.00.

Original price was: $999.00.$5.00Current price is: $5.00.

Forex Trading
Original price was: $4,997.00.$27.00Current price is: $27.00.
Original price was: $700.00.$39.00Current price is: $39.00.
Original price was: $139.00.$23.00Current price is: $23.00.
Original price was: $497.00.$31.00Current price is: $31.00.
Forex Trading
Original price was: $500.00.$5.00Current price is: $5.00.
Forex Trading
Original price was: $850.00.$23.00Current price is: $23.00.

Forex Trading
Original price was: $2,995.00.$31.00Current price is: $31.00.
Forex Trading
Original price was: $125.00.$17.00Current price is: $17.00.

Original price was: $450.00.$23.00Current price is: $23.00.
Original price was: $299.00.$8.00Current price is: $8.00.

Forex Trading
Original price was: $499.00.$15.00Current price is: $15.00.
Forex Trading
Original price was: $550.00.$5.00Current price is: $5.00.
Forex Trading
Quantamentals – The Next Great Forefront Of Trading and Investing with Trading Markets
Original price was: $1,495.00.$8.00Current price is: $8.00.

Forex Trading
Original price was: $397.00.$31.00Current price is: $31.00.

Original price was: $4,995.00.$15.00Current price is: $15.00.

Original price was: $2,120.00.$15.00Current price is: $15.00.

Original price was: $997.00.$13.00Current price is: $13.00.

Reviews
There are no reviews yet.