-
×
 Baby Blue Trading Technique for the E-Minis with Dave Wright
1 × $6.00
Baby Blue Trading Technique for the E-Minis with Dave Wright
1 × $6.00 -
×
 The Orderflow Masterclass with PrimeTrading
1 × $17.00
The Orderflow Masterclass with PrimeTrading
1 × $17.00 -
×
 Essentials in Quantitative Trading QT01 By HangukQuant's
1 × $23.00
Essentials in Quantitative Trading QT01 By HangukQuant's
1 × $23.00 -
×
 Deep Dive Butterfly Trading Strategy Class with SJG Trades
1 × $41.00
Deep Dive Butterfly Trading Strategy Class with SJG Trades
1 × $41.00 -
×
 The Naked Eye: Raw Data Analytics with Edgar Torres - Raw Data Analytics
1 × $8.00
The Naked Eye: Raw Data Analytics with Edgar Torres - Raw Data Analytics
1 × $8.00 -
×
 The Orderflows Trade Opportunities Encyclopedia with Michael Valtos
1 × $8.00
The Orderflows Trade Opportunities Encyclopedia with Michael Valtos
1 × $8.00 -
×
 Speculator King 1967 with Jesse Livermore
1 × $6.00
Speculator King 1967 with Jesse Livermore
1 × $6.00 -
×
 B.O.S.S. Carbon with Pat Mitchell – Trick Trades
1 × $8.00
B.O.S.S. Carbon with Pat Mitchell – Trick Trades
1 × $8.00 -
×
 The Solar Guidance System with Ruth Miller & Iam Williams
1 × $6.00
The Solar Guidance System with Ruth Miller & Iam Williams
1 × $6.00 -
×
 W. D Gann 's Square Of 9 Applied To Modern Markets with Sean Avidar - Hexatrade350
1 × $23.00
W. D Gann 's Square Of 9 Applied To Modern Markets with Sean Avidar - Hexatrade350
1 × $23.00 -
×
 WondaFX Signature Strategy with WondaFX
1 × $5.00
WondaFX Signature Strategy with WondaFX
1 × $5.00 -
×
 Forex Trading Course 101 & 201
1 × $54.00
Forex Trading Course 101 & 201
1 × $54.00 -
×
 Trade for Life - 5 Day Trading Laboratory
1 × $54.00
Trade for Life - 5 Day Trading Laboratory
1 × $54.00 -
×
 Activedaytrader - Bond Trading Bootcamp
1 × $8.00
Activedaytrader - Bond Trading Bootcamp
1 × $8.00 -
×
 Managing Your Goals with Alec MacKenzie
1 × $6.00
Managing Your Goals with Alec MacKenzie
1 × $6.00 -
×
 ICT Prodigy Trading Course – $650K in Payouts with Alex Solignani
1 × $15.00
ICT Prodigy Trading Course – $650K in Payouts with Alex Solignani
1 × $15.00 -
×
 Ultimate Day Trading Program with Maroun4x
1 × $5.00
Ultimate Day Trading Program with Maroun4x
1 × $5.00 -
×
 TradeCraft: Your Path to Peak Performance Trading By Adam Grimes
1 × $15.00
TradeCraft: Your Path to Peak Performance Trading By Adam Grimes
1 × $15.00 -
×
 Home Run Options Trading Course with Dave Aquino - Base Camp Trading
1 × $11.00
Home Run Options Trading Course with Dave Aquino - Base Camp Trading
1 × $11.00 -
×
 Order flow self-study training program with iMFtracker
1 × $10.00
Order flow self-study training program with iMFtracker
1 × $10.00 -
×
 Volume Profile Trading Strategy with Critical Trading
1 × $15.00
Volume Profile Trading Strategy with Critical Trading
1 × $15.00 -
×
 Ultimate Trading Course with Dodgy's Dungeon
1 × $8.00
Ultimate Trading Course with Dodgy's Dungeon
1 × $8.00 -
×
 Vertical Spreads. Strategy Intensive
1 × $4.00
Vertical Spreads. Strategy Intensive
1 × $4.00 -
×
 Scalp Strategy and Flipping Small Accounts with Opes Trading Group
1 × $5.00
Scalp Strategy and Flipping Small Accounts with Opes Trading Group
1 × $5.00 -
×
 6 Dynamic Trader Real Time and End Of Day
1 × $39.00
6 Dynamic Trader Real Time and End Of Day
1 × $39.00 -
×
 Options Trading & Ultimate MasterClass With Tyrone Abela - FX Evolution
1 × $54.00
Options Trading & Ultimate MasterClass With Tyrone Abela - FX Evolution
1 × $54.00 -
×
 Breakthroughs in Technical Analysis: New Thinking From the World's Top Minds (1st Edition) with David Keller
1 × $6.00
Breakthroughs in Technical Analysis: New Thinking From the World's Top Minds (1st Edition) with David Keller
1 × $6.00 -
×
 AI For Traders with Trading Markets
1 × $31.00
AI For Traders with Trading Markets
1 × $31.00 -
×
 Trading Short TermSame Day Trades Sep 2023 with Dan Sheridan & Mark Fenton - Sheridan Options Mentoring
1 × $31.00
Trading Short TermSame Day Trades Sep 2023 with Dan Sheridan & Mark Fenton - Sheridan Options Mentoring
1 × $31.00 -
×
 0 DTE Options Trading Workshop with Aeromir Corporation
1 × $15.00
0 DTE Options Trading Workshop with Aeromir Corporation
1 × $15.00 -
×
 High Probability Trading Using Elliott Wave And Fibonacci Analysis withVic Patel - Forex Training Group
1 × $10.00
High Probability Trading Using Elliott Wave And Fibonacci Analysis withVic Patel - Forex Training Group
1 × $10.00 -
×
 Judgemental Trend Following (Audio) with Russell Sands
1 × $6.00
Judgemental Trend Following (Audio) with Russell Sands
1 × $6.00 -
×
 Advanced Calculus with Applications in Statistics
1 × $6.00
Advanced Calculus with Applications in Statistics
1 × $6.00 -
×
 Butterfly and Condor Workshop with Aeromir
1 × $15.00
Butterfly and Condor Workshop with Aeromir
1 × $15.00 -
×
 Advanced Spread Trading with Guy Bower - MasterClass Trader
1 × $15.00
Advanced Spread Trading with Guy Bower - MasterClass Trader
1 × $15.00 -
×
 The Indices Orderflow Masterclass with The Forex Scalpers
1 × $23.00
The Indices Orderflow Masterclass with The Forex Scalpers
1 × $23.00 -
×
 Best of the Best: Collars with Amy Meissner & Scott Ruble
1 × $15.00
Best of the Best: Collars with Amy Meissner & Scott Ruble
1 × $15.00 -
×
 Bond Market Course with The Macro Compass
1 × $15.00
Bond Market Course with The Macro Compass
1 × $15.00 -
×
 Advanced Pattern Trader Course with Trade Empowered
1 × $23.00
Advanced Pattern Trader Course with Trade Empowered
1 × $23.00 -
×
 Scalping Master Course with Dayonetraders
1 × $6.00
Scalping Master Course with Dayonetraders
1 × $6.00 -
×
 Hands On Training Bundle with Talkin Options
1 × $23.00
Hands On Training Bundle with Talkin Options
1 × $23.00 -
×
 Crystal Ball Pack PLUS bonus Live Trade By Pat Mitchell - Trick Trades
1 × $20.00
Crystal Ball Pack PLUS bonus Live Trade By Pat Mitchell - Trick Trades
1 × $20.00 -
×
 Programming in Python For Traders with Trading Markets
1 × $15.00
Programming in Python For Traders with Trading Markets
1 × $15.00 -
×
 The A14 Weekly Option Strategy Workshop with Amy Meissner
1 × $23.00
The A14 Weekly Option Strategy Workshop with Amy Meissner
1 × $23.00 -
×
 Weekly Options Trading Advantage Class with Doc Severson
1 × $6.00
Weekly Options Trading Advantage Class with Doc Severson
1 × $6.00 -
×
 Introduction To Advanced Options Trading 201
1 × $23.00
Introduction To Advanced Options Trading 201
1 × $23.00 -
×
 Netpicks - The Ultimate Trading Machine Complete Set of Courses, TS Indicators & Daily Updates
1 × $6.00
Netpicks - The Ultimate Trading Machine Complete Set of Courses, TS Indicators & Daily Updates
1 × $6.00 -
×
 The Complete Options Trading Course (New 2019) with Wealthy Education
1 × $6.00
The Complete Options Trading Course (New 2019) with Wealthy Education
1 × $6.00 -
×
 Trading with Fibonacci and Market Structure - Price Action Volume Trader
1 × $23.00
Trading with Fibonacci and Market Structure - Price Action Volume Trader
1 × $23.00 -
×
 Scalp Trading Mini Course with Jayson Casper
1 × $23.00
Scalp Trading Mini Course with Jayson Casper
1 × $23.00 -
×
 The Trading Blueprint with Brad Goh - The Trading Geek
1 × $5.00
The Trading Blueprint with Brad Goh - The Trading Geek
1 × $5.00 -
×
 PRO COURSE Order Flow Strategy with Gova Trading Academy
1 × $5.00
PRO COURSE Order Flow Strategy with Gova Trading Academy
1 × $5.00 -
×
 The Complete Guide to Multiple Time Frame Analysis & Reading Price Action with Aiman Almansoori
1 × $13.00
The Complete Guide to Multiple Time Frame Analysis & Reading Price Action with Aiman Almansoori
1 × $13.00 -
×
 Channel Surfing Video Course
1 × $23.00
Channel Surfing Video Course
1 × $23.00 -
×
 Atlas Forex Trading Course
1 × $5.00
Atlas Forex Trading Course
1 × $5.00 -
×
 Advanced AmiBroker Coding with Matt Radtke & Connors Research
1 × $23.00
Advanced AmiBroker Coding with Matt Radtke & Connors Research
1 × $23.00 -
×
 FX GOAT FOREX TRADING ACADEMY
1 × $8.00
FX GOAT FOREX TRADING ACADEMY
1 × $8.00 -
×
 Crypto Trading Academy with Cheeky Investor - Aussie Day Trader
1 × $13.00
Crypto Trading Academy with Cheeky Investor - Aussie Day Trader
1 × $13.00 -
×
 Advanced Trading Course with John Person
1 × $6.00
Advanced Trading Course with John Person
1 × $6.00 -
×
 TRADING NFX Course with Andrew NFX
1 × $5.00
TRADING NFX Course with Andrew NFX
1 × $5.00 -
×
 INSIDER HEDGE FUND FORMULA (IHFF)
1 × $6.00
INSIDER HEDGE FUND FORMULA (IHFF)
1 × $6.00 -
×
 Takeover Talk The Q.U.I.C.K. Strategy to High Return, Low Risk Investing with Lou Bass
1 × $6.00
Takeover Talk The Q.U.I.C.K. Strategy to High Return, Low Risk Investing with Lou Bass
1 × $6.00 -
×
 Compass Trading System with Right Line Trading
1 × $39.00
Compass Trading System with Right Line Trading
1 × $39.00 -
×
 Road to consistent profits (Dec 2022) with Jarrod Goodwin - Trading Halls of Knowledge
1 × $31.00
Road to consistent profits (Dec 2022) with Jarrod Goodwin - Trading Halls of Knowledge
1 × $31.00 -
×
 The Ultimate Forex Structure Course
1 × $31.00
The Ultimate Forex Structure Course
1 × $31.00 -
×
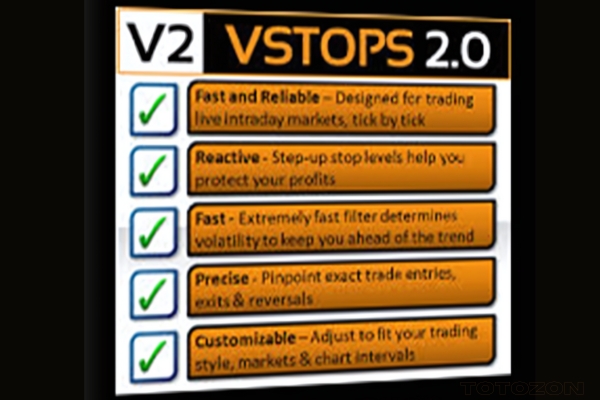 VSTOPS ProTrader Strategy (Nov 2013)
1 × $6.00
VSTOPS ProTrader Strategy (Nov 2013)
1 × $6.00 -
×
Options Trading Training – The Blend Dc with Charles Cottle
1 × $4.00
-
×
 Options Master Class
1 × $54.00
Options Master Class
1 × $54.00 -
×
 Trading Triggers - The Secrets to Profitable Trading with John Person
1 × $6.00
Trading Triggers - The Secrets to Profitable Trading with John Person
1 × $6.00 -
×
 Winning with Value Charts with Dave Stendahl
1 × $6.00
Winning with Value Charts with Dave Stendahl
1 × $6.00 -
×
 Offshore Keys (2023)
1 × $5.00
Offshore Keys (2023)
1 × $5.00 -
×
 The Power of the Hexagon
1 × $6.00
The Power of the Hexagon
1 × $6.00 -
×
 The Vest Pocket CFO (3rd Ed) with Jae Shim
1 × $6.00
The Vest Pocket CFO (3rd Ed) with Jae Shim
1 × $6.00 -
×
 The RIMS Strategy 2023
1 × $5.00
The RIMS Strategy 2023
1 × $5.00 -
×
 Opening Range Success Formula with Geoff Bysshe
1 × $4.00
Opening Range Success Formula with Geoff Bysshe
1 × $4.00 -
×
 The Power of Position Sizing Strategies SQN Secrets Revealed with Van Tharp
1 × $5.00
The Power of Position Sizing Strategies SQN Secrets Revealed with Van Tharp
1 × $5.00 -
×
 Breakouts with Feibel Trading
1 × $5.00
Breakouts with Feibel Trading
1 × $5.00 -
×
 Unreal Series - Forex Trading Master - Surreal Abilities with Talmadge Harper - Harper Healing
1 × $8.00
Unreal Series - Forex Trading Master - Surreal Abilities with Talmadge Harper - Harper Healing
1 × $8.00 -
×
 Matrix Spread Options Trading Course with Base Camp Trading
1 × $31.00
Matrix Spread Options Trading Course with Base Camp Trading
1 × $31.00 -
×
 Alfred White’s Rules of Planetary Pictures with Witte, Rudolph, Lefeldt
1 × $6.00
Alfred White’s Rules of Planetary Pictures with Witte, Rudolph, Lefeldt
1 × $6.00 -
×
 How to Overlay Technical Indicators with Keith Raphael
1 × $6.00
How to Overlay Technical Indicators with Keith Raphael
1 × $6.00 -
×
 Beat the Odds in Forex Trading: How to Identify and Profit from High Percentage Market Patterns with Igor Toshchakov
1 × $6.00
Beat the Odds in Forex Trading: How to Identify and Profit from High Percentage Market Patterns with Igor Toshchakov
1 × $6.00 -
×
 CFA Level 2 - Examination Book Afternoon Section (1999)
1 × $6.00
CFA Level 2 - Examination Book Afternoon Section (1999)
1 × $6.00 -
×
 Candlesticks MegaPackage Vol 1-4 (CCA) with Candle Charts
1 × $62.00
Candlesticks MegaPackage Vol 1-4 (CCA) with Candle Charts
1 × $62.00 -
×
 Advanced Trading Strategies
1 × $31.00
Advanced Trading Strategies
1 × $31.00 -
×
 AstuceFX Mentorship 2023
1 × $27.00
AstuceFX Mentorship 2023
1 × $27.00 -
×
 Total Fibonacci Trading with TradeSmart University
1 × $31.00
Total Fibonacci Trading with TradeSmart University
1 × $31.00 -
×
 Quantamentals - The Next Great Forefront Of Trading and Investing with Trading Markets
1 × $8.00
Quantamentals - The Next Great Forefront Of Trading and Investing with Trading Markets
1 × $8.00 -
×
 ZipTraderU 2023 with ZipTrader
1 × $5.00
ZipTraderU 2023 with ZipTrader
1 × $5.00 -
×
 Trading Mastery For Financial Freedom with Marv Eisen
1 × $10.00
Trading Mastery For Financial Freedom with Marv Eisen
1 × $10.00 -
×
 Complete Best Practices - Weekly Options Income Trading System with Weekly Options Academy
1 × $23.00
Complete Best Practices - Weekly Options Income Trading System with Weekly Options Academy
1 × $23.00 -
×
 SQX Mentorship with Tip Toe Hippo
1 × $23.00
SQX Mentorship with Tip Toe Hippo
1 × $23.00 -
×
 Zm Capitals Full course + Ebook with Zain Mokhles - ZmCapitals
1 × $31.00
Zm Capitals Full course + Ebook with Zain Mokhles - ZmCapitals
1 × $31.00 -
×
 Academy - Pick Stocks Like A Pro
1 × $15.00
Academy - Pick Stocks Like A Pro
1 × $15.00 -
×
 The Best Option Trading Course with David Jaffee - Best Stock Strategy
1 × $15.00
The Best Option Trading Course with David Jaffee - Best Stock Strategy
1 × $15.00 -
×
 Classic Indicators Back to the Future with Linda Raschke
1 × $4.00
Classic Indicators Back to the Future with Linda Raschke
1 × $4.00 -
×
 Aeron V5 Scalper+Grid
1 × $23.00
Aeron V5 Scalper+Grid
1 × $23.00 -
×
 Portfolio Management-Earn 12 Hours CE Credits
1 × $85.00
Portfolio Management-Earn 12 Hours CE Credits
1 × $85.00 -
×
 Qualitative - Financial Statement Analysis with Sandesh Banger
1 × $5.00
Qualitative - Financial Statement Analysis with Sandesh Banger
1 × $5.00 -
×
 Adaptation in Sports Training (1995) with Atko Viru
1 × $23.00
Adaptation in Sports Training (1995) with Atko Viru
1 × $23.00 -
×
 Programming in Python For Traders
1 × $78.00
Programming in Python For Traders
1 × $78.00 -
×
 WyseTrade Trading Masterclass Course
1 × $5.00
WyseTrade Trading Masterclass Course
1 × $5.00 -
×
 Advanced Management Strategies - Home Study with Pristine Capital
1 × $27.00
Advanced Management Strategies - Home Study with Pristine Capital
1 × $27.00 -
×
 Smart Money with Chart Engineers
1 × $7.00
Smart Money with Chart Engineers
1 × $7.00 -
×
 Learn To Fish Part III - How To Swing Trade for Consistent Gains with Daniel
1 × $15.00
Learn To Fish Part III - How To Swing Trade for Consistent Gains with Daniel
1 × $15.00

TTM Slingshot & Value Charts Indicators
$6.00
File Size: Coming soon!
Delivery Time: 1–12 hours
Media Type: Online Course
TTM Slingshot & Value Charts Indicators
Introduction to TTM Slingshot & Value Charts
In the dynamic world of trading, having the right tools can make all the difference. Two such powerful tools are the TTM Slingshot and Value Charts Indicators. These indicators provide traders with crucial insights, helping them navigate market complexities and make informed decisions.
Understanding TTM Slingshot
What is TTM Slingshot?
The TTM Slingshot is an advanced trading indicator developed by John Carter. It combines multiple moving averages to identify potential breakout points in the market. By analyzing the relationship between these moving averages, the TTM Slingshot helps traders spot opportunities for entering or exiting trades.
Key Features of TTM Slingshot
- Multiple Moving Averages: Uses short-term and long-term moving averages.
- Breakout Identification: Detects potential breakout points.
- Versatility: Applicable across various markets and timeframes.
Benefits of Using TTM Slingshot
Enhanced Market Analysis
The TTM Slingshot provides a detailed analysis of market trends, allowing traders to anticipate significant price movements. This indicator’s ability to pinpoint breakout points is invaluable for making timely trading decisions.
Improved Trading Accuracy
By combining multiple moving averages, the TTM Slingshot offers a comprehensive view of the market. This integration reduces noise and enhances the accuracy of predictions, leading to more successful trades.
Setting Up TTM Slingshot
Choosing the Right Platform
To utilize the TTM Slingshot, you’ll need a trading platform that supports custom indicators. Platforms like Thinkorswim and TradeStation are popular choices among traders.
Installing the Indicator
- Download the Indicator: Obtain the TTM Slingshot file compatible with your trading platform.
- Open Your Platform: Launch the trading platform.
- Add the Indicator: Navigate to the ‘Indicators’ section and add the TTM Slingshot file.
- Customize Settings: Adjust the settings to align with your trading strategy.
Understanding Value Charts Indicators
What are Value Charts Indicators?
Value Charts Indicators are tools that measure the relative value of a security based on its price history. These indicators help traders determine whether a security is overvalued, undervalued, or fairly valued, providing a clear picture of potential trading opportunities.
Key Features of Value Charts Indicators
- Relative Value Measurement: Assesses the value of a security.
- Overbought/Oversold Conditions: Identifies extreme market conditions.
- Visual Representation: Displays value levels on a chart for easy interpretation.
Benefits of Using Value Charts Indicators
Identifying Market Extremes
Value Charts Indicators are excellent for spotting overbought and oversold conditions. By identifying these extremes, traders can make strategic decisions about entering or exiting positions.
Enhancing Risk Management
These indicators aid in risk management by providing insights into the relative value of a security. Traders can use this information to set stop-loss levels and protect their investments.
Setting Up Value Charts Indicators
Selecting the Appropriate Platform
Choose a trading platform that supports Value Charts Indicators. Many modern trading platforms, such as NinjaTrader and MetaTrader, offer these indicators.
Installing the Indicator
- Download the Indicator: Obtain the Value Charts Indicator file for your platform.
- Open Your Platform: Start the trading platform.
- Add the Indicator: Go to the ‘Indicators’ section and add the Value Charts file.
- Configure Settings: Customize the settings to fit your trading approach.
How to Use TTM Slingshot & Value Charts Together
Combining Indicators for Better Insights
Using TTM Slingshot and Value Charts Indicators together can enhance your market analysis. While TTM Slingshot identifies breakout points, Value Charts Indicators help assess the relative value of the security, providing a more comprehensive view.
Practical Application
- Entry Points: Use TTM Slingshot to identify breakout points and confirm with Value Charts Indicators to ensure the security is not overvalued.
- Exit Points: Value Charts Indicators can signal overbought conditions, indicating a good time to exit, while TTM Slingshot confirms the end of a trend.
Advanced Strategies with TTM Slingshot & Value Charts
Pairing with Other Indicators
For even more robust analysis, pair TTM Slingshot and Value Charts Indicators with other tools such as RSI (Relative Strength Index) and MACD (Moving Average Convergence Divergence).
Developing a Trading Plan
Create a detailed trading plan that incorporates these indicators. Define your entry and exit points, risk management strategies, and the specific market conditions you’re targeting.
Real-Life Examples
Successful Trade Case Study
Consider a scenario where the TTM Slingshot indicates a breakout, and Value Charts Indicators show the security is undervalued. Entering a trade at this point could lead to significant profits as the price moves to its fair value.
Learning from Mistakes
Analyze trades where the indicators did not predict the expected outcome. Understanding these failures can help refine your strategy and improve future performance.
Conclusion
Maximizing Your Trading Success
The TTM Slingshot and Value Charts Indicators are powerful tools that, when used together, can significantly enhance your trading strategy. By providing insights into market trends and relative value, these indicators help you make more informed decisions.
Taking the Next Step
Start by setting up these indicators on your trading platform. Practice interpreting the signals and integrating them into your trading strategy to see the benefits firsthand.

FAQs
What is the TTM Slingshot indicator?
The TTM Slingshot is a trading tool that uses multiple moving averages to identify breakout points in the market.
How do Value Charts Indicators work?
Value Charts Indicators measure the relative value of a security, helping traders identify overbought and oversold conditions.
Can these indicators be used together?
Yes, combining TTM Slingshot and Value Charts Indicators provides a comprehensive analysis of market trends and security value.
Which platforms support these indicators?
Platforms like Thinkorswim, TradeStation, NinjaTrader, and MetaTrader support TTM Slingshot and Value Charts Indicators.
How do I install these indicators?
Download the respective indicator files, open your trading platform, and add the indicators through the ‘Indicators’ section.
Be the first to review “TTM Slingshot & Value Charts Indicators”
You must be logged in to post a review.
Related products
Forex Trading
Original price was: $499.00.$15.00Current price is: $15.00.
Original price was: $139.00.$23.00Current price is: $23.00.
Forex Trading
Original price was: $697.00.$5.00Current price is: $5.00.
Original price was: $997.00.$8.00Current price is: $8.00.
Forex Trading
Quantamentals – The Next Great Forefront Of Trading and Investing with Trading Markets
Original price was: $1,495.00.$8.00Current price is: $8.00.
Forex Trading
Original price was: $799.00.$15.00Current price is: $15.00.
Forex Trading
Original price was: $1,098.00.$39.00Current price is: $39.00.
Forex Trading
Original price was: $2,997.00.$23.00Current price is: $23.00.
Forex Trading
Original price was: $397.00.$31.00Current price is: $31.00.
Original price was: $1,800.00.$54.00Current price is: $54.00.

Original price was: $1,200.00.$23.00Current price is: $23.00.
Forex Trading
Original price was: $550.00.$5.00Current price is: $5.00.
Original price was: $799.00.$15.00Current price is: $15.00.
Original price was: $999.00.$5.00Current price is: $5.00.
Original price was: $1,849.00.$15.00Current price is: $15.00.
Original price was: $299.00.$8.00Current price is: $8.00.

Forex Trading
Original price was: $2,000.00.$23.00Current price is: $23.00.
Original price was: $310.00.$23.00Current price is: $23.00.
Forex Trading
Original price was: $999.00.$15.00Current price is: $15.00.

Forex Trading
Original price was: $4,997.00.$27.00Current price is: $27.00.

Reviews
There are no reviews yet.