-
×
 TRADING NFX Course with Andrew NFX
1 × $5.00
TRADING NFX Course with Andrew NFX
1 × $5.00 -
×
 Market Consistency: Model Calibration in Imperfect Markets with Malcolm Kemp
1 × $6.00
Market Consistency: Model Calibration in Imperfect Markets with Malcolm Kemp
1 × $6.00 -
×
 Price Action Trading 101 By Steve Burns
1 × $15.00
Price Action Trading 101 By Steve Burns
1 × $15.00 -
×
 Practical Approach to Trend Following By Rajandran R
1 × $15.00
Practical Approach to Trend Following By Rajandran R
1 × $15.00 -
×
 Exploring MetaStock Advanced with Martin Pring
1 × $6.00
Exploring MetaStock Advanced with Martin Pring
1 × $6.00 -
×
 Longlived Information & Intraday Pattern (Article) with Back and Andersen
1 × $6.00
Longlived Information & Intraday Pattern (Article) with Back and Andersen
1 × $6.00 -
×
 Order flow self-study training program with iMFtracker
1 × $10.00
Order flow self-study training program with iMFtracker
1 × $10.00 -
×
 New Market Mavericks with Geoff Cutmore
1 × $6.00
New Market Mavericks with Geoff Cutmore
1 × $6.00 -
×
 Crystal Ball Pack PLUS bonus Live Trade By Pat Mitchell - Trick Trades
1 × $20.00
Crystal Ball Pack PLUS bonus Live Trade By Pat Mitchell - Trick Trades
1 × $20.00 -
×
 VXX Made Easy By Option Pit
1 × $62.00
VXX Made Easy By Option Pit
1 × $62.00 -
×
 CBOT Seminar on Market Profile (101 & 102) with Alex Benjamin
1 × $6.00
CBOT Seminar on Market Profile (101 & 102) with Alex Benjamin
1 × $6.00 -
×
 Big Boy Volume Spread Analysis + Advanced Price Action Mastery Course with Kai Sheng Chew
1 × $15.00
Big Boy Volume Spread Analysis + Advanced Price Action Mastery Course with Kai Sheng Chew
1 × $15.00 -
×
 Advanced Risk Reversals and Rolling Thunder with Stratagem Trade
1 × $54.00
Advanced Risk Reversals and Rolling Thunder with Stratagem Trade
1 × $54.00 -
×
 Video Bundle - 4d & "Into The Abyss" with Blackrabbitfx
1 × $6.00
Video Bundle - 4d & "Into The Abyss" with Blackrabbitfx
1 × $6.00 -
×
 W. D Gann 's Square Of 9 Applied To Modern Markets with Sean Avidar - Hexatrade350
1 × $23.00
W. D Gann 's Square Of 9 Applied To Modern Markets with Sean Avidar - Hexatrade350
1 × $23.00 -
×
 Volatility and Timing with Jay Kaeppel – The Option Trader’s Guide to Probability
1 × $6.00
Volatility and Timing with Jay Kaeppel – The Option Trader’s Guide to Probability
1 × $6.00 -
×
 Long/Short Market Dynamics: Trading Strategies for Today's Markets with Clive Corcoran
1 × $6.00
Long/Short Market Dynamics: Trading Strategies for Today's Markets with Clive Corcoran
1 × $6.00 -
×
 Advanced Trading Strategies with Larry Connors
1 × $6.00
Advanced Trading Strategies with Larry Connors
1 × $6.00 -
×
 Gamma Options Boot Camp with Bigtrends
1 × $74.00
Gamma Options Boot Camp with Bigtrends
1 × $74.00 -
×
 Investment Madness with John Nofsinger
1 × $6.00
Investment Madness with John Nofsinger
1 × $6.00 -
×
 The City Traders Course with Andrew Lockwood
1 × $10.00
The City Traders Course with Andrew Lockwood
1 × $10.00 -
×
 Forex Power Strategy Course with Jason Steele
1 × $6.00
Forex Power Strategy Course with Jason Steele
1 × $6.00 -
×
 Lessons 1-30 & Tradestation Code with Charles Drummond
1 × $6.00
Lessons 1-30 & Tradestation Code with Charles Drummond
1 × $6.00 -
×
 The Best Option Trading Course with David Jaffee - Best Stock Strategy
1 × $15.00
The Best Option Trading Course with David Jaffee - Best Stock Strategy
1 × $15.00 -
×
 Adx Mastery Complete Course
1 × $6.00
Adx Mastery Complete Course
1 × $6.00 -
×
 Tradematic Trading Strategy
1 × $31.00
Tradematic Trading Strategy
1 × $31.00 -
×
 Fundamentals 101: A Comprehensive Guide to Macroeconomic, Industry, and Financial Statement Analysis Class with Jeff Bierman
1 × $6.00
Fundamentals 101: A Comprehensive Guide to Macroeconomic, Industry, and Financial Statement Analysis Class with Jeff Bierman
1 × $6.00 -
×
 The Psychology Of Trading with Brett N.Steenbarger
1 × $6.00
The Psychology Of Trading with Brett N.Steenbarger
1 × $6.00 -
×
 All About Technical Analysis with Constance Brown
1 × $6.00
All About Technical Analysis with Constance Brown
1 × $6.00 -
×
 A Comparison of Twelve Technical Trading Systems with Louis Lukac
1 × $6.00
A Comparison of Twelve Technical Trading Systems with Louis Lukac
1 × $6.00 -
×
 Essentials in Quantitative Trading QT01 By HangukQuant's
1 × $23.00
Essentials in Quantitative Trading QT01 By HangukQuant's
1 × $23.00 -
×
 The Connors Research Volatility Trading Strategy Summit
1 × $85.00
The Connors Research Volatility Trading Strategy Summit
1 × $85.00 -
×
 Get More Leads Quickly with Brittany Lynch
1 × $6.00
Get More Leads Quickly with Brittany Lynch
1 × $6.00 -
×
 7 Things You MUST Know about Forex Candlesticks
1 × $4.00
7 Things You MUST Know about Forex Candlesticks
1 × $4.00 -
×
 The Offshore Money Book with Arnold Cornez
1 × $6.00
The Offshore Money Book with Arnold Cornez
1 × $6.00 -
×
 Algo Trading Masterclass with Ali Casey - StatOasis
1 × $23.00
Algo Trading Masterclass with Ali Casey - StatOasis
1 × $23.00 -
×
 Guide To Selling High Probability Spreads Class with Don Kaufman
1 × $6.00
Guide To Selling High Probability Spreads Class with Don Kaufman
1 × $6.00 -
×
 $20 – 52k 20 pips a day challange with Rafał Zuchowicz - TopMasterTrader
1 × $5.00
$20 – 52k 20 pips a day challange with Rafał Zuchowicz - TopMasterTrader
1 × $5.00 -
×
 HST Mobile
1 × $31.00
HST Mobile
1 × $31.00 -
×
 Inside the Minds Leading Wall Street Investors with Aspatore Books
1 × $6.00
Inside the Minds Leading Wall Street Investors with Aspatore Books
1 × $6.00 -
×
 Compass Trading System with Right Line Trading
1 × $39.00
Compass Trading System with Right Line Trading
1 × $39.00 -
×
 The Complete Lot Flipper System
1 × $6.00
The Complete Lot Flipper System
1 × $6.00 -
×
 Zap Seminar - Ablesys
1 × $6.00
Zap Seminar - Ablesys
1 × $6.00 -
×
 Commodity Options: Trading and Hedging Volatility in the World’s Most Lucrative Market with Carley Garner & Paul Brittain
1 × $6.00
Commodity Options: Trading and Hedging Volatility in the World’s Most Lucrative Market with Carley Garner & Paul Brittain
1 × $6.00 -
×
 Forex Trading Course with Mike Norman
1 × $17.00
Forex Trading Course with Mike Norman
1 × $17.00 -
×
 Scalp Strategy and Flipping Small Accounts with Opes Trading Group
1 × $5.00
Scalp Strategy and Flipping Small Accounts with Opes Trading Group
1 × $5.00 -
×
 Activedaytrader - Workshop: Practical Money Management
1 × $23.00
Activedaytrader - Workshop: Practical Money Management
1 × $23.00 -
×
 Online Trading Stocks - Cryptocurrencies & Forex with Set & Forget
1 × $5.00
Online Trading Stocks - Cryptocurrencies & Forex with Set & Forget
1 × $5.00 -
×
 Prasna Tantra. Horary Astrology with Bangalore Venkata Raman
1 × $6.00
Prasna Tantra. Horary Astrology with Bangalore Venkata Raman
1 × $6.00 -
×
 A Bull in China with Jim Rogers
1 × $6.00
A Bull in China with Jim Rogers
1 × $6.00 -
×
 Trading MoneyTides & Chaos in the Stock Market with Hans Hannula
1 × $6.00
Trading MoneyTides & Chaos in the Stock Market with Hans Hannula
1 × $6.00 -
×
 All in One Forex Course with VintagEducation
1 × $31.00
All in One Forex Course with VintagEducation
1 × $31.00 -
×
 Oliver Velez - Core, Swing, Guerrilla, Momentum Trading, Micro Trading Tactics
1 × $23.00
Oliver Velez - Core, Swing, Guerrilla, Momentum Trading, Micro Trading Tactics
1 × $23.00 -
×
 0 DTE Options Trading Workshop with Aeromir Corporation
1 × $15.00
0 DTE Options Trading Workshop with Aeromir Corporation
1 × $15.00 -
×
 Trading by the Minute - Joe Ross
1 × $6.00
Trading by the Minute - Joe Ross
1 × $6.00 -
×
 Best of the Best: Collars with Amy Meissner & Scott Ruble
1 × $15.00
Best of the Best: Collars with Amy Meissner & Scott Ruble
1 × $15.00 -
×
 How to Trade Stock Options Course
1 × $6.00
How to Trade Stock Options Course
1 × $6.00 -
×
 INVESTOPEDIA - BECOME A DAY TRADER
1 × $15.00
INVESTOPEDIA - BECOME A DAY TRADER
1 × $15.00 -
×
 Mastering the Orderbook with Rowan Crawford
1 × $6.00
Mastering the Orderbook with Rowan Crawford
1 × $6.00 -
×
 Options, Futures, and Other Derivative Securities
1 × $6.00
Options, Futures, and Other Derivative Securities
1 × $6.00 -
×
 Deep Dive Butterfly Trading Strategy Class with SJG Trades
1 × $41.00
Deep Dive Butterfly Trading Strategy Class with SJG Trades
1 × $41.00 -
×
 Inefficient Markets with Andrei Shleifer
1 × $6.00
Inefficient Markets with Andrei Shleifer
1 × $6.00 -
×
 High Probability Trading Using Elliott Wave And Fibonacci Analysis withVic Patel - Forex Training Group
1 × $10.00
High Probability Trading Using Elliott Wave And Fibonacci Analysis withVic Patel - Forex Training Group
1 × $10.00 -
×
 ART Online 4 Weeks Home Study Course with Bennett McDowell
1 × $78.00
ART Online 4 Weeks Home Study Course with Bennett McDowell
1 × $78.00 -
×
 A Game Plan for Investing in the 21st Century with Thomas J.Dorsey
1 × $6.00
A Game Plan for Investing in the 21st Century with Thomas J.Dorsey
1 × $6.00 -
×
 Ichimoku Cloud Trading System Class with Jeff Bierman
1 × $6.00
Ichimoku Cloud Trading System Class with Jeff Bierman
1 × $6.00 -
×
 Advanced Trading System - How To 10x Your Trading Skillsets & Results with The Trade Academy
1 × $6.00
Advanced Trading System - How To 10x Your Trading Skillsets & Results with The Trade Academy
1 × $6.00 -
×
 Pattern Trader Pro with ForexStore
1 × $6.00
Pattern Trader Pro with ForexStore
1 × $6.00 -
×
 Breakout Trading Systems with Chris Tate
1 × $6.00
Breakout Trading Systems with Chris Tate
1 × $6.00 -
×
 Seasonal Stock Market Trends: The Definitive Guide to Calendar‐Based Stock Market Trading with Jay Kaeppel
1 × $6.00
Seasonal Stock Market Trends: The Definitive Guide to Calendar‐Based Stock Market Trading with Jay Kaeppel
1 × $6.00 -
×
 Wyckoff Analysis Series. Module 1. Wyckoff Volume Analysis
1 × $6.00
Wyckoff Analysis Series. Module 1. Wyckoff Volume Analysis
1 × $6.00 -
×
 FXjake Daily Trader Program
1 × $31.00
FXjake Daily Trader Program
1 × $31.00 -
×
 Patterns of Speculation with Bertrand M.Roehner
1 × $6.00
Patterns of Speculation with Bertrand M.Roehner
1 × $6.00 -
×
 Successful Stock Speculation (1922) with John James
1 × $6.00
Successful Stock Speculation (1922) with John James
1 × $6.00 -
×
 Spread Trading E-Trading Stagionale (Italian) with Joe Ross
1 × $6.00
Spread Trading E-Trading Stagionale (Italian) with Joe Ross
1 × $6.00 -
×
 The Naked Eye: Raw Data Analytics with Edgar Torres - Raw Data Analytics
1 × $8.00
The Naked Eye: Raw Data Analytics with Edgar Torres - Raw Data Analytics
1 × $8.00 -
×
 Applying Fibonacci Analysis to Price Action
1 × $6.00
Applying Fibonacci Analysis to Price Action
1 × $6.00 -
×
 Sector Rotation & Market Timing with Frank Barbera
1 × $6.00
Sector Rotation & Market Timing with Frank Barbera
1 × $6.00 -
×
 Street-Smart Chart Reading – Volume 1 – The Rudiments with Donald G.Worden
1 × $6.00
Street-Smart Chart Reading – Volume 1 – The Rudiments with Donald G.Worden
1 × $6.00 -
×
 Online Course: Forex Trading By Fxtc.co
1 × $5.00
Online Course: Forex Trading By Fxtc.co
1 × $5.00 -
×
 Crypto Trading Academy with Cheeky Investor - Aussie Day Trader
1 × $13.00
Crypto Trading Academy with Cheeky Investor - Aussie Day Trader
1 × $13.00 -
×
 Options Trading & Ultimate MasterClass With Tyrone Abela - FX Evolution
1 × $54.00
Options Trading & Ultimate MasterClass With Tyrone Abela - FX Evolution
1 × $54.00 -
×
 OTC Oracle Course - PENNY WHALE with Simple Trade
1 × $31.00
OTC Oracle Course - PENNY WHALE with Simple Trade
1 × $31.00 -
×
 Ultimate Trading Course with Dodgy's Dungeon
1 × $8.00
Ultimate Trading Course with Dodgy's Dungeon
1 × $8.00 -
×
 Long-Term Memory in the Stock Market Prices (Article) with Andrew W.Lo
1 × $6.00
Long-Term Memory in the Stock Market Prices (Article) with Andrew W.Lo
1 × $6.00 -
×
 3 Volatility Strategies with Quantified Strategies
1 × $23.00
3 Volatility Strategies with Quantified Strategies
1 × $23.00 -
×
 The Great Reflation with Anthony Boeckh
1 × $6.00
The Great Reflation with Anthony Boeckh
1 × $6.00 -
×
 YouAreTheIndicator Online Course 1.0
1 × $6.00
YouAreTheIndicator Online Course 1.0
1 × $6.00 -
×
 ICT Prodigy Trading Course – $650K in Payouts with Alex Solignani
1 × $15.00
ICT Prodigy Trading Course – $650K in Payouts with Alex Solignani
1 × $15.00 -
×
 Matrix Spread Options Trading Course with Base Camp Trading
1 × $31.00
Matrix Spread Options Trading Course with Base Camp Trading
1 × $31.00 -
×
 FX Childs Play System
1 × $6.00
FX Childs Play System
1 × $6.00 -
×
 George Wollsten: Expert Stock and Grain Trader with George Bayer
1 × $6.00
George Wollsten: Expert Stock and Grain Trader with George Bayer
1 × $6.00 -
×
 Becoming Rich with Mark Tier
1 × $6.00
Becoming Rich with Mark Tier
1 × $6.00 -
×
 Maximum Returns with Infinity Spreads Class with Don Kaufman
1 × $6.00
Maximum Returns with Infinity Spreads Class with Don Kaufman
1 × $6.00 -
×
 The Whale Trade Workshop Plus One Week of Live Trading with Doc Severson
1 × $6.00
The Whale Trade Workshop Plus One Week of Live Trading with Doc Severson
1 × $6.00 -
×
 6 Live Sentiment Analysis Trading Bots using Python with The A.I. Whisperer
1 × $5.00
6 Live Sentiment Analysis Trading Bots using Python with The A.I. Whisperer
1 × $5.00 -
×
 Advanced Swing Trading with John Crane
1 × $6.00
Advanced Swing Trading with John Crane
1 × $6.00 -
×
 Apteros Trading Fall Intensive 2021 - Trading Intensive
1 × $54.00
Apteros Trading Fall Intensive 2021 - Trading Intensive
1 × $54.00 -
×
 Market Tide indicator with Alphashark
1 × $54.00
Market Tide indicator with Alphashark
1 × $54.00 -
×
 Andy’s EMini Bar – 40 Min System with Joe Ross
1 × $6.00
Andy’s EMini Bar – 40 Min System with Joe Ross
1 × $6.00 -
×
 WondaFX Signature Strategy with WondaFX
1 × $5.00
WondaFX Signature Strategy with WondaFX
1 × $5.00 -
×
 Options, Futures & Other Derivatives (5th Ed.)
1 × $6.00
Options, Futures & Other Derivatives (5th Ed.)
1 × $6.00 -
×
 Short-Term Trading with Precision Timing - Jack Bernstein
1 × $6.00
Short-Term Trading with Precision Timing - Jack Bernstein
1 × $6.00 -
×
 Forex Supreme Course with Ethan Wilson
1 × $6.00
Forex Supreme Course with Ethan Wilson
1 × $6.00 -
×
 Kaizen On-Demand By Candle Charts
1 × $6.00
Kaizen On-Demand By Candle Charts
1 × $6.00 -
×
 The Prop Trading Code with Brannigan Barrett - Axia Futures
1 × $23.00
The Prop Trading Code with Brannigan Barrett - Axia Futures
1 × $23.00 -
×
 Mechanising Some of the World’s Classic Trading Systems with Murray Ruggiero
1 × $7.00
Mechanising Some of the World’s Classic Trading Systems with Murray Ruggiero
1 × $7.00 -
×
 The Precision Profit Float Indicator (TS Code & Setups) with Steve Woods
1 × $6.00
The Precision Profit Float Indicator (TS Code & Setups) with Steve Woods
1 × $6.00 -
×
 SE ELITE COURSE with SE TRADINGX
1 × $5.00
SE ELITE COURSE with SE TRADINGX
1 × $5.00 -
×
 Forex Courses Collection
1 × $55.00
Forex Courses Collection
1 × $55.00 -
×
 Quantamentals - The Next Great Forefront Of Trading and Investing with Trading Markets
1 × $8.00
Quantamentals - The Next Great Forefront Of Trading and Investing with Trading Markets
1 × $8.00 -
×
 YTC Price Action Trader
1 × $6.00
YTC Price Action Trader
1 × $6.00 -
×
 Daily Price Action
1 × $23.00
Daily Price Action
1 × $23.00 -
×
 Investment Blunders with John Nofsinger
1 × $6.00
Investment Blunders with John Nofsinger
1 × $6.00 -
×
 TradeCraft: Your Path to Peak Performance Trading By Adam Grimes
1 × $15.00
TradeCraft: Your Path to Peak Performance Trading By Adam Grimes
1 × $15.00 -
×
 Point and Figure Mentorship Course
1 × $54.00
Point and Figure Mentorship Course
1 × $54.00 -
×
 5 Basic Elliott Wave Patterns + Technical Tools = Trading Success with Jeffrey Kennedy
1 × $15.00
5 Basic Elliott Wave Patterns + Technical Tools = Trading Success with Jeffrey Kennedy
1 × $15.00 -
×
 Seller Specialist Program with Chris Prefontaine
1 × $62.00
Seller Specialist Program with Chris Prefontaine
1 × $62.00 -
×
 Bond Market Course with The Macro Compass
1 × $15.00
Bond Market Course with The Macro Compass
1 × $15.00 -
×
 Introduction To Market Turning Points Caused - The Demand & Supply Of Big Banks Institution - Golden Bridge Trading
1 × $6.00
Introduction To Market Turning Points Caused - The Demand & Supply Of Big Banks Institution - Golden Bridge Trading
1 × $6.00 -
×
 Advanced Fibonacci Course with Major League Trading
1 × $23.00
Advanced Fibonacci Course with Major League Trading
1 × $23.00 -
×
 Art & Science of Trend Trading Class with Jeff Bierman
1 × $6.00
Art & Science of Trend Trading Class with Jeff Bierman
1 × $6.00 -
×
 Special Webinars Module 1 with Trader Dante
1 × $6.00
Special Webinars Module 1 with Trader Dante
1 × $6.00 -
×
 AI For Traders with Trading Markets
1 × $31.00
AI For Traders with Trading Markets
1 × $31.00

TTM Slingshot & Value Charts Indicators
$6.00
File Size: Coming soon!
Delivery Time: 1–12 hours
Media Type: Online Course
TTM Slingshot & Value Charts Indicators
Introduction to TTM Slingshot & Value Charts
In the dynamic world of trading, having the right tools can make all the difference. Two such powerful tools are the TTM Slingshot and Value Charts Indicators. These indicators provide traders with crucial insights, helping them navigate market complexities and make informed decisions.
Understanding TTM Slingshot
What is TTM Slingshot?
The TTM Slingshot is an advanced trading indicator developed by John Carter. It combines multiple moving averages to identify potential breakout points in the market. By analyzing the relationship between these moving averages, the TTM Slingshot helps traders spot opportunities for entering or exiting trades.
Key Features of TTM Slingshot
- Multiple Moving Averages: Uses short-term and long-term moving averages.
- Breakout Identification: Detects potential breakout points.
- Versatility: Applicable across various markets and timeframes.
Benefits of Using TTM Slingshot
Enhanced Market Analysis
The TTM Slingshot provides a detailed analysis of market trends, allowing traders to anticipate significant price movements. This indicator’s ability to pinpoint breakout points is invaluable for making timely trading decisions.
Improved Trading Accuracy
By combining multiple moving averages, the TTM Slingshot offers a comprehensive view of the market. This integration reduces noise and enhances the accuracy of predictions, leading to more successful trades.
Setting Up TTM Slingshot
Choosing the Right Platform
To utilize the TTM Slingshot, you’ll need a trading platform that supports custom indicators. Platforms like Thinkorswim and TradeStation are popular choices among traders.
Installing the Indicator
- Download the Indicator: Obtain the TTM Slingshot file compatible with your trading platform.
- Open Your Platform: Launch the trading platform.
- Add the Indicator: Navigate to the ‘Indicators’ section and add the TTM Slingshot file.
- Customize Settings: Adjust the settings to align with your trading strategy.
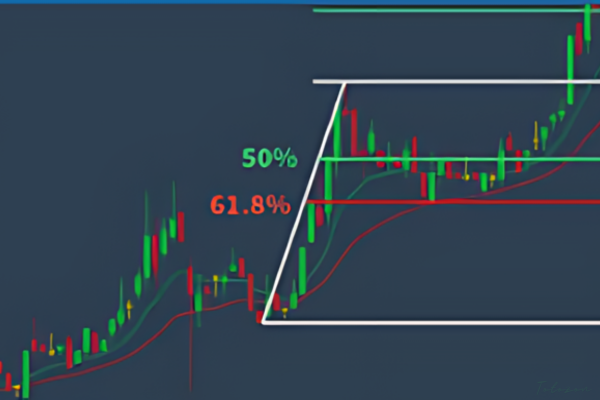
Understanding Value Charts Indicators
What are Value Charts Indicators?
Value Charts Indicators are tools that measure the relative value of a security based on its price history. These indicators help traders determine whether a security is overvalued, undervalued, or fairly valued, providing a clear picture of potential trading opportunities.
Key Features of Value Charts Indicators
- Relative Value Measurement: Assesses the value of a security.
- Overbought/Oversold Conditions: Identifies extreme market conditions.
- Visual Representation: Displays value levels on a chart for easy interpretation.
Benefits of Using Value Charts Indicators
Identifying Market Extremes
Value Charts Indicators are excellent for spotting overbought and oversold conditions. By identifying these extremes, traders can make strategic decisions about entering or exiting positions.
Enhancing Risk Management
These indicators aid in risk management by providing insights into the relative value of a security. Traders can use this information to set stop-loss levels and protect their investments.
Setting Up Value Charts Indicators
Selecting the Appropriate Platform
Choose a trading platform that supports Value Charts Indicators. Many modern trading platforms, such as NinjaTrader and MetaTrader, offer these indicators.
Installing the Indicator
- Download the Indicator: Obtain the Value Charts Indicator file for your platform.
- Open Your Platform: Start the trading platform.
- Add the Indicator: Go to the ‘Indicators’ section and add the Value Charts file.
- Configure Settings: Customize the settings to fit your trading approach.
How to Use TTM Slingshot & Value Charts Together
Combining Indicators for Better Insights
Using TTM Slingshot and Value Charts Indicators together can enhance your market analysis. While TTM Slingshot identifies breakout points, Value Charts Indicators help assess the relative value of the security, providing a more comprehensive view.
Practical Application
- Entry Points: Use TTM Slingshot to identify breakout points and confirm with Value Charts Indicators to ensure the security is not overvalued.
- Exit Points: Value Charts Indicators can signal overbought conditions, indicating a good time to exit, while TTM Slingshot confirms the end of a trend.
Advanced Strategies with TTM Slingshot & Value Charts
Pairing with Other Indicators
For even more robust analysis, pair TTM Slingshot and Value Charts Indicators with other tools such as RSI (Relative Strength Index) and MACD (Moving Average Convergence Divergence).
Developing a Trading Plan
Create a detailed trading plan that incorporates these indicators. Define your entry and exit points, risk management strategies, and the specific market conditions you’re targeting.
Real-Life Examples
Successful Trade Case Study
Consider a scenario where the TTM Slingshot indicates a breakout, and Value Charts Indicators show the security is undervalued. Entering a trade at this point could lead to significant profits as the price moves to its fair value.
Learning from Mistakes
Analyze trades where the indicators did not predict the expected outcome. Understanding these failures can help refine your strategy and improve future performance.
Conclusion
Maximizing Your Trading Success
The TTM Slingshot and Value Charts Indicators are powerful tools that, when used together, can significantly enhance your trading strategy. By providing insights into market trends and relative value, these indicators help you make more informed decisions.
Taking the Next Step
Start by setting up these indicators on your trading platform. Practice interpreting the signals and integrating them into your trading strategy to see the benefits firsthand.

FAQs
What is the TTM Slingshot indicator?
The TTM Slingshot is a trading tool that uses multiple moving averages to identify breakout points in the market.
How do Value Charts Indicators work?
Value Charts Indicators measure the relative value of a security, helping traders identify overbought and oversold conditions.
Can these indicators be used together?
Yes, combining TTM Slingshot and Value Charts Indicators provides a comprehensive analysis of market trends and security value.
Which platforms support these indicators?
Platforms like Thinkorswim, TradeStation, NinjaTrader, and MetaTrader support TTM Slingshot and Value Charts Indicators.
How do I install these indicators?
Download the respective indicator files, open your trading platform, and add the indicators through the ‘Indicators’ section.
Be the first to review “TTM Slingshot & Value Charts Indicators”
You must be logged in to post a review.
Related products

Forex Trading
Original price was: $397.00.$31.00Current price is: $31.00.
Forex Trading
Original price was: $999.00.$15.00Current price is: $15.00.
Forex Trading
Original price was: $2,995.00.$31.00Current price is: $31.00.

Forex Trading
The Complete Guide to Multiple Time Frame Analysis & Reading Price Action with Aiman Almansoori
Original price was: $1,399.00.$13.00Current price is: $13.00.

Forex Trading
Original price was: $4,997.00.$27.00Current price is: $27.00.
Forex Trading
Original price was: $797.00.$10.00Current price is: $10.00.
Original price was: $1,800.00.$54.00Current price is: $54.00.

Original price was: $450.00.$23.00Current price is: $23.00.
Original price was: $799.00.$15.00Current price is: $15.00.
Forex Trading
Original price was: $2,000.00.$23.00Current price is: $23.00.
Original price was: $695.00.$41.00Current price is: $41.00.
Forex Trading
Original price was: $850.00.$23.00Current price is: $23.00.

Forex Trading
Original price was: $125.00.$17.00Current price is: $17.00.
Original price was: $2,120.00.$15.00Current price is: $15.00.
Forex Trading
Original price was: $550.00.$5.00Current price is: $5.00.
Original price was: $1,200.00.$23.00Current price is: $23.00.
Original price was: $197.00.$5.00Current price is: $5.00.

Forex Trading
Original price was: $2,997.00.$23.00Current price is: $23.00.

Forex Trading
Original price was: $799.00.$15.00Current price is: $15.00.

Original price was: $895.00.$15.00Current price is: $15.00.

Reviews
There are no reviews yet.