-
×
 Dan Sheridan 360 Degrees of Trading Class
1 × $6.00
Dan Sheridan 360 Degrees of Trading Class
1 × $6.00 -
×
 Short Term Accelerated Returns Workshop (Video) with Nick Van Nice
1 × $6.00
Short Term Accelerated Returns Workshop (Video) with Nick Van Nice
1 × $6.00 -
×
 Compound Stock Earnings Master Class 2009 Ft Worth Tx September 12 13 DVD set
1 × $6.00
Compound Stock Earnings Master Class 2009 Ft Worth Tx September 12 13 DVD set
1 × $6.00 -
×
 Futures Trading Blueprint with Day Trader Next Door
1 × $5.00
Futures Trading Blueprint with Day Trader Next Door
1 × $5.00 -
×
 The TradingKey - Mastering Elliott Wave by Rob Roy 2010 + Complete Workbooks with HUBB Financial
1 × $6.00
The TradingKey - Mastering Elliott Wave by Rob Roy 2010 + Complete Workbooks with HUBB Financial
1 × $6.00 -
×
 Dumb Money: Adventures of a Day Trader with Joey Anuff
1 × $6.00
Dumb Money: Adventures of a Day Trader with Joey Anuff
1 × $6.00 -
×
 The Taylor Trading Technique with G.Douglas Taylor
1 × $6.00
The Taylor Trading Technique with G.Douglas Taylor
1 × $6.00 -
×
 Ultimate Trading Course with Dodgy's Dungeon
1 × $8.00
Ultimate Trading Course with Dodgy's Dungeon
1 × $8.00 -
×
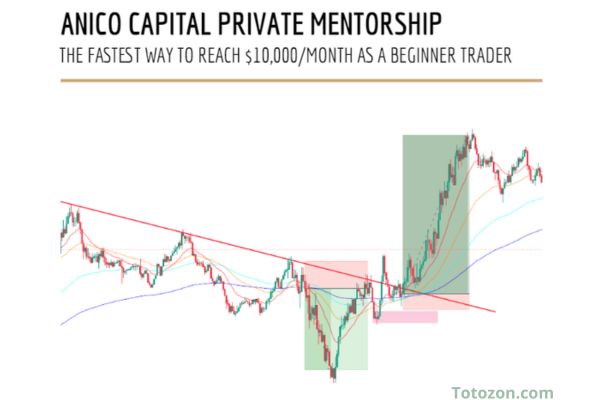 Private Mentorship with ANICO Capital
1 × $10.00
Private Mentorship with ANICO Capital
1 × $10.00 -
×
 The Insider's Guide to 52 Homes in 52 Weeks: Acquire Your Real Estate Fortune Today with Dolf De Roos
1 × $6.00
The Insider's Guide to 52 Homes in 52 Weeks: Acquire Your Real Estate Fortune Today with Dolf De Roos
1 × $6.00 -
×
 Trading with Wave59 with Earik Beann
1 × $6.00
Trading with Wave59 with Earik Beann
1 × $6.00 -
×
 The Next Big Short Class (Risk Twist Spreads) Class with Don Kaufman
1 × $6.00
The Next Big Short Class (Risk Twist Spreads) Class with Don Kaufman
1 × $6.00 -
×
 Advanced Option Trading with Broken Wing Butterflys with Greg Loehr
1 × $9.00
Advanced Option Trading with Broken Wing Butterflys with Greg Loehr
1 × $9.00 -
×
 Advanced Nuances & Exceptions eCourse with Jim Dalton
1 × $15.00
Advanced Nuances & Exceptions eCourse with Jim Dalton
1 × $15.00 -
×
 The Instagram DM Automation Playbook with Natasha Takahashi
1 × $6.00
The Instagram DM Automation Playbook with Natasha Takahashi
1 × $6.00 -
×
 Dan Sheridan 2011 Calendar Workshop
1 × $6.00
Dan Sheridan 2011 Calendar Workshop
1 × $6.00 -
×
 The Orderflow Masterclass with PrimeTrading
1 × $17.00
The Orderflow Masterclass with PrimeTrading
1 × $17.00 -
×
 Renko Profits Accelerator
1 × $15.00
Renko Profits Accelerator
1 × $15.00 -
×
 Simpler Traders - Ultimate Guide to Debit Spreads (PREMIUM)
1 × $39.00
Simpler Traders - Ultimate Guide to Debit Spreads (PREMIUM)
1 × $39.00 -
×
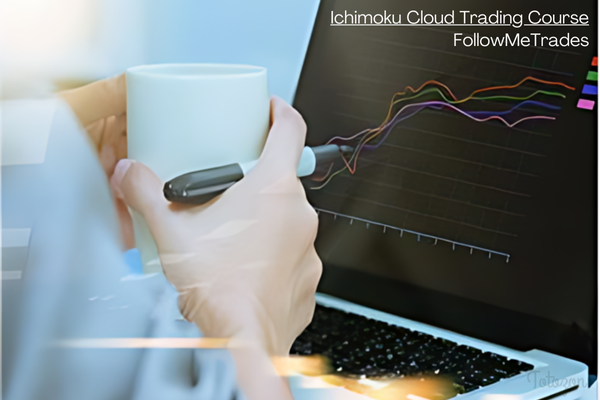 Ichimoku Cloud Trading Course with FollowMeTrades
1 × $15.00
Ichimoku Cloud Trading Course with FollowMeTrades
1 × $15.00 -
×
 Sample Item Sets 2003 - CFA Level 3
1 × $6.00
Sample Item Sets 2003 - CFA Level 3
1 × $6.00 -
×
 Trade with Precision Price Action Course Silver+Bronze By Nick McDonald
1 × $116.00
Trade with Precision Price Action Course Silver+Bronze By Nick McDonald
1 × $116.00 -
×
 The Tape Reader’s Bundle with The Price Action Room
1 × $62.00
The Tape Reader’s Bundle with The Price Action Room
1 × $62.00 -
×
 Super CD Companion for Metastock with Martin Pring
1 × $6.00
Super CD Companion for Metastock with Martin Pring
1 × $6.00 -
×
 60 Minute Trader with Chris Kobewka
1 × $6.00
60 Minute Trader with Chris Kobewka
1 × $6.00 -
×
 Tape Reading Trader Program (Full 4 hours) with The Daytrading Room
1 × $6.00
Tape Reading Trader Program (Full 4 hours) with The Daytrading Room
1 × $6.00 -
×
 We Fund Traders - The Whale Order
1 × $5.00
We Fund Traders - The Whale Order
1 × $5.00 -
×
 CM Pivot Power Trade Method with Austin Passamonte
1 × $6.00
CM Pivot Power Trade Method with Austin Passamonte
1 × $6.00 -
×
 Volatility Master Class
1 × $62.00
Volatility Master Class
1 × $62.00 -
×
 Essentials Of Payroll Management & Accounting with Steven M.Bragg
1 × $6.00
Essentials Of Payroll Management & Accounting with Steven M.Bragg
1 × $6.00 -
×
 Guide To Selling High Probability Spreads Class with Don Kaufman
1 × $6.00
Guide To Selling High Probability Spreads Class with Don Kaufman
1 × $6.00 -
×
 A14 Weekly Options Strategy Workshop 2023 with Amy Meissner - Aeromir
1 × $23.00
A14 Weekly Options Strategy Workshop 2023 with Amy Meissner - Aeromir
1 × $23.00 -
×
 The Indices Orderflow Masterclass with The Forex Scalpers
1 × $23.00
The Indices Orderflow Masterclass with The Forex Scalpers
1 × $23.00 -
×
 Collection of Articles and Webinars with Sunil Mangwani [9 Videos (FLVs) + 14 eBooks
1 × $6.00
Collection of Articles and Webinars with Sunil Mangwani [9 Videos (FLVs) + 14 eBooks
1 × $6.00 -
×
 The Insider's Guide to Forex Trading with Kathy Lien
1 × $6.00
The Insider's Guide to Forex Trading with Kathy Lien
1 × $6.00 -
×
 The Psychology Of Trading with Brett N.Steenbarger
1 × $6.00
The Psychology Of Trading with Brett N.Steenbarger
1 × $6.00 -
×
 Strategy, Value and Risk - The Real Options Approach with Jamie Rogers
1 × $6.00
Strategy, Value and Risk - The Real Options Approach with Jamie Rogers
1 × $6.00 -
×
 Analysis Of Entry Signals (Technicals) with Joe Marwood
1 × $15.00
Analysis Of Entry Signals (Technicals) with Joe Marwood
1 × $15.00 -
×
 Infectious Greed with John Nofsinger & Kenneth Kim
1 × $6.00
Infectious Greed with John Nofsinger & Kenneth Kim
1 × $6.00 -
×
 Tandem Trader with Investors Underground
1 × $6.00
Tandem Trader with Investors Underground
1 × $6.00 -
×
 Fierce 10 with Mandi Rafsendjani
1 × $5.00
Fierce 10 with Mandi Rafsendjani
1 × $5.00 -
×
 How I Trade for a Living with Gary Smith
1 × $6.00
How I Trade for a Living with Gary Smith
1 × $6.00 -
×
 Advanced Pattern Trader Course with Trade Empowered
1 × $23.00
Advanced Pattern Trader Course with Trade Empowered
1 × $23.00 -
×
 The Top Tier Pro System Basic with Raghee Horner
1 × $41.00
The Top Tier Pro System Basic with Raghee Horner
1 × $41.00 -
×
 Dow Theory for the 21st Century: Technical Indicators for Improving Your Investment Results with Jack Schannep
1 × $6.00
Dow Theory for the 21st Century: Technical Indicators for Improving Your Investment Results with Jack Schannep
1 × $6.00 -
×
 Trading Psychology Masterclass with Jared Tendler - TraderLion
1 × $5.00
Trading Psychology Masterclass with Jared Tendler - TraderLion
1 × $5.00 -
×
 The Complete Guide to Option Selling, 2nd 2009 with James Cordier & Michael Gross
1 × $6.00
The Complete Guide to Option Selling, 2nd 2009 with James Cordier & Michael Gross
1 × $6.00 -
×
 The City Traders Course with Andrew Lockwood
1 × $10.00
The City Traders Course with Andrew Lockwood
1 × $10.00 -
×
 The Next Wealth Transfer Investing in Gold and Silver
1 × $6.00
The Next Wealth Transfer Investing in Gold and Silver
1 × $6.00 -
×
 Street Smarts & TS Code with Larry Connors & Linda Bradford Rashcke
1 × $6.00
Street Smarts & TS Code with Larry Connors & Linda Bradford Rashcke
1 × $6.00 -
×
 Forecast 2024 Clarification with Larry Williams
1 × $15.00
Forecast 2024 Clarification with Larry Williams
1 × $15.00 -
×
 Smart Money Trading Course with Prosperity Academy
1 × $5.00
Smart Money Trading Course with Prosperity Academy
1 × $5.00 -
×
 Breakthroughs in Technical Analysis: New Thinking From the World's Top Minds (1st Edition) with David Keller
1 × $6.00
Breakthroughs in Technical Analysis: New Thinking From the World's Top Minds (1st Edition) with David Keller
1 × $6.00 -
×
 Advanced Options Trading with Lucas Downey
1 × $15.00
Advanced Options Trading with Lucas Downey
1 × $15.00 -
×
 Complete Forex Training Series with 4 x Made Easy
1 × $6.00
Complete Forex Training Series with 4 x Made Easy
1 × $6.00 -
×
 The Cash Flow Bootcamp with John Macgregor
1 × $233.00
The Cash Flow Bootcamp with John Macgregor
1 × $233.00 -
×
 The Management of Equity Investments with Dimitris Chorafas
1 × $6.00
The Management of Equity Investments with Dimitris Chorafas
1 × $6.00 -
×
 Trading Natural Resources in a Volatile Market with Kevin Kerr
1 × $6.00
Trading Natural Resources in a Volatile Market with Kevin Kerr
1 × $6.00 -
×
 How to Trade a Vertical Market
1 × $93.00
How to Trade a Vertical Market
1 × $93.00 -
×
 Advanced Price Action Course with ZenFX
1 × $5.00
Advanced Price Action Course with ZenFX
1 × $5.00 -
×
 Beginner's Guide to Trading Intraday Futures Class with Don Kaufman
1 × $6.00
Beginner's Guide to Trading Intraday Futures Class with Don Kaufman
1 × $6.00 -
×
 Daytraders Bulletin – Recurrent Structures for Profit with Charles Holt
1 × $6.00
Daytraders Bulletin – Recurrent Structures for Profit with Charles Holt
1 × $6.00 -
×
 The Orderflows Trade Opportunities Encyclopedia with Michael Valtos
1 × $8.00
The Orderflows Trade Opportunities Encyclopedia with Michael Valtos
1 × $8.00 -
×
 TradingWithBilz Course
1 × $10.00
TradingWithBilz Course
1 × $10.00 -
×
 Technical Analysis Applications in the Global Currency Markets (2nd Ed.) with Cornelius Luca
1 × $6.00
Technical Analysis Applications in the Global Currency Markets (2nd Ed.) with Cornelius Luca
1 × $6.00 -
×
 AM Trader - Strategy Training Course
1 × $23.00
AM Trader - Strategy Training Course
1 × $23.00 -
×
 Trading For A Living Course with Yvan Byeajee - Trading Composure
1 × $6.00
Trading For A Living Course with Yvan Byeajee - Trading Composure
1 × $6.00 -
×
 Andy’s EMini Bar – 40 Min System with Joe Ross
1 × $6.00
Andy’s EMini Bar – 40 Min System with Joe Ross
1 × $6.00 -
×
 The Truth About Day Trading Stocks with Josh DiPietro
1 × $6.00
The Truth About Day Trading Stocks with Josh DiPietro
1 × $6.00 -
×
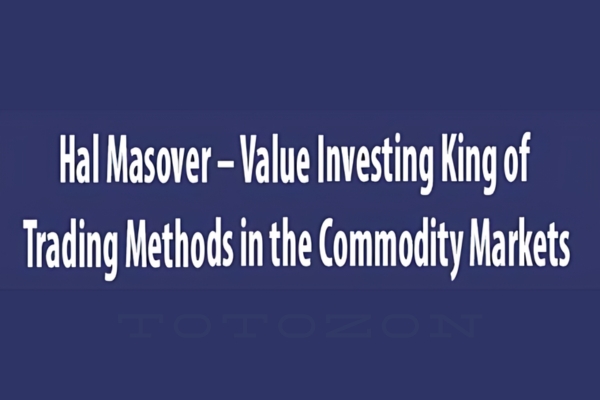 Value Investing King of Trading Methods in the Commodity Markets - Hal Masover
1 × $6.00
Value Investing King of Trading Methods in the Commodity Markets - Hal Masover
1 × $6.00 -
×
 Bulletproof Butterflies 2.0 2022 (PREMIUM) with Bruce Marshall
1 × $23.00
Bulletproof Butterflies 2.0 2022 (PREMIUM) with Bruce Marshall
1 × $23.00 -
×
 Fibsdontlie - Fibs Don’t Lie Advanced Course
1 × $15.00
Fibsdontlie - Fibs Don’t Lie Advanced Course
1 × $15.00 -
×
 Advanced Trading Course with DovyFX
1 × $5.00
Advanced Trading Course with DovyFX
1 × $5.00 -
×
 Scientific Forex with Cristina Ciurea
1 × $6.00
Scientific Forex with Cristina Ciurea
1 × $6.00 -
×
 Using Robert’s Indicators with Rob Hoffman
1 × $6.00
Using Robert’s Indicators with Rob Hoffman
1 × $6.00 -
×
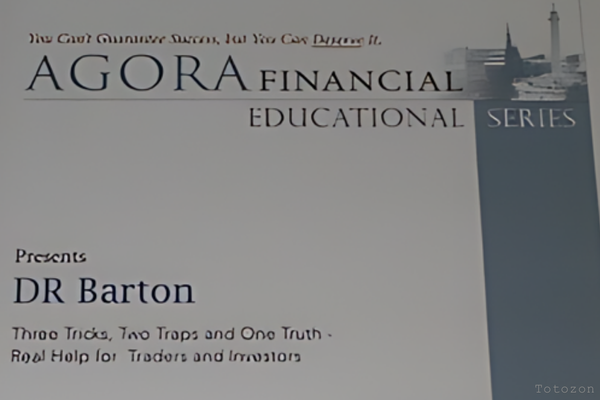 Three Tricks, Two Traps, One Truth Real Help for Traders and Investors with D.R.Barton
1 × $6.00
Three Tricks, Two Traps, One Truth Real Help for Traders and Investors with D.R.Barton
1 × $6.00 -
×
 TRADINGWITHRAYNER - PRICE ACTION TRADING INSTITUTE
1 × $23.00
TRADINGWITHRAYNER - PRICE ACTION TRADING INSTITUTE
1 × $23.00 -
×
 Defending Options with Simpler Options
1 × $6.00
Defending Options with Simpler Options
1 × $6.00 -
×
 Beat the Bear with Jea Yu
1 × $6.00
Beat the Bear with Jea Yu
1 × $6.00 -
×
 CFA Level 3- Examination Morning Session – Essay (2004)
1 × $6.00
CFA Level 3- Examination Morning Session – Essay (2004)
1 × $6.00 -
×
 The Illustrated Guide to Technical Analysis Signals and Phrases with Constance Brown
1 × $6.00
The Illustrated Guide to Technical Analysis Signals and Phrases with Constance Brown
1 × $6.00 -
×
 Learn to Make Money Trading Options
1 × $6.00
Learn to Make Money Trading Options
1 × $6.00 -
×
 Advanced Spread Trading with Guy Bower - MasterClass Trader
1 × $15.00
Advanced Spread Trading with Guy Bower - MasterClass Trader
1 × $15.00 -
×
 VXX Made Easy By Option Pit
1 × $62.00
VXX Made Easy By Option Pit
1 × $62.00 -
×
 Advanced Trading System - How To 10x Your Trading Skillsets & Results with The Trade Academy
1 × $6.00
Advanced Trading System - How To 10x Your Trading Skillsets & Results with The Trade Academy
1 × $6.00 -
×
 Best & Simple Forex day trading strategy with Forex day trading
1 × $5.00
Best & Simple Forex day trading strategy with Forex day trading
1 × $5.00 -
×
 The Complete Guide to Multiple Time Frame Analysis & Reading Price Action with Aiman Almansoori
1 × $13.00
The Complete Guide to Multiple Time Frame Analysis & Reading Price Action with Aiman Almansoori
1 × $13.00

TTM Slingshot & Value Charts Indicators
$6.00
File Size: Coming soon!
Delivery Time: 1–12 hours
Media Type: Online Course
TTM Slingshot & Value Charts Indicators
Introduction to TTM Slingshot & Value Charts
In the dynamic world of trading, having the right tools can make all the difference. Two such powerful tools are the TTM Slingshot and Value Charts Indicators. These indicators provide traders with crucial insights, helping them navigate market complexities and make informed decisions.
Understanding TTM Slingshot
What is TTM Slingshot?
The TTM Slingshot is an advanced trading indicator developed by John Carter. It combines multiple moving averages to identify potential breakout points in the market. By analyzing the relationship between these moving averages, the TTM Slingshot helps traders spot opportunities for entering or exiting trades.
Key Features of TTM Slingshot
- Multiple Moving Averages: Uses short-term and long-term moving averages.
- Breakout Identification: Detects potential breakout points.
- Versatility: Applicable across various markets and timeframes.
Benefits of Using TTM Slingshot
Enhanced Market Analysis
The TTM Slingshot provides a detailed analysis of market trends, allowing traders to anticipate significant price movements. This indicator’s ability to pinpoint breakout points is invaluable for making timely trading decisions.
Improved Trading Accuracy
By combining multiple moving averages, the TTM Slingshot offers a comprehensive view of the market. This integration reduces noise and enhances the accuracy of predictions, leading to more successful trades.
Setting Up TTM Slingshot
Choosing the Right Platform
To utilize the TTM Slingshot, you’ll need a trading platform that supports custom indicators. Platforms like Thinkorswim and TradeStation are popular choices among traders.
Installing the Indicator
- Download the Indicator: Obtain the TTM Slingshot file compatible with your trading platform.
- Open Your Platform: Launch the trading platform.
- Add the Indicator: Navigate to the ‘Indicators’ section and add the TTM Slingshot file.
- Customize Settings: Adjust the settings to align with your trading strategy.
Understanding Value Charts Indicators
What are Value Charts Indicators?
Value Charts Indicators are tools that measure the relative value of a security based on its price history. These indicators help traders determine whether a security is overvalued, undervalued, or fairly valued, providing a clear picture of potential trading opportunities.
Key Features of Value Charts Indicators
- Relative Value Measurement: Assesses the value of a security.
- Overbought/Oversold Conditions: Identifies extreme market conditions.
- Visual Representation: Displays value levels on a chart for easy interpretation.
Benefits of Using Value Charts Indicators
Identifying Market Extremes
Value Charts Indicators are excellent for spotting overbought and oversold conditions. By identifying these extremes, traders can make strategic decisions about entering or exiting positions.
Enhancing Risk Management
These indicators aid in risk management by providing insights into the relative value of a security. Traders can use this information to set stop-loss levels and protect their investments.
Setting Up Value Charts Indicators
Selecting the Appropriate Platform
Choose a trading platform that supports Value Charts Indicators. Many modern trading platforms, such as NinjaTrader and MetaTrader, offer these indicators.
Installing the Indicator
- Download the Indicator: Obtain the Value Charts Indicator file for your platform.
- Open Your Platform: Start the trading platform.
- Add the Indicator: Go to the ‘Indicators’ section and add the Value Charts file.
- Configure Settings: Customize the settings to fit your trading approach.
How to Use TTM Slingshot & Value Charts Together
Combining Indicators for Better Insights
Using TTM Slingshot and Value Charts Indicators together can enhance your market analysis. While TTM Slingshot identifies breakout points, Value Charts Indicators help assess the relative value of the security, providing a more comprehensive view.
Practical Application
- Entry Points: Use TTM Slingshot to identify breakout points and confirm with Value Charts Indicators to ensure the security is not overvalued.
- Exit Points: Value Charts Indicators can signal overbought conditions, indicating a good time to exit, while TTM Slingshot confirms the end of a trend.
Advanced Strategies with TTM Slingshot & Value Charts
Pairing with Other Indicators
For even more robust analysis, pair TTM Slingshot and Value Charts Indicators with other tools such as RSI (Relative Strength Index) and MACD (Moving Average Convergence Divergence).
Developing a Trading Plan
Create a detailed trading plan that incorporates these indicators. Define your entry and exit points, risk management strategies, and the specific market conditions you’re targeting.
Real-Life Examples
Successful Trade Case Study
Consider a scenario where the TTM Slingshot indicates a breakout, and Value Charts Indicators show the security is undervalued. Entering a trade at this point could lead to significant profits as the price moves to its fair value.
Learning from Mistakes
Analyze trades where the indicators did not predict the expected outcome. Understanding these failures can help refine your strategy and improve future performance.
Conclusion
Maximizing Your Trading Success
The TTM Slingshot and Value Charts Indicators are powerful tools that, when used together, can significantly enhance your trading strategy. By providing insights into market trends and relative value, these indicators help you make more informed decisions.
Taking the Next Step
Start by setting up these indicators on your trading platform. Practice interpreting the signals and integrating them into your trading strategy to see the benefits firsthand.

FAQs
What is the TTM Slingshot indicator?
The TTM Slingshot is a trading tool that uses multiple moving averages to identify breakout points in the market.
How do Value Charts Indicators work?
Value Charts Indicators measure the relative value of a security, helping traders identify overbought and oversold conditions.
Can these indicators be used together?
Yes, combining TTM Slingshot and Value Charts Indicators provides a comprehensive analysis of market trends and security value.
Which platforms support these indicators?
Platforms like Thinkorswim, TradeStation, NinjaTrader, and MetaTrader support TTM Slingshot and Value Charts Indicators.
How do I install these indicators?
Download the respective indicator files, open your trading platform, and add the indicators through the ‘Indicators’ section.
Be the first to review “TTM Slingshot & Value Charts Indicators”
You must be logged in to post a review.
Related products

Forex Trading
Original price was: $499.00.$15.00Current price is: $15.00.

Forex Trading
Original price was: $397.00.$31.00Current price is: $31.00.

Original price was: $997.00.$13.00Current price is: $13.00.

Forex Trading
Original price was: $999.00.$15.00Current price is: $15.00.

Original price was: $999.00.$5.00Current price is: $5.00.

Forex Trading
Original price was: $850.00.$23.00Current price is: $23.00.

Original price was: $649.00.$20.00Current price is: $20.00.

Original price was: $1,849.00.$15.00Current price is: $15.00.

Forex Trading
Original price was: $4,997.00.$27.00Current price is: $27.00.
Original price was: $895.00.$15.00Current price is: $15.00.

Original price was: $497.00.$31.00Current price is: $31.00.

Original price was: $695.00.$41.00Current price is: $41.00.

Original price was: $497.00.$11.00Current price is: $11.00.
Forex Trading
Original price was: $239.00.$8.00Current price is: $8.00.

Original price was: $2,120.00.$15.00Current price is: $15.00.
Forex Trading
Original price was: $1,898.00.$10.00Current price is: $10.00.

Original price was: $700.00.$39.00Current price is: $39.00.

Forex Trading
Original price was: $500.00.$5.00Current price is: $5.00.
Forex Trading
Original price was: $249.00.$15.00Current price is: $15.00.

Original price was: $4,995.00.$15.00Current price is: $15.00.

Reviews
There are no reviews yet.