-
×
 Becoming Rich with Mark Tier
1 × $6.00
Becoming Rich with Mark Tier
1 × $6.00 -
×
 Trading the Moves - Consistent Gains in All Markets with Ed Downs
1 × $6.00
Trading the Moves - Consistent Gains in All Markets with Ed Downs
1 × $6.00 -
×
 Matrix Spread Options Trading Course with Base Camp Trading
1 × $31.00
Matrix Spread Options Trading Course with Base Camp Trading
1 × $31.00 -
×
 How to Get Rich Buying Stocks with Ira U.Cobleigh
1 × $6.00
How to Get Rich Buying Stocks with Ira U.Cobleigh
1 × $6.00 -
×
 The Trading Blueprint with Brad Goh - The Trading Geek
1 × $5.00
The Trading Blueprint with Brad Goh - The Trading Geek
1 × $5.00 -
×
 The TradingKey - Mastering Elliott Wave by Rob Roy 2010 + Complete Workbooks with HUBB Financial
1 × $6.00
The TradingKey - Mastering Elliott Wave by Rob Roy 2010 + Complete Workbooks with HUBB Financial
1 × $6.00 -
×
 Top 20 VSA Principles & How to Trade Them
1 × $31.00
Top 20 VSA Principles & How to Trade Them
1 × $31.00 -
×
 High Probability Option Trading - Seasonal Straddles
1 × $6.00
High Probability Option Trading - Seasonal Straddles
1 × $6.00 -
×
 The Indices Orderflow Masterclass with The Forex Scalpers
1 × $23.00
The Indices Orderflow Masterclass with The Forex Scalpers
1 × $23.00 -
×
 The Complete Guide to Multiple Time Frame Analysis & Reading Price Action with Aiman Almansoori
1 × $13.00
The Complete Guide to Multiple Time Frame Analysis & Reading Price Action with Aiman Almansoori
1 × $13.00 -
×
 Trade Stocks and Commodities with the Insiders. Secrets of the COT Report with Larry Williams
1 × $6.00
Trade Stocks and Commodities with the Insiders. Secrets of the COT Report with Larry Williams
1 × $6.00 -
×
 Top Ultimate Breakout with Top Trade Tools
1 × $6.00
Top Ultimate Breakout with Top Trade Tools
1 × $6.00 -
×
 Trading Systems Explained with Martin Pring
1 × $6.00
Trading Systems Explained with Martin Pring
1 × $6.00 -
×
 Black Gold Strategies
1 × $23.00
Black Gold Strategies
1 × $23.00 -
×
 Time, Price & Pattern with John Crane
1 × $6.00
Time, Price & Pattern with John Crane
1 × $6.00 -
×
 The Handbook of Commodity Investing with Frank Fabozzi, Roland Fuss & Dieter Kaiser
1 × $6.00
The Handbook of Commodity Investing with Frank Fabozzi, Roland Fuss & Dieter Kaiser
1 × $6.00 -
×
 Overnight Profit Strategy PRO with Allison Ostrander
1 × $6.00
Overnight Profit Strategy PRO with Allison Ostrander
1 × $6.00 -
×
 Trading Rules that Work
1 × $6.00
Trading Rules that Work
1 × $6.00 -
×
 How to Trade Choppy, Sideways Markets with Wayne Gorman - Elliott Wave International
1 × $6.00
How to Trade Choppy, Sideways Markets with Wayne Gorman - Elliott Wave International
1 × $6.00 -
×
 Options Trading & Ultimate MasterClass With Tyrone Abela - FX Evolution
1 × $54.00
Options Trading & Ultimate MasterClass With Tyrone Abela - FX Evolution
1 × $54.00 -
×
 Weekly Options Windfall and Bonus with James Preston
1 × $54.00
Weekly Options Windfall and Bonus with James Preston
1 × $54.00 -
×
 VintagEducation - The Fast Track Forex Bootcamp
1 × $6.00
VintagEducation - The Fast Track Forex Bootcamp
1 × $6.00 -
×
 Tom Williams Final Mentorship Course
1 × $6.00
Tom Williams Final Mentorship Course
1 × $6.00 -
×
 Beginners Guide to Swing Trading Growth Stocks with Brandon Chapman
1 × $5.00
Beginners Guide to Swing Trading Growth Stocks with Brandon Chapman
1 × $5.00 -
×
 Backtrade Marathon NEW with Real Life Trading
1 × $23.00
Backtrade Marathon NEW with Real Life Trading
1 × $23.00 -
×
 Weekly Options Boot Camp with Price Headley
1 × $15.00
Weekly Options Boot Camp with Price Headley
1 × $15.00 -
×
 ZipTraderU 2023 with ZipTrader
1 × $5.00
ZipTraderU 2023 with ZipTrader
1 × $5.00 -
×
 The TLM Playbook 2022 with Trade Like Mike
1 × $39.00
The TLM Playbook 2022 with Trade Like Mike
1 × $39.00 -
×
 Bear Trading For Profit Profit From Stock Market Crashes
1 × $6.00
Bear Trading For Profit Profit From Stock Market Crashes
1 × $6.00 -
×
 Index Funds with Mark Hebner
1 × $6.00
Index Funds with Mark Hebner
1 × $6.00 -
×
 Trident. A Trading Strategy with Charles L.Lindsay
1 × $6.00
Trident. A Trading Strategy with Charles L.Lindsay
1 × $6.00 -
×
 The Sellers Code Master Class with Flip2Freedom
1 × $31.00
The Sellers Code Master Class with Flip2Freedom
1 × $31.00 -
×
 Applying Fibonacci Analysis to Price Action
1 × $6.00
Applying Fibonacci Analysis to Price Action
1 × $6.00 -
×
 Beat the Odds in Forex Trading: How to Identify and Profit from High Percentage Market Patterns with Igor Toshchakov
1 × $6.00
Beat the Odds in Forex Trading: How to Identify and Profit from High Percentage Market Patterns with Igor Toshchakov
1 × $6.00 -
×
 Yin Yang Forex Training Program
1 × $85.00
Yin Yang Forex Training Program
1 × $85.00 -
×
 Stock Options Day Trading Mindset for Success with Allen Maxwell, Scott Paton, & Scott Alex
1 × $5.00
Stock Options Day Trading Mindset for Success with Allen Maxwell, Scott Paton, & Scott Alex
1 × $5.00 -
×
 M3-4u Trading System with John Locke
1 × $5.00
M3-4u Trading System with John Locke
1 × $5.00 -
×
 Creating & Using a Trading Plan with Paul Lange
1 × $8.00
Creating & Using a Trading Plan with Paul Lange
1 × $8.00 -
×
 Charting the Major Forex Pairs: Focus on Major Currencies with James Bickford
1 × $6.00
Charting the Major Forex Pairs: Focus on Major Currencies with James Bickford
1 × $6.00 -
×
 Time Trap System with Alex Krzhechevsky
1 × $6.00
Time Trap System with Alex Krzhechevsky
1 × $6.00 -
×
 How To Develop A Winning Trading System That Fits You Home Study + Audio - 2020 with Van Tharp
1 × $62.00
How To Develop A Winning Trading System That Fits You Home Study + Audio - 2020 with Van Tharp
1 × $62.00 -
×
 Objective Evaluation of Indicators with Constance Brown
1 × $6.00
Objective Evaluation of Indicators with Constance Brown
1 × $6.00 -
×
 Strees Relief for Traders Workshop with Adrienne Laris Toghraie
1 × $6.00
Strees Relief for Traders Workshop with Adrienne Laris Toghraie
1 × $6.00 -
×
 $20 – 52k 20 pips a day challange with Rafał Zuchowicz - TopMasterTrader
1 × $5.00
$20 – 52k 20 pips a day challange with Rafał Zuchowicz - TopMasterTrader
1 × $5.00 -
×
 License to Steal with John Carlton
1 × $6.00
License to Steal with John Carlton
1 × $6.00 -
×
 Timing the Market with Unique Indicators with Sherman McCellan
1 × $6.00
Timing the Market with Unique Indicators with Sherman McCellan
1 × $6.00 -
×
 LIVE TRADERS - TECHNICAL STOCK TRADING
1 × $23.00
LIVE TRADERS - TECHNICAL STOCK TRADING
1 × $23.00 -
×
 Crystal Ball Pack PLUS bonus Live Trade By Pat Mitchell - Trick Trades
1 × $20.00
Crystal Ball Pack PLUS bonus Live Trade By Pat Mitchell - Trick Trades
1 × $20.00 -
×
 ZR Trading Complete Program (Arabic + French)
1 × $10.00
ZR Trading Complete Program (Arabic + French)
1 × $10.00 -
×
 AI For Traders with Trading Markets
1 × $31.00
AI For Traders with Trading Markets
1 × $31.00 -
×
 Beat the Bear with Jea Yu
1 × $6.00
Beat the Bear with Jea Yu
1 × $6.00 -
×
 Basecamptrading - Naked Trading Part 2
1 × $6.00
Basecamptrading - Naked Trading Part 2
1 × $6.00 -
×
 Compass Trading System with Right Line Trading
1 × $39.00
Compass Trading System with Right Line Trading
1 × $39.00 -
×
 Trading Short TermSame Day Trades Sep 2023 with Dan Sheridan & Mark Fenton - Sheridan Options Mentoring
1 × $31.00
Trading Short TermSame Day Trades Sep 2023 with Dan Sheridan & Mark Fenton - Sheridan Options Mentoring
1 × $31.00 -
×
 Trading with MORE Special Set-ups - Recorded Webinar
1 × $15.00
Trading with MORE Special Set-ups - Recorded Webinar
1 × $15.00 -
×
 Be Smart, Act Fast, Get Rich with Charles Payne
1 × $6.00
Be Smart, Act Fast, Get Rich with Charles Payne
1 × $6.00 -
×
 Professional Trader Training Programme with Jarrat Davis
1 × $39.00
Professional Trader Training Programme with Jarrat Davis
1 × $39.00 -
×
 Zap Seminar - David Stendahl – Day Trading the E-Minis
1 × $6.00
Zap Seminar - David Stendahl – Day Trading the E-Minis
1 × $6.00 -
×
 Advanced Elliott Wave Analysis : Complex Patterns, Intermarket Relationships, and Global Cash Flow Analysis
1 × $6.00
Advanced Elliott Wave Analysis : Complex Patterns, Intermarket Relationships, and Global Cash Flow Analysis
1 × $6.00 -
×
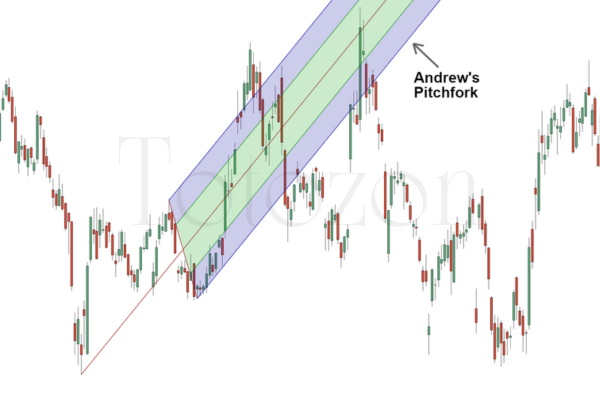 Andrews Pitchfork Basic
1 × $6.00
Andrews Pitchfork Basic
1 × $6.00 -
×
 Vajex Trading Mentorship Program
1 × $13.00
Vajex Trading Mentorship Program
1 × $13.00 -
×
 SQX Mentorship with Tip Toe Hippo
1 × $23.00
SQX Mentorship with Tip Toe Hippo
1 × $23.00 -
×
 Trading Mastery Course 2009
1 × $6.00
Trading Mastery Course 2009
1 × $6.00 -
×
 VSA Advanced Mentorship Course
1 × $31.00
VSA Advanced Mentorship Course
1 × $31.00 -
×
 Academy - Pick Stocks Like A Pro
1 × $15.00
Academy - Pick Stocks Like A Pro
1 × $15.00 -
×
 60 Seconds Sure Shot Strategy with Albert E
1 × $6.00
60 Seconds Sure Shot Strategy with Albert E
1 × $6.00 -
×
 Big Profit Patterns Using Candlestick Signals & Gaps with Stephen W.Bigalow
1 × $6.00
Big Profit Patterns Using Candlestick Signals & Gaps with Stephen W.Bigalow
1 × $6.00 -
×
 Use The Moon – A Trading System with MARKET OCCULTATIONS
1 × $27.00
Use The Moon – A Trading System with MARKET OCCULTATIONS
1 × $27.00 -
×
 Valuation of Internet & Technology Stocks with Brian Kettell
1 × $6.00
Valuation of Internet & Technology Stocks with Brian Kettell
1 × $6.00 -
×
 Astrology & Stock Market Forecasting with Louise McWhirter
1 × $4.00
Astrology & Stock Market Forecasting with Louise McWhirter
1 × $4.00 -
×
 Aeron V5 Scalper+Grid
1 × $23.00
Aeron V5 Scalper+Grid
1 × $23.00 -
×
 Bear Market Strategies eLearning Course - Kirk - Van Tharp Institute
1 × $85.00
Bear Market Strategies eLearning Course - Kirk - Van Tharp Institute
1 × $85.00 -
×
 The Zone Trader Training Series with Timon Weller
1 × $8.00
The Zone Trader Training Series with Timon Weller
1 × $8.00 -
×
 Chart Analysis Boot Camp Course Webinar with Mike Albright
1 × $6.00
Chart Analysis Boot Camp Course Webinar with Mike Albright
1 × $6.00 -
×
 Million Dollar Bond Strategies Video with Paul Judd
1 × $6.00
Million Dollar Bond Strategies Video with Paul Judd
1 × $6.00 -
×
 Toast FX Course
1 × $5.00
Toast FX Course
1 × $5.00 -
×
 Market Risk Analysis, Volume III, Pricing, Hedging and Trading Financial Instruments with Carol Alexander
1 × $6.00
Market Risk Analysis, Volume III, Pricing, Hedging and Trading Financial Instruments with Carol Alexander
1 × $6.00 -
×
 Trading System Building Blocks with John Hill
1 × $6.00
Trading System Building Blocks with John Hill
1 × $6.00 -
×
 Mean Reversion Strategy with The Chartist
1 × $78.00
Mean Reversion Strategy with The Chartist
1 × $78.00 -
×
 Trading the Post with Ron Friedman
1 × $5.00
Trading the Post with Ron Friedman
1 × $5.00 -
×
 Trading High-Momentum Stocks with Landry Persistent Pullbacks
1 × $15.00
Trading High-Momentum Stocks with Landry Persistent Pullbacks
1 × $15.00 -
×
 Day Trading Systems & Methods with Charles Le Beau, David Lucas
1 × $6.00
Day Trading Systems & Methods with Charles Le Beau, David Lucas
1 × $6.00 -
×
 Trade Like a Stock Market Wizard with Mark Minervini
1 × $6.00
Trade Like a Stock Market Wizard with Mark Minervini
1 × $6.00 -
×
 Ultimate Trading Course with Dodgy's Dungeon
1 × $8.00
Ultimate Trading Course with Dodgy's Dungeon
1 × $8.00 -
×
 30 Days to Market Mastery: A Step-by-Step Guide to Profitable Trading with Jack Bernstein
1 × $6.00
30 Days to Market Mastery: A Step-by-Step Guide to Profitable Trading with Jack Bernstein
1 × $6.00 -
×
 The Power of Beliefs in Trading with Gabriel Grammatidis - Van Tharp
1 × $13.00
The Power of Beliefs in Trading with Gabriel Grammatidis - Van Tharp
1 × $13.00 -
×
 0 DTE Options Trading Workshop with Aeromir Corporation
1 × $15.00
0 DTE Options Trading Workshop with Aeromir Corporation
1 × $15.00 -
×
 Winning the Losers Game with Charles Ellis
1 × $6.00
Winning the Losers Game with Charles Ellis
1 × $6.00 -
×
 Advanced Trading Strategies with Larry Connors
1 × $6.00
Advanced Trading Strategies with Larry Connors
1 × $6.00 -
×
 War Room Psychology Vol.3 with Trick Trades
1 × $23.00
War Room Psychology Vol.3 with Trick Trades
1 × $23.00 -
×
 Forecast, Filings, & News with Jtrader
1 × $6.00
Forecast, Filings, & News with Jtrader
1 × $6.00 -
×
 Trading Course 2024 with ZMC x BMO
1 × $17.00
Trading Course 2024 with ZMC x BMO
1 × $17.00 -
×
 Trading to Win (Seminar WorkBook 2003) with Bruce Gilmore
1 × $6.00
Trading to Win (Seminar WorkBook 2003) with Bruce Gilmore
1 × $6.00 -
×
 Dan Sheridan 360 Degrees of Trading Class
1 × $6.00
Dan Sheridan 360 Degrees of Trading Class
1 × $6.00 -
×
 Crypto Trading Academy with Cheeky Investor - Aussie Day Trader
1 × $13.00
Crypto Trading Academy with Cheeky Investor - Aussie Day Trader
1 × $13.00 -
×
 Options, Futures & Other Derivatives (6th Ed.)
1 × $6.00
Options, Futures & Other Derivatives (6th Ed.)
1 × $6.00 -
×
 AbleTrend with John Wang & Grace Wang
1 × $6.00
AbleTrend with John Wang & Grace Wang
1 × $6.00 -
×
 Workshop: The Best Way to Trade Stock Movement
1 × $6.00
Workshop: The Best Way to Trade Stock Movement
1 × $6.00 -
×
 Maximum Lots Trading Course with Joe Wright
1 × $34.00
Maximum Lots Trading Course with Joe Wright
1 × $34.00 -
×
 Trading With an Edge with Bruce Gilmore
1 × $6.00
Trading With an Edge with Bruce Gilmore
1 × $6.00 -
×
 Mastering Metatrader 4 in 90 Minutes & Members Site with Alan Benefield
1 × $15.00
Mastering Metatrader 4 in 90 Minutes & Members Site with Alan Benefield
1 × $15.00 -
×
 How to Profit in Gold with Jonathan Spall
1 × $6.00
How to Profit in Gold with Jonathan Spall
1 × $6.00 -
×
 Simple Setups For Consistent Profits with Base Camp Trading
1 × $6.00
Simple Setups For Consistent Profits with Base Camp Trading
1 × $6.00 -
×
 Back to the Futures
1 × $31.00
Back to the Futures
1 × $31.00 -
×
 WondaFX Signature Strategy with WondaFX
1 × $5.00
WondaFX Signature Strategy with WondaFX
1 × $5.00 -
×
 Trading for a Living with Alexander Elder
1 × $6.00
Trading for a Living with Alexander Elder
1 × $6.00 -
×
 Essentials in Quantitative Trading QT01 By HangukQuant's
1 × $23.00
Essentials in Quantitative Trading QT01 By HangukQuant's
1 × $23.00 -
×
 The Spiral Calendar and Its Effect on Financial Markets and Human Events with Christopher Carolan
1 × $6.00
The Spiral Calendar and Its Effect on Financial Markets and Human Events with Christopher Carolan
1 × $6.00 -
×
 Wysetrade Forex Masterclass 3.0
1 × $6.00
Wysetrade Forex Masterclass 3.0
1 × $6.00 -
×
 How to Consistently Win Trading Stocks in 30 Days or Less
1 × $15.00
How to Consistently Win Trading Stocks in 30 Days or Less
1 × $15.00 -
×
 Cobra (aka Viper Crude)
1 × $23.00
Cobra (aka Viper Crude)
1 × $23.00

TTM Slingshot & Value Charts Indicators
$6.00
File Size: Coming soon!
Delivery Time: 1–12 hours
Media Type: Online Course
TTM Slingshot & Value Charts Indicators
Introduction to TTM Slingshot & Value Charts
In the dynamic world of trading, having the right tools can make all the difference. Two such powerful tools are the TTM Slingshot and Value Charts Indicators. These indicators provide traders with crucial insights, helping them navigate market complexities and make informed decisions.
Understanding TTM Slingshot
What is TTM Slingshot?
The TTM Slingshot is an advanced trading indicator developed by John Carter. It combines multiple moving averages to identify potential breakout points in the market. By analyzing the relationship between these moving averages, the TTM Slingshot helps traders spot opportunities for entering or exiting trades.
Key Features of TTM Slingshot
- Multiple Moving Averages: Uses short-term and long-term moving averages.
- Breakout Identification: Detects potential breakout points.
- Versatility: Applicable across various markets and timeframes.
Benefits of Using TTM Slingshot
Enhanced Market Analysis
The TTM Slingshot provides a detailed analysis of market trends, allowing traders to anticipate significant price movements. This indicator’s ability to pinpoint breakout points is invaluable for making timely trading decisions.
Improved Trading Accuracy
By combining multiple moving averages, the TTM Slingshot offers a comprehensive view of the market. This integration reduces noise and enhances the accuracy of predictions, leading to more successful trades.
Setting Up TTM Slingshot
Choosing the Right Platform
To utilize the TTM Slingshot, you’ll need a trading platform that supports custom indicators. Platforms like Thinkorswim and TradeStation are popular choices among traders.
Installing the Indicator
- Download the Indicator: Obtain the TTM Slingshot file compatible with your trading platform.
- Open Your Platform: Launch the trading platform.
- Add the Indicator: Navigate to the ‘Indicators’ section and add the TTM Slingshot file.
- Customize Settings: Adjust the settings to align with your trading strategy.
Understanding Value Charts Indicators
What are Value Charts Indicators?
Value Charts Indicators are tools that measure the relative value of a security based on its price history. These indicators help traders determine whether a security is overvalued, undervalued, or fairly valued, providing a clear picture of potential trading opportunities.
Key Features of Value Charts Indicators
- Relative Value Measurement: Assesses the value of a security.
- Overbought/Oversold Conditions: Identifies extreme market conditions.
- Visual Representation: Displays value levels on a chart for easy interpretation.
Benefits of Using Value Charts Indicators
Identifying Market Extremes
Value Charts Indicators are excellent for spotting overbought and oversold conditions. By identifying these extremes, traders can make strategic decisions about entering or exiting positions.
Enhancing Risk Management
These indicators aid in risk management by providing insights into the relative value of a security. Traders can use this information to set stop-loss levels and protect their investments.
Setting Up Value Charts Indicators
Selecting the Appropriate Platform
Choose a trading platform that supports Value Charts Indicators. Many modern trading platforms, such as NinjaTrader and MetaTrader, offer these indicators.
Installing the Indicator
- Download the Indicator: Obtain the Value Charts Indicator file for your platform.
- Open Your Platform: Start the trading platform.
- Add the Indicator: Go to the ‘Indicators’ section and add the Value Charts file.
- Configure Settings: Customize the settings to fit your trading approach.
How to Use TTM Slingshot & Value Charts Together
Combining Indicators for Better Insights
Using TTM Slingshot and Value Charts Indicators together can enhance your market analysis. While TTM Slingshot identifies breakout points, Value Charts Indicators help assess the relative value of the security, providing a more comprehensive view.
Practical Application
- Entry Points: Use TTM Slingshot to identify breakout points and confirm with Value Charts Indicators to ensure the security is not overvalued.
- Exit Points: Value Charts Indicators can signal overbought conditions, indicating a good time to exit, while TTM Slingshot confirms the end of a trend.
Advanced Strategies with TTM Slingshot & Value Charts
Pairing with Other Indicators
For even more robust analysis, pair TTM Slingshot and Value Charts Indicators with other tools such as RSI (Relative Strength Index) and MACD (Moving Average Convergence Divergence).
Developing a Trading Plan
Create a detailed trading plan that incorporates these indicators. Define your entry and exit points, risk management strategies, and the specific market conditions you’re targeting.
Real-Life Examples
Successful Trade Case Study
Consider a scenario where the TTM Slingshot indicates a breakout, and Value Charts Indicators show the security is undervalued. Entering a trade at this point could lead to significant profits as the price moves to its fair value.
Learning from Mistakes
Analyze trades where the indicators did not predict the expected outcome. Understanding these failures can help refine your strategy and improve future performance.
Conclusion
Maximizing Your Trading Success
The TTM Slingshot and Value Charts Indicators are powerful tools that, when used together, can significantly enhance your trading strategy. By providing insights into market trends and relative value, these indicators help you make more informed decisions.
Taking the Next Step
Start by setting up these indicators on your trading platform. Practice interpreting the signals and integrating them into your trading strategy to see the benefits firsthand.

FAQs
What is the TTM Slingshot indicator?
The TTM Slingshot is a trading tool that uses multiple moving averages to identify breakout points in the market.
How do Value Charts Indicators work?
Value Charts Indicators measure the relative value of a security, helping traders identify overbought and oversold conditions.
Can these indicators be used together?
Yes, combining TTM Slingshot and Value Charts Indicators provides a comprehensive analysis of market trends and security value.
Which platforms support these indicators?
Platforms like Thinkorswim, TradeStation, NinjaTrader, and MetaTrader support TTM Slingshot and Value Charts Indicators.
How do I install these indicators?
Download the respective indicator files, open your trading platform, and add the indicators through the ‘Indicators’ section.
Be the first to review “TTM Slingshot & Value Charts Indicators”
You must be logged in to post a review.
Related products

Original price was: $497.00.$11.00Current price is: $11.00.
Forex Trading
Original price was: $850.00.$23.00Current price is: $23.00.
Forex Trading
Original price was: $550.00.$5.00Current price is: $5.00.

Original price was: $999.00.$5.00Current price is: $5.00.

Forex Trading
Original price was: $249.00.$15.00Current price is: $15.00.

Forex Trading
Original price was: $125.00.$17.00Current price is: $17.00.

Original price was: $2,120.00.$15.00Current price is: $15.00.
Original price was: $649.00.$20.00Current price is: $20.00.
Forex Trading
Original price was: $2,995.00.$31.00Current price is: $31.00.
Original price was: $197.00.$5.00Current price is: $5.00.
Forex Trading
The Complete Guide to Multiple Time Frame Analysis & Reading Price Action with Aiman Almansoori
Original price was: $1,399.00.$13.00Current price is: $13.00.

Original price was: $895.00.$15.00Current price is: $15.00.

Original price was: $997.00.$8.00Current price is: $8.00.
Forex Trading
Original price was: $397.00.$31.00Current price is: $31.00.

Original price was: $310.00.$23.00Current price is: $23.00.

Forex Trading
Original price was: $499.00.$15.00Current price is: $15.00.

Original price was: $1,200.00.$23.00Current price is: $23.00.

Forex Trading
Original price was: $797.00.$10.00Current price is: $10.00.

Original price was: $695.00.$41.00Current price is: $41.00.
Forex Trading
Original price was: $999.00.$15.00Current price is: $15.00.

Reviews
There are no reviews yet.