-
×
 CFA Core Video on Quantitative Finance with Connel Fullenkamp
1 × $6.00
CFA Core Video on Quantitative Finance with Connel Fullenkamp
1 × $6.00 -
×
 AI For Traders with Trading Markets
1 × $31.00
AI For Traders with Trading Markets
1 × $31.00 -
×
 Crystal Ball Pack PLUS bonus Live Trade By Pat Mitchell - Trick Trades
1 × $20.00
Crystal Ball Pack PLUS bonus Live Trade By Pat Mitchell - Trick Trades
1 × $20.00 -
×
 Weekly Options Windfall and Bonus with James Preston
1 × $54.00
Weekly Options Windfall and Bonus with James Preston
1 × $54.00 -
×
 A Conservative Plan to Make $3K Monthly on $25K with Dan Sheridan – Sheridan Options Mentoring
1 × $23.00
A Conservative Plan to Make $3K Monthly on $25K with Dan Sheridan – Sheridan Options Mentoring
1 × $23.00 -
×
 WondaFX Signature Strategy with WondaFX
1 × $5.00
WondaFX Signature Strategy with WondaFX
1 × $5.00 -
×
 The A14 Weekly Option Strategy Workshop with Amy Meissner
1 × $23.00
The A14 Weekly Option Strategy Workshop with Amy Meissner
1 × $23.00 -
×
 Trade What You See, Not What You Believe with Larry Pesavento
1 × $6.00
Trade What You See, Not What You Believe with Larry Pesavento
1 × $6.00 -
×
 TradeCraft: Your Path to Peak Performance Trading By Adam Grimes
1 × $15.00
TradeCraft: Your Path to Peak Performance Trading By Adam Grimes
1 × $15.00 -
×
 What Works in Online Trading with Mark Etzkorn
1 × $6.00
What Works in Online Trading with Mark Etzkorn
1 × $6.00 -
×
 Advanced Trading Course with DovyFX
1 × $5.00
Advanced Trading Course with DovyFX
1 × $5.00 -
×
 Mastering the Complex Sale: How to Compete and Win When the Stakes are High! with Jeff Thull
1 × $6.00
Mastering the Complex Sale: How to Compete and Win When the Stakes are High! with Jeff Thull
1 × $6.00 -
×
 Forex Strategies Course For Weekly Charts with Cory Mitchell - Vantage Point Trading
1 × $4.00
Forex Strategies Course For Weekly Charts with Cory Mitchell - Vantage Point Trading
1 × $4.00 -
×
 Forex Power Strategy Course with Jason Steele
1 × $6.00
Forex Power Strategy Course with Jason Steele
1 × $6.00 -
×
 Investing In KLSE Stocks and Futures With Japanese Candlestick with Fred Tam
1 × $6.00
Investing In KLSE Stocks and Futures With Japanese Candlestick with Fred Tam
1 × $6.00 -
×
 The Prop Trading Code with Brannigan Barrett - Axia Futures
1 × $23.00
The Prop Trading Code with Brannigan Barrett - Axia Futures
1 × $23.00 -
×
 3 Day Master Advanced Workshop Seminar (Video & Manuals 8.48 GB)
1 × $6.00
3 Day Master Advanced Workshop Seminar (Video & Manuals 8.48 GB)
1 × $6.00 -
×
 My Favorite Trades – Trading Mastery
1 × $6.00
My Favorite Trades – Trading Mastery
1 × $6.00 -
×
 Trading Short TermSame Day Trades Sep 2023 with Dan Sheridan & Mark Fenton - Sheridan Options Mentoring
1 × $31.00
Trading Short TermSame Day Trades Sep 2023 with Dan Sheridan & Mark Fenton - Sheridan Options Mentoring
1 × $31.00 -
×
 Trendfans & Trendline Breaks with Albert Yang
1 × $6.00
Trendfans & Trendline Breaks with Albert Yang
1 × $6.00 -
×
 TRADING NFX Course with Andrew NFX
1 × $5.00
TRADING NFX Course with Andrew NFX
1 × $5.00 -
×
 Workshop Earnings Powerplay with Base Camp Trading
1 × $17.00
Workshop Earnings Powerplay with Base Camp Trading
1 × $17.00 -
×
 The Naked Eye: Raw Data Analytics with Edgar Torres - Raw Data Analytics
1 × $8.00
The Naked Eye: Raw Data Analytics with Edgar Torres - Raw Data Analytics
1 × $8.00 -
×
 How to Trade Better with Larry Williams
1 × $6.00
How to Trade Better with Larry Williams
1 × $6.00 -
×
 TLM Virtual Trading Summit 2021 with TradeLikeMike
1 × $6.00
TLM Virtual Trading Summit 2021 with TradeLikeMike
1 × $6.00 -
×
 The Trading Blueprint with Brad Goh - The Trading Geek
1 × $5.00
The Trading Blueprint with Brad Goh - The Trading Geek
1 × $5.00 -
×
 RadioActive Trading Home Study Kit with Power Options
1 × $31.00
RadioActive Trading Home Study Kit with Power Options
1 × $31.00 -
×
 Matrix Spread Options Trading Course with Base Camp Trading
1 × $31.00
Matrix Spread Options Trading Course with Base Camp Trading
1 × $31.00 -
×
 Power Charting - Robert’s Indicator Webinar
1 × $6.00
Power Charting - Robert’s Indicator Webinar
1 × $6.00 -
×
 Crypto Trading Academy with Cheeky Investor - Aussie Day Trader
1 × $13.00
Crypto Trading Academy with Cheeky Investor - Aussie Day Trader
1 × $13.00 -
×
 Greatest Trading Tools with Michael Parsons
1 × $6.00
Greatest Trading Tools with Michael Parsons
1 × $6.00 -
×
 CFA Pro Qbank 2007 & 2008 with Schweser
1 × $6.00
CFA Pro Qbank 2007 & 2008 with Schweser
1 × $6.00 -
×
 The Complete Guide to Multiple Time Frame Analysis & Reading Price Action with Aiman Almansoori
1 × $13.00
The Complete Guide to Multiple Time Frame Analysis & Reading Price Action with Aiman Almansoori
1 × $13.00 -
×
 W. D Gann 's Square Of 9 Applied To Modern Markets with Sean Avidar - Hexatrade350
1 × $23.00
W. D Gann 's Square Of 9 Applied To Modern Markets with Sean Avidar - Hexatrade350
1 × $23.00 -
×
 Asset Markets, Portfolio Choice and Macroeconomic Activity: A Keynesian Perspective - Toichiro Asadra, Peter Flaschel, Tarik Mouakil & Christian Proaño
1 × $6.00
Asset Markets, Portfolio Choice and Macroeconomic Activity: A Keynesian Perspective - Toichiro Asadra, Peter Flaschel, Tarik Mouakil & Christian Proaño
1 × $6.00 -
×
 Get 95% Win Rate With The Triple Candy Method - Eden
1 × $5.00
Get 95% Win Rate With The Triple Candy Method - Eden
1 × $5.00 -
×
 Learn To Day-Trade the E-Mini S&P 500. Simple-as-123 with Marshall Jones
1 × $6.00
Learn To Day-Trade the E-Mini S&P 500. Simple-as-123 with Marshall Jones
1 × $6.00 -
×
 How to Avoid Tax on Your Stock Market Profits with Lee Hadnum
1 × $6.00
How to Avoid Tax on Your Stock Market Profits with Lee Hadnum
1 × $6.00 -
×
 You can be a Stock Market Genious with Joel Greenblaat
1 × $6.00
You can be a Stock Market Genious with Joel Greenblaat
1 × $6.00 -
×
 $20 – 52k 20 pips a day challange with Rafał Zuchowicz - TopMasterTrader
1 × $5.00
$20 – 52k 20 pips a day challange with Rafał Zuchowicz - TopMasterTrader
1 × $5.00 -
×
 Larry Connors Professional Day Trading for Success Program
1 × $62.00
Larry Connors Professional Day Trading for Success Program
1 × $62.00 -
×
 Best of AM Review (Volume 1-3) with Peter Bain
1 × $6.00
Best of AM Review (Volume 1-3) with Peter Bain
1 × $6.00 -
×
 Trading Calendar Spreads with Option Pit
1 × $39.00
Trading Calendar Spreads with Option Pit
1 × $39.00 -
×
 Price Action Trading Volume 3 with Fractal Flow Pro
1 × $6.00
Price Action Trading Volume 3 with Fractal Flow Pro
1 × $6.00 -
×
 Sample and Mock Exams 2008 with CFA Institute
1 × $6.00
Sample and Mock Exams 2008 with CFA Institute
1 × $6.00 -
×
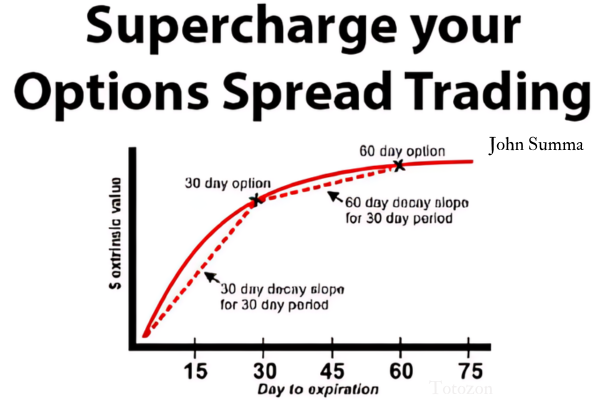 Supercharge your Options Spread Trading with John Summa
1 × $6.00
Supercharge your Options Spread Trading with John Summa
1 × $6.00 -
×
 Bond Market Course with The Macro Compass
1 × $15.00
Bond Market Course with The Macro Compass
1 × $15.00 -
×
 Newsbeat Bandits Program July 2019
1 × $23.00
Newsbeat Bandits Program July 2019
1 × $23.00 -
×
 Investing In Fixer-Uppers 2003 with Jay DeCima
1 × $6.00
Investing In Fixer-Uppers 2003 with Jay DeCima
1 × $6.00 -
×
 Quantamentals - The Next Great Forefront Of Trading and Investing with Trading Markets
1 × $8.00
Quantamentals - The Next Great Forefront Of Trading and Investing with Trading Markets
1 × $8.00 -
×
 Practical Astro with Ruth Miller & Iam Williams
1 × $6.00
Practical Astro with Ruth Miller & Iam Williams
1 × $6.00 -
×
 Mastering Daily Option Trading with Option Pit
1 × $93.00
Mastering Daily Option Trading with Option Pit
1 × $93.00 -
×
 Practical Speculation with Victor Niederhoffer, Laurel Kenner
1 × $6.00
Practical Speculation with Victor Niederhoffer, Laurel Kenner
1 × $6.00 -
×
 Trade with a Day Job USA v2010 with Markets Mastered
1 × $6.00
Trade with a Day Job USA v2010 with Markets Mastered
1 × $6.00 -
×
 Advanced Trading Course with Edney Pinheiro
1 × $5.00
Advanced Trading Course with Edney Pinheiro
1 × $5.00 -
×
 How To Trade Like a Pro, Not a Hobby with Jason Bond
1 × $62.00
How To Trade Like a Pro, Not a Hobby with Jason Bond
1 × $62.00 -
×
 Trading Futures for Dummies with Joe Duarte
1 × $6.00
Trading Futures for Dummies with Joe Duarte
1 × $6.00 -
×
 Sure-thing Options Trading: A Money-Making Guide to the New Listed Stock and Commodity Options Markets - George Angell
1 × $6.00
Sure-thing Options Trading: A Money-Making Guide to the New Listed Stock and Commodity Options Markets - George Angell
1 × $6.00 -
×
 ICT Prodigy Trading Course – $650K in Payouts with Alex Solignani
1 × $15.00
ICT Prodigy Trading Course – $650K in Payouts with Alex Solignani
1 × $15.00 -
×
 Futures Broker Home Study Course CTA Series 3 (Fourteenth Ed.) with Center for Futures Education
1 × $6.00
Futures Broker Home Study Course CTA Series 3 (Fourteenth Ed.) with Center for Futures Education
1 × $6.00 -
×
 ICT Mentorship 2016-17 with Inner Circle Trading
1 × $6.00
ICT Mentorship 2016-17 with Inner Circle Trading
1 × $6.00 -
×
 Learn To Trade with Tori Trades
1 × $8.00
Learn To Trade with Tori Trades
1 × $8.00 -
×
 Numbers: Their Occult Power and Mystic Virtues
1 × $4.00
Numbers: Their Occult Power and Mystic Virtues
1 × $4.00 -
×
 Forex Strategy Master
1 × $31.00
Forex Strategy Master
1 × $31.00 -
×
 Advanced Iron Condors, Trading Concepts with Todd Mitchell
1 × $31.00
Advanced Iron Condors, Trading Concepts with Todd Mitchell
1 × $31.00 -
×
 Forecast 2024 Clarification with Larry Williams
1 × $15.00
Forecast 2024 Clarification with Larry Williams
1 × $15.00 -
×
 Foundations of Technical Analysis (Article) with Andrew W.Lo
1 × $6.00
Foundations of Technical Analysis (Article) with Andrew W.Lo
1 × $6.00 -
×
 Code 6 + 7 Course with Oil Trading Academy
1 × $41.00
Code 6 + 7 Course with Oil Trading Academy
1 × $41.00 -
×
 FX Prosperity Academy with Leonard Williams Jr
1 × $5.00
FX Prosperity Academy with Leonard Williams Jr
1 × $5.00 -
×
 Algo Trading Masterclass with Ali Casey - StatOasis
1 × $23.00
Algo Trading Masterclass with Ali Casey - StatOasis
1 × $23.00 -
×
 Zap Seminar - Ablesys
1 × $6.00
Zap Seminar - Ablesys
1 × $6.00 -
×
 Timing Solution Terra Incognita Edition Build 24 (timingsolution.com)
1 × $6.00
Timing Solution Terra Incognita Edition Build 24 (timingsolution.com)
1 × $6.00 -
×
 Manage By The Greeks 2016 with Sheridan
1 × $6.00
Manage By The Greeks 2016 with Sheridan
1 × $6.00 -
×
 Our 3 Bread and Butter Trades In This Low IV Market Advanced Class with Day Trading Zones
1 × $39.00
Our 3 Bread and Butter Trades In This Low IV Market Advanced Class with Day Trading Zones
1 × $39.00 -
×
 Traders Forge with Ryan Litchfield
1 × $6.00
Traders Forge with Ryan Litchfield
1 × $6.00 -
×
 Fx Engine Trading Course with Adeh Mirzakhani
1 × $6.00
Fx Engine Trading Course with Adeh Mirzakhani
1 × $6.00 -
×
 Advanced Risk Reversals and Rolling Thunder with Stratagem Trade
1 × $54.00
Advanced Risk Reversals and Rolling Thunder with Stratagem Trade
1 × $54.00 -
×
 Trade Australian Share CFDs with Brian Griffin
1 × $6.00
Trade Australian Share CFDs with Brian Griffin
1 × $6.00 -
×
 Active Investment Management: Finding and Harnessing Investment Skill with Charles Jackson
1 × $6.00
Active Investment Management: Finding and Harnessing Investment Skill with Charles Jackson
1 × $6.00 -
×
 Butterfly and Condor Workshop with Aeromir
1 × $15.00
Butterfly and Condor Workshop with Aeromir
1 × $15.00 -
×
 SQX Mentorship with Tip Toe Hippo
1 × $23.00
SQX Mentorship with Tip Toe Hippo
1 × $23.00 -
×
 You AreThe Indicator Online Course
1 × $31.00
You AreThe Indicator Online Course
1 × $31.00 -
×
 Forex and Stocks Trading Course - Set and Forget with Alfonso Moreno
1 × $6.00
Forex and Stocks Trading Course - Set and Forget with Alfonso Moreno
1 × $6.00 -
×
 Traders Seminars – 7 CD
1 × $31.00
Traders Seminars – 7 CD
1 × $31.00 -
×
 Practical Applications of Candlestick Charts with Gary Wagner
1 × $6.00
Practical Applications of Candlestick Charts with Gary Wagner
1 × $6.00 -
×
 Advanced Options Trading with Lucas Downey
1 × $15.00
Advanced Options Trading with Lucas Downey
1 × $15.00 -
×
 All About Stocks (3rd Ed.) withEsme E.Faerber
1 × $6.00
All About Stocks (3rd Ed.) withEsme E.Faerber
1 × $6.00 -
×
 The Orderflow Masterclass with PrimeTrading
1 × $17.00
The Orderflow Masterclass with PrimeTrading
1 × $17.00 -
×
 5 Basic Elliott Wave Patterns + Technical Tools = Trading Success with Jeffrey Kennedy
1 × $15.00
5 Basic Elliott Wave Patterns + Technical Tools = Trading Success with Jeffrey Kennedy
1 × $15.00 -
×
 Quantifiable Edges - 3 Course Bundle
1 × $31.00
Quantifiable Edges - 3 Course Bundle
1 × $31.00 -
×
 White Phoenix’s The Smart (Money) Approach to Trading with Jayson Casper
1 × $39.00
White Phoenix’s The Smart (Money) Approach to Trading with Jayson Casper
1 × $39.00 -
×
 7 Day FX Mastery Course with Market Masters
1 × $6.00
7 Day FX Mastery Course with Market Masters
1 × $6.00 -
×
 Mindover Markets Enhanced: The Intensive Series 2 with Jim Dalton
1 × $20.00
Mindover Markets Enhanced: The Intensive Series 2 with Jim Dalton
1 × $20.00 -
×
 Forex Trend Line Strategy with Kelvin Lee
1 × $6.00
Forex Trend Line Strategy with Kelvin Lee
1 × $6.00 -
×
 Fund of Funds Investing: A Roadmap to Portfolio Diversification with David Strachman & Richard Bookbinder
1 × $6.00
Fund of Funds Investing: A Roadmap to Portfolio Diversification with David Strachman & Richard Bookbinder
1 × $6.00 -
×
 ActiveBeta Indexes. Capturing Systematic Sources of Active Equity Returns (HTML) with Andrew Lo
1 × $6.00
ActiveBeta Indexes. Capturing Systematic Sources of Active Equity Returns (HTML) with Andrew Lo
1 × $6.00 -
×
 Fractal Markets SFX with Tyson Bieniek
1 × $5.00
Fractal Markets SFX with Tyson Bieniek
1 × $5.00 -
×
 Technical Timing Patterns
1 × $6.00
Technical Timing Patterns
1 × $6.00 -
×
 Fractal Markets FX (SMC)
1 × $5.00
Fractal Markets FX (SMC)
1 × $5.00 -
×
 Trade Options Like a DPM with The Admiral Webinar Series with Hamzei Analytics
1 × $6.00
Trade Options Like a DPM with The Admiral Webinar Series with Hamzei Analytics
1 × $6.00 -
×
 Million Dollar Bond Strategies Video with Paul Judd
1 × $6.00
Million Dollar Bond Strategies Video with Paul Judd
1 × $6.00 -
×
 Fractal Based Point Processes with Steven Bradley Lowen & Malvin Carl Teich
1 × $6.00
Fractal Based Point Processes with Steven Bradley Lowen & Malvin Carl Teich
1 × $6.00 -
×
 Volume Profile Video Course with Trader Dale
1 × $8.00
Volume Profile Video Course with Trader Dale
1 × $8.00 -
×
 Compass Trading System with Right Line Trading
1 × $39.00
Compass Trading System with Right Line Trading
1 × $39.00 -
×
 Activedaytrader - Workshop Options For Income
1 × $15.00
Activedaytrader - Workshop Options For Income
1 × $15.00 -
×
 Lee Gettess’s Package
1 × $6.00
Lee Gettess’s Package
1 × $6.00 -
×
 Deep Dive Butterfly Trading Strategy Class with SJG Trades
1 × $41.00
Deep Dive Butterfly Trading Strategy Class with SJG Trades
1 × $41.00 -
×
 Exchange-Traded Derivatives with Erik Banks
1 × $6.00
Exchange-Traded Derivatives with Erik Banks
1 × $6.00 -
×
 Best of the Best: Collars with Amy Meissner & Scott Ruble
1 × $15.00
Best of the Best: Collars with Amy Meissner & Scott Ruble
1 × $15.00 -
×
 Futures Trading Secrets Home Study Course 2008 with Bill McCready
1 × $6.00
Futures Trading Secrets Home Study Course 2008 with Bill McCready
1 × $6.00 -
×
 Trading For A Living Course with Yvan Byeajee - Trading Composure
1 × $6.00
Trading For A Living Course with Yvan Byeajee - Trading Composure
1 × $6.00 -
×
 Options Trading & Ultimate MasterClass With Tyrone Abela - FX Evolution
1 × $54.00
Options Trading & Ultimate MasterClass With Tyrone Abela - FX Evolution
1 × $54.00 -
×
 Accelerated Learning Techniques in Action with Colin Rose, Jayne Nicholl & Malcolm Nicholl
1 × $6.00
Accelerated Learning Techniques in Action with Colin Rose, Jayne Nicholl & Malcolm Nicholl
1 × $6.00

TTM Slingshot & Value Charts Indicators
$6.00
File Size: Coming soon!
Delivery Time: 1–12 hours
Media Type: Online Course
TTM Slingshot & Value Charts Indicators
Introduction to TTM Slingshot & Value Charts
In the dynamic world of trading, having the right tools can make all the difference. Two such powerful tools are the TTM Slingshot and Value Charts Indicators. These indicators provide traders with crucial insights, helping them navigate market complexities and make informed decisions.
Understanding TTM Slingshot
What is TTM Slingshot?
The TTM Slingshot is an advanced trading indicator developed by John Carter. It combines multiple moving averages to identify potential breakout points in the market. By analyzing the relationship between these moving averages, the TTM Slingshot helps traders spot opportunities for entering or exiting trades.
Key Features of TTM Slingshot
- Multiple Moving Averages: Uses short-term and long-term moving averages.
- Breakout Identification: Detects potential breakout points.
- Versatility: Applicable across various markets and timeframes.
Benefits of Using TTM Slingshot
Enhanced Market Analysis
The TTM Slingshot provides a detailed analysis of market trends, allowing traders to anticipate significant price movements. This indicator’s ability to pinpoint breakout points is invaluable for making timely trading decisions.
Improved Trading Accuracy
By combining multiple moving averages, the TTM Slingshot offers a comprehensive view of the market. This integration reduces noise and enhances the accuracy of predictions, leading to more successful trades.
Setting Up TTM Slingshot
Choosing the Right Platform
To utilize the TTM Slingshot, you’ll need a trading platform that supports custom indicators. Platforms like Thinkorswim and TradeStation are popular choices among traders.
Installing the Indicator
- Download the Indicator: Obtain the TTM Slingshot file compatible with your trading platform.
- Open Your Platform: Launch the trading platform.
- Add the Indicator: Navigate to the ‘Indicators’ section and add the TTM Slingshot file.
- Customize Settings: Adjust the settings to align with your trading strategy.
Understanding Value Charts Indicators
What are Value Charts Indicators?
Value Charts Indicators are tools that measure the relative value of a security based on its price history. These indicators help traders determine whether a security is overvalued, undervalued, or fairly valued, providing a clear picture of potential trading opportunities.
Key Features of Value Charts Indicators
- Relative Value Measurement: Assesses the value of a security.
- Overbought/Oversold Conditions: Identifies extreme market conditions.
- Visual Representation: Displays value levels on a chart for easy interpretation.
Benefits of Using Value Charts Indicators
Identifying Market Extremes
Value Charts Indicators are excellent for spotting overbought and oversold conditions. By identifying these extremes, traders can make strategic decisions about entering or exiting positions.
Enhancing Risk Management
These indicators aid in risk management by providing insights into the relative value of a security. Traders can use this information to set stop-loss levels and protect their investments.
Setting Up Value Charts Indicators
Selecting the Appropriate Platform
Choose a trading platform that supports Value Charts Indicators. Many modern trading platforms, such as NinjaTrader and MetaTrader, offer these indicators.
Installing the Indicator
- Download the Indicator: Obtain the Value Charts Indicator file for your platform.
- Open Your Platform: Start the trading platform.
- Add the Indicator: Go to the ‘Indicators’ section and add the Value Charts file.
- Configure Settings: Customize the settings to fit your trading approach.
How to Use TTM Slingshot & Value Charts Together
Combining Indicators for Better Insights
Using TTM Slingshot and Value Charts Indicators together can enhance your market analysis. While TTM Slingshot identifies breakout points, Value Charts Indicators help assess the relative value of the security, providing a more comprehensive view.
Practical Application
- Entry Points: Use TTM Slingshot to identify breakout points and confirm with Value Charts Indicators to ensure the security is not overvalued.
- Exit Points: Value Charts Indicators can signal overbought conditions, indicating a good time to exit, while TTM Slingshot confirms the end of a trend.
Advanced Strategies with TTM Slingshot & Value Charts
Pairing with Other Indicators
For even more robust analysis, pair TTM Slingshot and Value Charts Indicators with other tools such as RSI (Relative Strength Index) and MACD (Moving Average Convergence Divergence).
Developing a Trading Plan
Create a detailed trading plan that incorporates these indicators. Define your entry and exit points, risk management strategies, and the specific market conditions you’re targeting.
Real-Life Examples
Successful Trade Case Study
Consider a scenario where the TTM Slingshot indicates a breakout, and Value Charts Indicators show the security is undervalued. Entering a trade at this point could lead to significant profits as the price moves to its fair value.
Learning from Mistakes
Analyze trades where the indicators did not predict the expected outcome. Understanding these failures can help refine your strategy and improve future performance.
Conclusion
Maximizing Your Trading Success
The TTM Slingshot and Value Charts Indicators are powerful tools that, when used together, can significantly enhance your trading strategy. By providing insights into market trends and relative value, these indicators help you make more informed decisions.
Taking the Next Step
Start by setting up these indicators on your trading platform. Practice interpreting the signals and integrating them into your trading strategy to see the benefits firsthand.

FAQs
What is the TTM Slingshot indicator?
The TTM Slingshot is a trading tool that uses multiple moving averages to identify breakout points in the market.
How do Value Charts Indicators work?
Value Charts Indicators measure the relative value of a security, helping traders identify overbought and oversold conditions.
Can these indicators be used together?
Yes, combining TTM Slingshot and Value Charts Indicators provides a comprehensive analysis of market trends and security value.
Which platforms support these indicators?
Platforms like Thinkorswim, TradeStation, NinjaTrader, and MetaTrader support TTM Slingshot and Value Charts Indicators.
How do I install these indicators?
Download the respective indicator files, open your trading platform, and add the indicators through the ‘Indicators’ section.
Be the first to review “TTM Slingshot & Value Charts Indicators”
You must be logged in to post a review.
Related products
Forex Trading
Quantamentals – The Next Great Forefront Of Trading and Investing with Trading Markets
Original price was: $1,495.00.$8.00Current price is: $8.00.

Forex Trading
Original price was: $850.00.$23.00Current price is: $23.00.
Original price was: $139.00.$23.00Current price is: $23.00.
Forex Trading
Original price was: $397.00.$31.00Current price is: $31.00.
Original price was: $700.00.$39.00Current price is: $39.00.

Forex Trading
Original price was: $999.00.$15.00Current price is: $15.00.
Original price was: $1,800.00.$54.00Current price is: $54.00.
Original price was: $497.00.$31.00Current price is: $31.00.
Forex Trading
Original price was: $125.00.$17.00Current price is: $17.00.
Original price was: $1,200.00.$23.00Current price is: $23.00.
Original price was: $197.00.$5.00Current price is: $5.00.

Forex Trading
Original price was: $797.00.$10.00Current price is: $10.00.
Forex Trading
Original price was: $697.00.$5.00Current price is: $5.00.
Forex Trading
Original price was: $2,995.00.$31.00Current price is: $31.00.

Original price was: $999.00.$5.00Current price is: $5.00.

Original price was: $497.00.$11.00Current price is: $11.00.
Forex Trading
Original price was: $799.00.$15.00Current price is: $15.00.
Forex Trading
Original price was: $500.00.$5.00Current price is: $5.00.

Forex Trading
Original price was: $239.00.$8.00Current price is: $8.00.

Original price was: $895.00.$15.00Current price is: $15.00.

Reviews
There are no reviews yet.