-
×
 Real Options Analysis: Tools and Techniques for Valuing Strategic Investments and Decisions - Johnathan Mun
1 × $6.00
Real Options Analysis: Tools and Techniques for Valuing Strategic Investments and Decisions - Johnathan Mun
1 × $6.00 -
×
 Advanced Option Trading with Broken Wing Butterflys with Greg Loehr
1 × $9.00
Advanced Option Trading with Broken Wing Butterflys with Greg Loehr
1 × $9.00 -
×
 Carolyn Boroden Package
1 × $15.00
Carolyn Boroden Package
1 × $15.00 -
×
 Master Time Factor & Forecasting with Mathematical Rules
1 × $6.00
Master Time Factor & Forecasting with Mathematical Rules
1 × $6.00 -
×
 Tenkei Trading Techniques Programme with Wilson P.Williams
1 × $6.00
Tenkei Trading Techniques Programme with Wilson P.Williams
1 × $6.00 -
×
 The Aggressive Conservative Investor with Martin Whitman & Martin Shubik
1 × $6.00
The Aggressive Conservative Investor with Martin Whitman & Martin Shubik
1 × $6.00 -
×
 Mastertrader – Mastering Swing Trading
1 × $31.00
Mastertrader – Mastering Swing Trading
1 × $31.00 -
×
 Option Hydra - Mar 2020 Edition - Basics with Rajandran R
1 × $23.00
Option Hydra - Mar 2020 Edition - Basics with Rajandran R
1 × $23.00 -
×
 Equities with Peter Martin
1 × $6.00
Equities with Peter Martin
1 × $6.00 -
×
 Trading - Candlelight - Ryan Litchfield
1 × $6.00
Trading - Candlelight - Ryan Litchfield
1 × $6.00 -
×
 Trading with the Gods Fibonacci Series with Alan Oliver
1 × $6.00
Trading with the Gods Fibonacci Series with Alan Oliver
1 × $6.00 -
×
 The Best Mechanical DayTrading System I Know with Bruce Babcock
1 × $6.00
The Best Mechanical DayTrading System I Know with Bruce Babcock
1 × $6.00 -
×
 All Access Online Trading Course with Steve Luke
1 × $6.00
All Access Online Trading Course with Steve Luke
1 × $6.00 -
×
 $20 – 52k 20 pips a day challange with Rafał Zuchowicz - TopMasterTrader
1 × $5.00
$20 – 52k 20 pips a day challange with Rafał Zuchowicz - TopMasterTrader
1 × $5.00 -
×
 Adaptation in Sports Training (1995) with Atko Viru
1 × $23.00
Adaptation in Sports Training (1995) with Atko Viru
1 × $23.00 -
×
 The Psychology of Investing with John Nofsinger
1 × $6.00
The Psychology of Investing with John Nofsinger
1 × $6.00 -
×
 3 Volatility Strategies with Quantified Strategies
1 × $23.00
3 Volatility Strategies with Quantified Strategies
1 × $23.00 -
×
 White Phoenix’s The Smart (Money) Approach to Trading with Jayson Casper
1 × $39.00
White Phoenix’s The Smart (Money) Approach to Trading with Jayson Casper
1 × $39.00 -
×
 Predicting Market Trends with Alan S.Farley
1 × $6.00
Predicting Market Trends with Alan S.Farley
1 × $6.00 -
×
 Trading MoneyTides & Chaos in the Stock Market with Hans Hannula
1 × $6.00
Trading MoneyTides & Chaos in the Stock Market with Hans Hannula
1 × $6.00 -
×
 Advanced Iron Condors, Trading Concepts with Todd Mitchell
1 × $31.00
Advanced Iron Condors, Trading Concepts with Todd Mitchell
1 × $31.00 -
×
 Trading Strategies with Larry Sanders
1 × $6.00
Trading Strategies with Larry Sanders
1 × $6.00 -
×
 Candlestick and Pivot Point Trading Triggers with John Person
1 × $6.00
Candlestick and Pivot Point Trading Triggers with John Person
1 × $6.00 -
×
 Trading for a Bright Future with Martin Cole
1 × $6.00
Trading for a Bright Future with Martin Cole
1 × $6.00 -
×
 3_8’s to Wealth (Audio 84 MB+ WorkBooks) with Darlene Nelson
1 × $6.00
3_8’s to Wealth (Audio 84 MB+ WorkBooks) with Darlene Nelson
1 × $6.00 -
×
 Developing & Implementing Pattern-Based Trading Systems with Tushar S.Chande
1 × $6.00
Developing & Implementing Pattern-Based Trading Systems with Tushar S.Chande
1 × $6.00 -
×
 Fed Balance Sheet 201 with Joseph Wang - Central Banking 101
1 × $10.00
Fed Balance Sheet 201 with Joseph Wang - Central Banking 101
1 × $10.00 -
×
 The Naked Eye: Raw Data Analytics with Edgar Torres - Raw Data Analytics
1 × $8.00
The Naked Eye: Raw Data Analytics with Edgar Torres - Raw Data Analytics
1 × $8.00 -
×
 Volume Profile 2023 (Order Flow Pack) with Trader Dale
1 × $5.00
Volume Profile 2023 (Order Flow Pack) with Trader Dale
1 × $5.00 -
×
 Century Capital Group Course with Dylan Forexia
1 × $6.00
Century Capital Group Course with Dylan Forexia
1 × $6.00 -
×
 Candle Charting Essentials & Beyond Volume 1 & 2 with Steve Nison - Candle Charts
1 × $15.00
Candle Charting Essentials & Beyond Volume 1 & 2 with Steve Nison - Candle Charts
1 × $15.00 -
×
 The Geography of Money with Benjamin J.Cohen
1 × $6.00
The Geography of Money with Benjamin J.Cohen
1 × $6.00 -
×
 Secret Forex Society Economic Reports (2006-2007) with Felix Homogratus
1 × $6.00
Secret Forex Society Economic Reports (2006-2007) with Felix Homogratus
1 × $6.00 -
×
 SJG Trading - Butterflies Class with Steve Ganz
1 × $31.00
SJG Trading - Butterflies Class with Steve Ganz
1 × $31.00 -
×
 The Ultimate Option Guide When & How to Use Which Strategy for The Best Results with Larry Gaines - Power Cycle Trading
1 × $39.00
The Ultimate Option Guide When & How to Use Which Strategy for The Best Results with Larry Gaines - Power Cycle Trading
1 × $39.00 -
×
 DAY TRADING OPTIONS For Beginners: Strategies to INVEST and WIN with Dylan Parker
1 × $5.00
DAY TRADING OPTIONS For Beginners: Strategies to INVEST and WIN with Dylan Parker
1 × $5.00 -
×
 Ultimate Trading Course with Dodgy's Dungeon
1 × $8.00
Ultimate Trading Course with Dodgy's Dungeon
1 × $8.00 -
×
 Ichimoku Cloud Triple Confirmation Indicator and Scan with AlphaShark
1 × $31.00
Ichimoku Cloud Triple Confirmation Indicator and Scan with AlphaShark
1 × $31.00 -
×
 Fierce 10 with Mandi Rafsendjani
1 × $5.00
Fierce 10 with Mandi Rafsendjani
1 × $5.00 -
×
 CANDLESTICKS APPLIED with Steve Nison & Syl Desaulniers - Candle Charts
1 × $15.00
CANDLESTICKS APPLIED with Steve Nison & Syl Desaulniers - Candle Charts
1 × $15.00 -
×
 Confessions of a Pit Trader 2003 with Rick Burgess
1 × $6.00
Confessions of a Pit Trader 2003 with Rick Burgess
1 × $6.00 -
×
 FestX Main Online video Course with Clint Fester
1 × $5.00
FestX Main Online video Course with Clint Fester
1 × $5.00 -
×
 AI For Traders with Trading Markets
1 × $31.00
AI For Traders with Trading Markets
1 × $31.00 -
×
 Candlestick & Pivot Point Strategies with John L.Person
1 × $6.00
Candlestick & Pivot Point Strategies with John L.Person
1 × $6.00 -
×
 A Trader's Guide to Self-Discipline: Proven Techniques to Improve Trading Profits
1 × $6.00
A Trader's Guide to Self-Discipline: Proven Techniques to Improve Trading Profits
1 × $6.00 -
×
 Lee Gettess’s Package
1 × $6.00
Lee Gettess’s Package
1 × $6.00 -
×
 After Hour Trading Made Easy with Joe Duarte & Roland Burke
1 × $6.00
After Hour Trading Made Easy with Joe Duarte & Roland Burke
1 × $6.00 -
×
 Connors on Advanced Trading Strategies with Larry Connors
1 × $6.00
Connors on Advanced Trading Strategies with Larry Connors
1 × $6.00 -
×
 Super CD Companion for Metastock with Martin Pring
1 × $6.00
Super CD Companion for Metastock with Martin Pring
1 × $6.00 -
×
 Trading Dave Landry’s Ultimate Bow Ties Strategy with Dave Landry
1 × $6.00
Trading Dave Landry’s Ultimate Bow Ties Strategy with Dave Landry
1 × $6.00 -
×
 Basecamptrading - Naked Trading Part 2
1 × $6.00
Basecamptrading - Naked Trading Part 2
1 × $6.00 -
×
 5-Step-Trading Stocks I and II with Lex Van Dam
1 × $4.00
5-Step-Trading Stocks I and II with Lex Van Dam
1 × $4.00 -
×
 Trading to Win (Seminar WorkBook 2003) with Bruce Gilmore
1 × $6.00
Trading to Win (Seminar WorkBook 2003) with Bruce Gilmore
1 × $6.00 -
×
 The Complete Guide to Multiple Time Frame Analysis & Reading Price Action with Aiman Almansoori
1 × $13.00
The Complete Guide to Multiple Time Frame Analysis & Reading Price Action with Aiman Almansoori
1 × $13.00 -
×
 The Options Doctor: Option Strategies for Every Kind of Market with Jeanette Schwarz Young
1 × $6.00
The Options Doctor: Option Strategies for Every Kind of Market with Jeanette Schwarz Young
1 × $6.00 -
×
 A PLAN TO MAKE $4K MONTHLY ON $20K with Dan Sheridan - Sheridan Options Mentoring
1 × $15.00
A PLAN TO MAKE $4K MONTHLY ON $20K with Dan Sheridan - Sheridan Options Mentoring
1 × $15.00 -
×
 Technical Analysis & Options Strategies with K.H.Shaleen
1 × $6.00
Technical Analysis & Options Strategies with K.H.Shaleen
1 × $6.00 -
×
 Day Trading Freedom Course & Members Area Videos
1 × $6.00
Day Trading Freedom Course & Members Area Videos
1 × $6.00 -
×
 Iron Condors in a Volatile Market 2022 with Dan Sheridan - Sheridan Options Mentoring
1 × $46.00
Iron Condors in a Volatile Market 2022 with Dan Sheridan - Sheridan Options Mentoring
1 × $46.00 -
×
 Stock Market Rules (3rd Ed.) with Michael Sheimo
1 × $6.00
Stock Market Rules (3rd Ed.) with Michael Sheimo
1 × $6.00 -
×
 Trading The E-Minis for a Living with Don Miller
1 × $6.00
Trading The E-Minis for a Living with Don Miller
1 × $6.00 -
×
 Secret Income with James Altucher
1 × $62.00
Secret Income with James Altucher
1 × $62.00 -
×
 Fixed Income Securities (2nd Ed.) with Bruce Tuckman
1 × $10.00
Fixed Income Securities (2nd Ed.) with Bruce Tuckman
1 × $10.00 -
×
 Option Alpha Signals
1 × $15.00
Option Alpha Signals
1 × $15.00 -
×
 The A14 Weekly Option Strategy Workshop with Amy Meissner
1 × $23.00
The A14 Weekly Option Strategy Workshop with Amy Meissner
1 × $23.00 -
×
 Read The Market RTM Master Trader Course + Journals
1 × $5.00
Read The Market RTM Master Trader Course + Journals
1 × $5.00 -
×
 A Momentum Based Approach to Swing Trading with Dave Landry
1 × $6.00
A Momentum Based Approach to Swing Trading with Dave Landry
1 × $6.00 -
×
 Starting Out in Futures Trading with Mark Powers
1 × $6.00
Starting Out in Futures Trading with Mark Powers
1 × $6.00 -
×
 Trading the Moves - Consistent Gains in All Markets with Ed Downs
1 × $6.00
Trading the Moves - Consistent Gains in All Markets with Ed Downs
1 × $6.00 -
×
 All About Market Timing with Leslie N.Masonson
1 × $6.00
All About Market Timing with Leslie N.Masonson
1 × $6.00 -
×
 The Bond Book (2nd Ed.) with Annette Thau
1 × $6.00
The Bond Book (2nd Ed.) with Annette Thau
1 × $6.00 -
×
 Active Trading Course Notes with Alan Hull
1 × $6.00
Active Trading Course Notes with Alan Hull
1 × $6.00 -
×
 A Convicted Stock Manipulators Guide to Investing with Marino Specogna
1 × $6.00
A Convicted Stock Manipulators Guide to Investing with Marino Specogna
1 × $6.00 -
×
 Seasonal Stock Market Trends: The Definitive Guide to Calendar‐Based Stock Market Trading with Jay Kaeppel
1 × $6.00
Seasonal Stock Market Trends: The Definitive Guide to Calendar‐Based Stock Market Trading with Jay Kaeppel
1 × $6.00 -
×
 ChartEngineers Course
1 × $5.00
ChartEngineers Course
1 × $5.00 -
×
 90 Days To Trade MasterClass with Jerremy Newsome & Matt Delong - Real Life Trading
1 × $104.00
90 Days To Trade MasterClass with Jerremy Newsome & Matt Delong - Real Life Trading
1 × $104.00 -
×
 Big Profit Patterns Using Candlestick Signals & Gaps with Stephen W.Bigalow
1 × $6.00
Big Profit Patterns Using Candlestick Signals & Gaps with Stephen W.Bigalow
1 × $6.00 -
×
 Butterfly and Condor Workshop with Aeromir
1 × $15.00
Butterfly and Condor Workshop with Aeromir
1 × $15.00 -
×
 The Heretics of Finance with Andrew Lo & Jasmina Hasanhodzic
1 × $4.00
The Heretics of Finance with Andrew Lo & Jasmina Hasanhodzic
1 × $4.00 -
×
 Advanced Trading Strategies with Larry Connors
1 × $6.00
Advanced Trading Strategies with Larry Connors
1 × $6.00 -
×
 The Gold Standard in Trading Education with Six Figure Capital
1 × $5.00
The Gold Standard in Trading Education with Six Figure Capital
1 × $5.00 -
×
 Traders Secret Success Package. Symmetry Wave Trading with Michael Gur Dillon
1 × $6.00
Traders Secret Success Package. Symmetry Wave Trading with Michael Gur Dillon
1 × $6.00 -
×
 Advanced Pattern Recognition with John Cameron
1 × $23.00
Advanced Pattern Recognition with John Cameron
1 × $23.00 -
×
 How to Analyze Multifamily Investment Opportunities with Symon He & Brandon Young
1 × $6.00
How to Analyze Multifamily Investment Opportunities with Symon He & Brandon Young
1 × $6.00 -
×
 Trading Analysis Crash Course
1 × $23.00
Trading Analysis Crash Course
1 × $23.00 -
×
 High Probability Trading Using Elliott Wave And Fibonacci Analysis withVic Patel - Forex Training Group
1 × $10.00
High Probability Trading Using Elliott Wave And Fibonacci Analysis withVic Patel - Forex Training Group
1 × $10.00 -
×
 How to Predict and Prepare for a Stock Market Crash with Damon Verial
1 × $6.00
How to Predict and Prepare for a Stock Market Crash with Damon Verial
1 × $6.00 -
×
 SQX Mentorship with Tip Toe Hippo
1 × $23.00
SQX Mentorship with Tip Toe Hippo
1 × $23.00 -
×
 Compass Trading System with Right Line Trading
1 × $39.00
Compass Trading System with Right Line Trading
1 × $39.00 -
×
 A Comparison of Twelve Technical Trading Systems with Louis Lukac
1 × $6.00
A Comparison of Twelve Technical Trading Systems with Louis Lukac
1 × $6.00 -
×
 Artificial Neural Networks Technology with Dave Anderson, George McNeill
1 × $6.00
Artificial Neural Networks Technology with Dave Anderson, George McNeill
1 × $6.00 -
×
 The Reducing Risk and Maximizing Returns Blueprint (Atomic Hedge Strategy) with Don Kaufman
1 × $6.00
The Reducing Risk and Maximizing Returns Blueprint (Atomic Hedge Strategy) with Don Kaufman
1 × $6.00 -
×
 CarterFX Membership with Duran Carter
1 × $23.00
CarterFX Membership with Duran Carter
1 × $23.00 -
×
 The Stock Rocket Trading System with Dave Wooding
1 × $6.00
The Stock Rocket Trading System with Dave Wooding
1 × $6.00 -
×
 Trading Forex Exchange with Clifford Bennett
1 × $6.00
Trading Forex Exchange with Clifford Bennett
1 × $6.00 -
×
 Trading Blox Builder 4.3.2.1
1 × $31.00
Trading Blox Builder 4.3.2.1
1 × $31.00 -
×
 TradeCraft: Your Path to Peak Performance Trading By Adam Grimes
1 × $15.00
TradeCraft: Your Path to Peak Performance Trading By Adam Grimes
1 × $15.00 -
×
 W. D Gann 's Square Of 9 Applied To Modern Markets with Sean Avidar - Hexatrade350
1 × $23.00
W. D Gann 's Square Of 9 Applied To Modern Markets with Sean Avidar - Hexatrade350
1 × $23.00 -
×
 A Complete Guide to Technical Trading Tactics with John Person
1 × $6.00
A Complete Guide to Technical Trading Tactics with John Person
1 × $6.00 -
×
 Order flow self-study training program with iMFtracker
1 × $10.00
Order flow self-study training program with iMFtracker
1 × $10.00 -
×
 The Inve$tment A$trology Articles with Alan Richter
1 × $6.00
The Inve$tment A$trology Articles with Alan Richter
1 × $6.00 -
×
 EasyLanguage Home Study Course PDF Book + CD
1 × $6.00
EasyLanguage Home Study Course PDF Book + CD
1 × $6.00 -
×
 Trading Short TermSame Day Trades Sep 2023 with Dan Sheridan & Mark Fenton - Sheridan Options Mentoring
1 × $31.00
Trading Short TermSame Day Trades Sep 2023 with Dan Sheridan & Mark Fenton - Sheridan Options Mentoring
1 × $31.00 -
×
 Advanced Trading Course with DovyFX
1 × $5.00
Advanced Trading Course with DovyFX
1 × $5.00 -
×
 All About Technical Analysis with Constance Brown
1 × $6.00
All About Technical Analysis with Constance Brown
1 × $6.00 -
×
 Candlestick Charts with Clive Lambert
1 × $6.00
Candlestick Charts with Clive Lambert
1 × $6.00 -
×
 ABC Waves TOS Indicator & Live Class with Simpler Options
1 × $6.00
ABC Waves TOS Indicator & Live Class with Simpler Options
1 × $6.00 -
×
 Portfolio Investing with Ron Bertino
1 × $54.00
Portfolio Investing with Ron Bertino
1 × $54.00 -
×
 Forecast 2024 Clarification with Larry Williams
1 × $15.00
Forecast 2024 Clarification with Larry Williams
1 × $15.00 -
×
 Commodity Trading Video Course with Bob Buran
1 × $6.00
Commodity Trading Video Course with Bob Buran
1 × $6.00 -
×
 Advanced Breakthroughs in Day Trading DVD course with George Angell
1 × $6.00
Advanced Breakthroughs in Day Trading DVD course with George Angell
1 × $6.00 -
×
 Trading Course 2024 with ZMC x BMO
1 × $17.00
Trading Course 2024 with ZMC x BMO
1 × $17.00 -
×
 Practical Approach to Ninjatrader 8 Platform with Rajandran R
1 × $6.00
Practical Approach to Ninjatrader 8 Platform with Rajandran R
1 × $6.00 -
×
 All About Dividend Investing with Don Schreiber & Gary Stroik
1 × $6.00
All About Dividend Investing with Don Schreiber & Gary Stroik
1 × $6.00 -
×
 ICT Prodigy Trading Course – $650K in Payouts with Alex Solignani
1 × $15.00
ICT Prodigy Trading Course – $650K in Payouts with Alex Solignani
1 × $15.00 -
×
 A Seminar On Ocean Theory Home Study Trading Course with Pat Raffalovich
1 × $6.00
A Seminar On Ocean Theory Home Study Trading Course with Pat Raffalovich
1 × $6.00 -
×
 All About Bonds & Mutual Funds with Esme Faerber
1 × $6.00
All About Bonds & Mutual Funds with Esme Faerber
1 × $6.00 -
×
 Volume Breakout Indicator
1 × $31.00
Volume Breakout Indicator
1 × $31.00 -
×
 WondaFX Signature Strategy with WondaFX
1 × $5.00
WondaFX Signature Strategy with WondaFX
1 × $5.00 -
×
 Cotton Trading Manual with Terry Townsend
1 × $6.00
Cotton Trading Manual with Terry Townsend
1 × $6.00 -
×
 D.A.T.E. Unlock Your Trading DNA Worskshop with Geoff Bysshe
1 × $6.00
D.A.T.E. Unlock Your Trading DNA Worskshop with Geoff Bysshe
1 × $6.00 -
×
 The Index Trading Course Workbook: Step-by-Step Exercises and Tests to Help You Master The Index Trading Course with George Fontanills & Tom Gentile
1 × $6.00
The Index Trading Course Workbook: Step-by-Step Exercises and Tests to Help You Master The Index Trading Course with George Fontanills & Tom Gentile
1 × $6.00 -
×
 Adx Mastery Complete Course
1 × $6.00
Adx Mastery Complete Course
1 × $6.00 -
×
 ActiveBeta Indexes. Capturing Systematic Sources of Active Equity Returns (HTML) with Andrew Lo
1 × $6.00
ActiveBeta Indexes. Capturing Systematic Sources of Active Equity Returns (HTML) with Andrew Lo
1 × $6.00 -
×
 Lifespan Investing with Clifford Pistolese
1 × $6.00
Lifespan Investing with Clifford Pistolese
1 × $6.00 -
×
 Advanced Management Strategies - Home Study with Pristine Capital
1 × $27.00
Advanced Management Strategies - Home Study with Pristine Capital
1 × $27.00 -
×
 AbleTrend with John Wang & Grace Wang
1 × $6.00
AbleTrend with John Wang & Grace Wang
1 × $6.00 -
×
 Streetsmart Guide To Valuing a Stock (2nd Ed.) with Gary Gray
1 × $6.00
Streetsmart Guide To Valuing a Stock (2nd Ed.) with Gary Gray
1 × $6.00 -
×
 Traders Secret Library
1 × $6.00
Traders Secret Library
1 × $6.00 -
×
 Optionetics 2007 - Home Study Course, MP3
1 × $6.00
Optionetics 2007 - Home Study Course, MP3
1 × $6.00 -
×
 T3 Live - The Simple Art of Trading
1 × $31.00
T3 Live - The Simple Art of Trading
1 × $31.00 -
×
 Reading & Understanding Charts with Andrew Baxter
1 × $6.00
Reading & Understanding Charts with Andrew Baxter
1 × $6.00 -
×
 We Fund Traders - The Whale Order
1 × $5.00
We Fund Traders - The Whale Order
1 × $5.00 -
×
 Essentials in Quantitative Trading QT01 By HangukQuant's
1 × $23.00
Essentials in Quantitative Trading QT01 By HangukQuant's
1 × $23.00 -
×
 The Prop Trading Code with Brannigan Barrett - Axia Futures
1 × $23.00
The Prop Trading Code with Brannigan Barrett - Axia Futures
1 × $23.00

TTM Slingshot & Value Charts Indicators
$6.00
File Size: Coming soon!
Delivery Time: 1–12 hours
Media Type: Online Course
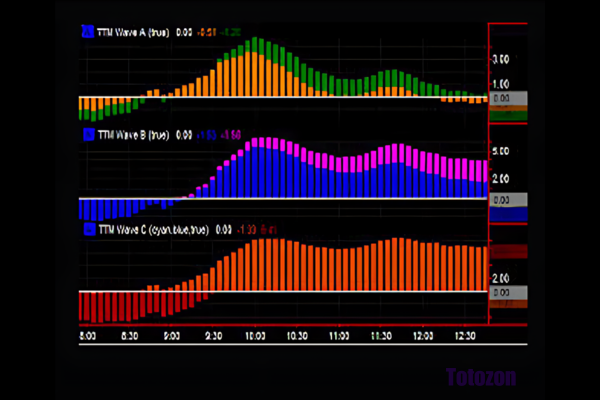
TTM Slingshot & Value Charts Indicators
Introduction to TTM Slingshot & Value Charts
In the dynamic world of trading, having the right tools can make all the difference. Two such powerful tools are the TTM Slingshot and Value Charts Indicators. These indicators provide traders with crucial insights, helping them navigate market complexities and make informed decisions.
Understanding TTM Slingshot
What is TTM Slingshot?
The TTM Slingshot is an advanced trading indicator developed by John Carter. It combines multiple moving averages to identify potential breakout points in the market. By analyzing the relationship between these moving averages, the TTM Slingshot helps traders spot opportunities for entering or exiting trades.
Key Features of TTM Slingshot
- Multiple Moving Averages: Uses short-term and long-term moving averages.
- Breakout Identification: Detects potential breakout points.
- Versatility: Applicable across various markets and timeframes.
Benefits of Using TTM Slingshot
Enhanced Market Analysis
The TTM Slingshot provides a detailed analysis of market trends, allowing traders to anticipate significant price movements. This indicator’s ability to pinpoint breakout points is invaluable for making timely trading decisions.
Improved Trading Accuracy
By combining multiple moving averages, the TTM Slingshot offers a comprehensive view of the market. This integration reduces noise and enhances the accuracy of predictions, leading to more successful trades.
Setting Up TTM Slingshot
Choosing the Right Platform
To utilize the TTM Slingshot, you’ll need a trading platform that supports custom indicators. Platforms like Thinkorswim and TradeStation are popular choices among traders.
Installing the Indicator
- Download the Indicator: Obtain the TTM Slingshot file compatible with your trading platform.
- Open Your Platform: Launch the trading platform.
- Add the Indicator: Navigate to the ‘Indicators’ section and add the TTM Slingshot file.
- Customize Settings: Adjust the settings to align with your trading strategy.
Understanding Value Charts Indicators
What are Value Charts Indicators?
Value Charts Indicators are tools that measure the relative value of a security based on its price history. These indicators help traders determine whether a security is overvalued, undervalued, or fairly valued, providing a clear picture of potential trading opportunities.
Key Features of Value Charts Indicators
- Relative Value Measurement: Assesses the value of a security.
- Overbought/Oversold Conditions: Identifies extreme market conditions.
- Visual Representation: Displays value levels on a chart for easy interpretation.
Benefits of Using Value Charts Indicators
Identifying Market Extremes
Value Charts Indicators are excellent for spotting overbought and oversold conditions. By identifying these extremes, traders can make strategic decisions about entering or exiting positions.
Enhancing Risk Management
These indicators aid in risk management by providing insights into the relative value of a security. Traders can use this information to set stop-loss levels and protect their investments.
Setting Up Value Charts Indicators
Selecting the Appropriate Platform
Choose a trading platform that supports Value Charts Indicators. Many modern trading platforms, such as NinjaTrader and MetaTrader, offer these indicators.
Installing the Indicator
- Download the Indicator: Obtain the Value Charts Indicator file for your platform.
- Open Your Platform: Start the trading platform.
- Add the Indicator: Go to the ‘Indicators’ section and add the Value Charts file.
- Configure Settings: Customize the settings to fit your trading approach.
How to Use TTM Slingshot & Value Charts Together
Combining Indicators for Better Insights
Using TTM Slingshot and Value Charts Indicators together can enhance your market analysis. While TTM Slingshot identifies breakout points, Value Charts Indicators help assess the relative value of the security, providing a more comprehensive view.
Practical Application
- Entry Points: Use TTM Slingshot to identify breakout points and confirm with Value Charts Indicators to ensure the security is not overvalued.
- Exit Points: Value Charts Indicators can signal overbought conditions, indicating a good time to exit, while TTM Slingshot confirms the end of a trend.
Advanced Strategies with TTM Slingshot & Value Charts
Pairing with Other Indicators
For even more robust analysis, pair TTM Slingshot and Value Charts Indicators with other tools such as RSI (Relative Strength Index) and MACD (Moving Average Convergence Divergence).
Developing a Trading Plan
Create a detailed trading plan that incorporates these indicators. Define your entry and exit points, risk management strategies, and the specific market conditions you’re targeting.
Real-Life Examples
Successful Trade Case Study
Consider a scenario where the TTM Slingshot indicates a breakout, and Value Charts Indicators show the security is undervalued. Entering a trade at this point could lead to significant profits as the price moves to its fair value.
Learning from Mistakes
Analyze trades where the indicators did not predict the expected outcome. Understanding these failures can help refine your strategy and improve future performance.
Conclusion
Maximizing Your Trading Success
The TTM Slingshot and Value Charts Indicators are powerful tools that, when used together, can significantly enhance your trading strategy. By providing insights into market trends and relative value, these indicators help you make more informed decisions.
Taking the Next Step
Start by setting up these indicators on your trading platform. Practice interpreting the signals and integrating them into your trading strategy to see the benefits firsthand.

FAQs
What is the TTM Slingshot indicator?
The TTM Slingshot is a trading tool that uses multiple moving averages to identify breakout points in the market.
How do Value Charts Indicators work?
Value Charts Indicators measure the relative value of a security, helping traders identify overbought and oversold conditions.
Can these indicators be used together?
Yes, combining TTM Slingshot and Value Charts Indicators provides a comprehensive analysis of market trends and security value.
Which platforms support these indicators?
Platforms like Thinkorswim, TradeStation, NinjaTrader, and MetaTrader support TTM Slingshot and Value Charts Indicators.
How do I install these indicators?
Download the respective indicator files, open your trading platform, and add the indicators through the ‘Indicators’ section.
Be the first to review “TTM Slingshot & Value Charts Indicators”
You must be logged in to post a review.
Related products

Forex Trading
Original price was: $499.00.$15.00Current price is: $15.00.
Forex Trading
Original price was: $2,995.00.$31.00Current price is: $31.00.

Original price was: $649.00.$20.00Current price is: $20.00.
Forex Trading
Original price was: $249.00.$15.00Current price is: $15.00.
Forex Trading
Original price was: $397.00.$31.00Current price is: $31.00.
Original price was: $997.00.$8.00Current price is: $8.00.

Original price was: $450.00.$23.00Current price is: $23.00.

Original price was: $999.00.$5.00Current price is: $5.00.

Forex Trading
Original price was: $4,997.00.$27.00Current price is: $27.00.

Forex Trading
Original price was: $500.00.$5.00Current price is: $5.00.

Original price was: $695.00.$41.00Current price is: $41.00.

Original price was: $895.00.$15.00Current price is: $15.00.
Forex Trading
Original price was: $239.00.$8.00Current price is: $8.00.
Forex Trading
Original price was: $1,098.00.$39.00Current price is: $39.00.
Forex Trading
Original price was: $797.00.$10.00Current price is: $10.00.

Original price was: $997.00.$13.00Current price is: $13.00.

Original price was: $497.00.$31.00Current price is: $31.00.
Forex Trading
Original price was: $1,898.00.$10.00Current price is: $10.00.
Original price was: $310.00.$23.00Current price is: $23.00.
Original price was: $139.00.$23.00Current price is: $23.00.

Reviews
There are no reviews yet.