-
×
 Trading Course 2024 with ZMC x BMO
1 × $17.00
Trading Course 2024 with ZMC x BMO
1 × $17.00 -
×
 A Trader’s Guide To Discipline
1 × $6.00
A Trader’s Guide To Discipline
1 × $6.00 -
×
 Ultimate Trading Course with Dodgy's Dungeon
1 × $8.00
Ultimate Trading Course with Dodgy's Dungeon
1 × $8.00 -
×
 The A14 Weekly Option Strategy Workshop with Amy Meissner
1 × $23.00
The A14 Weekly Option Strategy Workshop with Amy Meissner
1 × $23.00 -
×
 Essentials in Quantitative Trading QT01 By HangukQuant's
1 × $23.00
Essentials in Quantitative Trading QT01 By HangukQuant's
1 × $23.00 -
×
 Trading - Candlelight - Ryan Litchfield
1 × $6.00
Trading - Candlelight - Ryan Litchfield
1 × $6.00 -
×
 Volatility and Timing with Jay Kaeppel – The Option Trader’s Guide to Probability
1 × $6.00
Volatility and Timing with Jay Kaeppel – The Option Trader’s Guide to Probability
1 × $6.00 -
×
 Order flow self-study training program with iMFtracker
1 × $10.00
Order flow self-study training program with iMFtracker
1 × $10.00 -
×
 A Traders Astrological Almanac (2001 – 2006) with Jeanne Long
1 × $6.00
A Traders Astrological Almanac (2001 – 2006) with Jeanne Long
1 × $6.00 -
×
 The Triple Bottom Line
1 × $6.00
The Triple Bottom Line
1 × $6.00 -
×
 Boomer Quick Profits Day Trading Course
1 × $23.00
Boomer Quick Profits Day Trading Course
1 × $23.00 -
×
 Growing Rich with Growth Stocks: Wall Street's Top Money Managers Reveal the 12 Rules for Investment Success - Kirk Kazanjian
1 × $6.00
Growing Rich with Growth Stocks: Wall Street's Top Money Managers Reveal the 12 Rules for Investment Success - Kirk Kazanjian
1 × $6.00 -
×
 Prometheus Course with QuantProgram
1 × $13.00
Prometheus Course with QuantProgram
1 × $13.00 -
×
 Advanced Spread Trading with Guy Bower - MasterClass Trader
1 × $15.00
Advanced Spread Trading with Guy Bower - MasterClass Trader
1 × $15.00 -
×
 Home Run Options Trading Course with Dave Aquino - Base Camp Trading
1 × $11.00
Home Run Options Trading Course with Dave Aquino - Base Camp Trading
1 × $11.00 -
×
 War Room Psychology Vol. 1 with Pat Mitchell – Trick Trades
1 × $23.00
War Room Psychology Vol. 1 with Pat Mitchell – Trick Trades
1 × $23.00 -
×
 The Orderflows Trade Opportunities Encyclopedia with Michael Valtos
1 × $8.00
The Orderflows Trade Opportunities Encyclopedia with Michael Valtos
1 × $8.00 -
×
 Trading Short TermSame Day Trades Sep 2023 with Dan Sheridan & Mark Fenton - Sheridan Options Mentoring
1 × $31.00
Trading Short TermSame Day Trades Sep 2023 with Dan Sheridan & Mark Fenton - Sheridan Options Mentoring
1 × $31.00 -
×
 Bond Market Course with The Macro Compass
1 × $15.00
Bond Market Course with The Macro Compass
1 × $15.00 -
×
 Advanced Trading Applications of Candlestick Charting with Gary S.Wagner & Bradley L.Matheny
1 × $6.00
Advanced Trading Applications of Candlestick Charting with Gary S.Wagner & Bradley L.Matheny
1 × $6.00 -
×
 Creating & Using a Trading Plan with Paul Lange
1 × $8.00
Creating & Using a Trading Plan with Paul Lange
1 × $8.00 -
×
 Deep Dive Butterfly Trading Strategy Class with SJG Trades
1 × $41.00
Deep Dive Butterfly Trading Strategy Class with SJG Trades
1 × $41.00 -
×
 WondaFX Signature Strategy with WondaFX
1 × $5.00
WondaFX Signature Strategy with WondaFX
1 × $5.00 -
×
 The Complete Guide to Multiple Time Frame Analysis & Reading Price Action with Aiman Almansoori
1 × $13.00
The Complete Guide to Multiple Time Frame Analysis & Reading Price Action with Aiman Almansoori
1 × $13.00 -
×
 White Phoenix’s The Smart (Money) Approach to Trading with Jayson Casper
1 × $39.00
White Phoenix’s The Smart (Money) Approach to Trading with Jayson Casper
1 × $39.00 -
×
 WYCKOFF TRADING COURSE (WTC) PART I – ANALYSIS (Fall 2021) with Roman Bogomazov
1 × $209.00
WYCKOFF TRADING COURSE (WTC) PART I – ANALYSIS (Fall 2021) with Roman Bogomazov
1 × $209.00 -
×
 Arjoio’s MMT - Essential Package
1 × $5.00
Arjoio’s MMT - Essential Package
1 × $5.00 -
×
 A PLAN TO MAKE $4K MONTHLY ON $20K with Dan Sheridan - Sheridan Options Mentoring
1 × $15.00
A PLAN TO MAKE $4K MONTHLY ON $20K with Dan Sheridan - Sheridan Options Mentoring
1 × $15.00 -
×
 Volume Profile Video Course with Trader Dale
1 × $8.00
Volume Profile Video Course with Trader Dale
1 × $8.00 -
×
 The Art of the Trade: What I Learned (and Lost) Trading the Chicago Futures Markets - Jason Alan Jankovsky
1 × $6.00
The Art of the Trade: What I Learned (and Lost) Trading the Chicago Futures Markets - Jason Alan Jankovsky
1 × $6.00 -
×
 Options Trading & Ultimate MasterClass With Tyrone Abela - FX Evolution
1 × $54.00
Options Trading & Ultimate MasterClass With Tyrone Abela - FX Evolution
1 × $54.00 -
×
 3-Day Day Trading Seminar Online CD with John Carter & Hubert Senters
1 × $6.00
3-Day Day Trading Seminar Online CD with John Carter & Hubert Senters
1 × $6.00 -
×
 Month 01 to 08 2018
1 × $62.00
Month 01 to 08 2018
1 × $62.00 -
×
 Price Analysis Webinar with Carolyn Boroden
1 × $6.00
Price Analysis Webinar with Carolyn Boroden
1 × $6.00 -
×
 Butterfly and Condor Workshop with Aeromir
1 × $15.00
Butterfly and Condor Workshop with Aeromir
1 × $15.00 -
×
 Compass Trading System with Right Line Trading
1 × $39.00
Compass Trading System with Right Line Trading
1 × $39.00 -
×
 You Don't Need No Stinkin' Stockbroker: Taking the Pulse of Your Investment Portfolio with Doug Cappiello & Steve Tanaka
1 × $6.00
You Don't Need No Stinkin' Stockbroker: Taking the Pulse of Your Investment Portfolio with Doug Cappiello & Steve Tanaka
1 × $6.00 -
×
 AnkhFX Academy Course
1 × $17.00
AnkhFX Academy Course
1 × $17.00 -
×
 TradeSafe Mechanical Trading System, Course, and Coaching
1 × $85.00
TradeSafe Mechanical Trading System, Course, and Coaching
1 × $85.00 -
×
 Sacredscience - W.F.Whitehead – Occultism Simplified
1 × $6.00
Sacredscience - W.F.Whitehead – Occultism Simplified
1 × $6.00 -
×
 Century Capital Group Course with Dylan Forexia
1 × $6.00
Century Capital Group Course with Dylan Forexia
1 × $6.00 -
×
 MT4 High Probability Forex Trading Method
1 × $6.00
MT4 High Probability Forex Trading Method
1 × $6.00 -
×
 Marder Videos Reports 2019-2022 with Kevin Marder
1 × $104.00
Marder Videos Reports 2019-2022 with Kevin Marder
1 × $104.00 -
×
 The Psychology Of Trading with Brett N.Steenbarger
1 × $6.00
The Psychology Of Trading with Brett N.Steenbarger
1 × $6.00 -
×
 5 Week Live Web Seminar (Video & WorkBook ) with Larry Connors
1 × $6.00
5 Week Live Web Seminar (Video & WorkBook ) with Larry Connors
1 × $6.00 -
×
 Your Next Great Stock: How to Screen the Market for Tomorrow's Top Performers with Jack Hough
1 × $6.00
Your Next Great Stock: How to Screen the Market for Tomorrow's Top Performers with Jack Hough
1 × $6.00 -
×
 Trading The Nasdaq Seminar with Alan Rich
1 × $6.00
Trading The Nasdaq Seminar with Alan Rich
1 × $6.00 -
×
 Best of AM Review (Volume 1-3) with Peter Bain
1 × $6.00
Best of AM Review (Volume 1-3) with Peter Bain
1 × $6.00 -
×
 Investment Fables with Aswath Damodaran
1 × $6.00
Investment Fables with Aswath Damodaran
1 × $6.00 -
×
 Asset Allocation for the Individual Investor with CFA Institute
1 × $6.00
Asset Allocation for the Individual Investor with CFA Institute
1 × $6.00 -
×
 Quantum Swing Trader
1 × $6.00
Quantum Swing Trader
1 × $6.00 -
×
 Best Trading Set Ups Playbook with Stacey Burke Trading
1 × $5.00
Best Trading Set Ups Playbook with Stacey Burke Trading
1 × $5.00 -
×
 The Stock Rocket Trading System with Dave Wooding
1 × $6.00
The Stock Rocket Trading System with Dave Wooding
1 × $6.00 -
×
 Advances in International Investments: Traditional and Alternative Approaches with Hung-Gay Fung, Xiaoqing Eleanor Xu & Jot Yau
1 × $6.00
Advances in International Investments: Traditional and Alternative Approaches with Hung-Gay Fung, Xiaoqing Eleanor Xu & Jot Yau
1 × $6.00 -
×
 Advanced Fibonacci Trading with Neal Hughes
1 × $6.00
Advanced Fibonacci Trading with Neal Hughes
1 × $6.00 -
×
 Inner Cicle Trader - ICT Methods with Michael Huddleston
1 × $5.00
Inner Cicle Trader - ICT Methods with Michael Huddleston
1 × $5.00 -
×
 Day Trading with Lines in the Sky By R.L.Muehlberg
1 × $6.00
Day Trading with Lines in the Sky By R.L.Muehlberg
1 × $6.00 -
×
 Advanced Forex Trading Momentum vs Reversals with Indicators Webinar - Mark Whistler
1 × $6.00
Advanced Forex Trading Momentum vs Reversals with Indicators Webinar - Mark Whistler
1 × $6.00 -
×
 Quant Edge with T3 Live
1 × $6.00
Quant Edge with T3 Live
1 × $6.00 -
×
 Professional Approaches to Directional Option Trading with Option Pit
1 × $23.00
Professional Approaches to Directional Option Trading with Option Pit
1 × $23.00 -
×
 Alternative Assets and Strategic Allocation with John Abbink
1 × $6.00
Alternative Assets and Strategic Allocation with John Abbink
1 × $6.00 -
×
 All About Dividend Investing with Don Schreiber & Gary Stroik
1 × $6.00
All About Dividend Investing with Don Schreiber & Gary Stroik
1 × $6.00 -
×
 ETF Trading Strategies Revealed with David Vomund
1 × $6.00
ETF Trading Strategies Revealed with David Vomund
1 × $6.00 -
×
 Options Academy Elevate with Simon Ree - Tao of Trading
1 × $109.00
Options Academy Elevate with Simon Ree - Tao of Trading
1 × $109.00 -
×
 Advanced Iron Condors, Trading Concepts with Todd Mitchell
1 × $31.00
Advanced Iron Condors, Trading Concepts with Todd Mitchell
1 × $31.00 -
×
 AutoTrader-Fully Automated Trading System with Trading123
1 × $46.00
AutoTrader-Fully Automated Trading System with Trading123
1 × $46.00 -
×
 Unsorted Articles about the Psychology of Trading with Brett N.Steenbarger
1 × $6.00
Unsorted Articles about the Psychology of Trading with Brett N.Steenbarger
1 × $6.00 -
×
 The Prop Trading Code with Brannigan Barrett - Axia Futures
1 × $23.00
The Prop Trading Code with Brannigan Barrett - Axia Futures
1 × $23.00

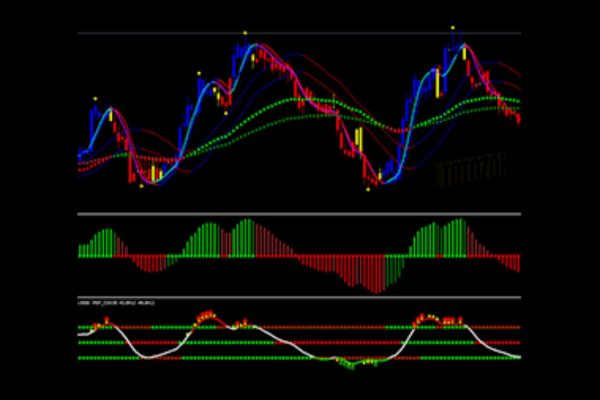
TTM Slingshot & Value Charts Indicators
$6.00
File Size: Coming soon!
Delivery Time: 1–12 hours
Media Type: Online Course
TTM Slingshot & Value Charts Indicators
Introduction to TTM Slingshot & Value Charts
In the dynamic world of trading, having the right tools can make all the difference. Two such powerful tools are the TTM Slingshot and Value Charts Indicators. These indicators provide traders with crucial insights, helping them navigate market complexities and make informed decisions.
Understanding TTM Slingshot
What is TTM Slingshot?
The TTM Slingshot is an advanced trading indicator developed by John Carter. It combines multiple moving averages to identify potential breakout points in the market. By analyzing the relationship between these moving averages, the TTM Slingshot helps traders spot opportunities for entering or exiting trades.
Key Features of TTM Slingshot
- Multiple Moving Averages: Uses short-term and long-term moving averages.
- Breakout Identification: Detects potential breakout points.
- Versatility: Applicable across various markets and timeframes.
Benefits of Using TTM Slingshot
Enhanced Market Analysis
The TTM Slingshot provides a detailed analysis of market trends, allowing traders to anticipate significant price movements. This indicator’s ability to pinpoint breakout points is invaluable for making timely trading decisions.
Improved Trading Accuracy
By combining multiple moving averages, the TTM Slingshot offers a comprehensive view of the market. This integration reduces noise and enhances the accuracy of predictions, leading to more successful trades.
Setting Up TTM Slingshot
Choosing the Right Platform
To utilize the TTM Slingshot, you’ll need a trading platform that supports custom indicators. Platforms like Thinkorswim and TradeStation are popular choices among traders.
Installing the Indicator
- Download the Indicator: Obtain the TTM Slingshot file compatible with your trading platform.
- Open Your Platform: Launch the trading platform.
- Add the Indicator: Navigate to the ‘Indicators’ section and add the TTM Slingshot file.
- Customize Settings: Adjust the settings to align with your trading strategy.
Understanding Value Charts Indicators
What are Value Charts Indicators?
Value Charts Indicators are tools that measure the relative value of a security based on its price history. These indicators help traders determine whether a security is overvalued, undervalued, or fairly valued, providing a clear picture of potential trading opportunities.
Key Features of Value Charts Indicators
- Relative Value Measurement: Assesses the value of a security.
- Overbought/Oversold Conditions: Identifies extreme market conditions.
- Visual Representation: Displays value levels on a chart for easy interpretation.
Benefits of Using Value Charts Indicators
Identifying Market Extremes
Value Charts Indicators are excellent for spotting overbought and oversold conditions. By identifying these extremes, traders can make strategic decisions about entering or exiting positions.
Enhancing Risk Management
These indicators aid in risk management by providing insights into the relative value of a security. Traders can use this information to set stop-loss levels and protect their investments.
Setting Up Value Charts Indicators
Selecting the Appropriate Platform
Choose a trading platform that supports Value Charts Indicators. Many modern trading platforms, such as NinjaTrader and MetaTrader, offer these indicators.
Installing the Indicator
- Download the Indicator: Obtain the Value Charts Indicator file for your platform.
- Open Your Platform: Start the trading platform.
- Add the Indicator: Go to the ‘Indicators’ section and add the Value Charts file.
- Configure Settings: Customize the settings to fit your trading approach.
How to Use TTM Slingshot & Value Charts Together
Combining Indicators for Better Insights
Using TTM Slingshot and Value Charts Indicators together can enhance your market analysis. While TTM Slingshot identifies breakout points, Value Charts Indicators help assess the relative value of the security, providing a more comprehensive view.
Practical Application
- Entry Points: Use TTM Slingshot to identify breakout points and confirm with Value Charts Indicators to ensure the security is not overvalued.
- Exit Points: Value Charts Indicators can signal overbought conditions, indicating a good time to exit, while TTM Slingshot confirms the end of a trend.
Advanced Strategies with TTM Slingshot & Value Charts
Pairing with Other Indicators
For even more robust analysis, pair TTM Slingshot and Value Charts Indicators with other tools such as RSI (Relative Strength Index) and MACD (Moving Average Convergence Divergence).
Developing a Trading Plan
Create a detailed trading plan that incorporates these indicators. Define your entry and exit points, risk management strategies, and the specific market conditions you’re targeting.
Real-Life Examples
Successful Trade Case Study
Consider a scenario where the TTM Slingshot indicates a breakout, and Value Charts Indicators show the security is undervalued. Entering a trade at this point could lead to significant profits as the price moves to its fair value.
Learning from Mistakes
Analyze trades where the indicators did not predict the expected outcome. Understanding these failures can help refine your strategy and improve future performance.
Conclusion
Maximizing Your Trading Success
The TTM Slingshot and Value Charts Indicators are powerful tools that, when used together, can significantly enhance your trading strategy. By providing insights into market trends and relative value, these indicators help you make more informed decisions.
Taking the Next Step
Start by setting up these indicators on your trading platform. Practice interpreting the signals and integrating them into your trading strategy to see the benefits firsthand.

FAQs
What is the TTM Slingshot indicator?
The TTM Slingshot is a trading tool that uses multiple moving averages to identify breakout points in the market.
How do Value Charts Indicators work?
Value Charts Indicators measure the relative value of a security, helping traders identify overbought and oversold conditions.
Can these indicators be used together?
Yes, combining TTM Slingshot and Value Charts Indicators provides a comprehensive analysis of market trends and security value.
Which platforms support these indicators?
Platforms like Thinkorswim, TradeStation, NinjaTrader, and MetaTrader support TTM Slingshot and Value Charts Indicators.
How do I install these indicators?
Download the respective indicator files, open your trading platform, and add the indicators through the ‘Indicators’ section.
Be the first to review “TTM Slingshot & Value Charts Indicators”
You must be logged in to post a review.
Related products
Original price was: $895.00.$15.00Current price is: $15.00.

Original price was: $997.00.$13.00Current price is: $13.00.

Forex Trading
Original price was: $2,000.00.$23.00Current price is: $23.00.
Original price was: $497.00.$11.00Current price is: $11.00.

Original price was: $649.00.$20.00Current price is: $20.00.
Forex Trading
Original price was: $1,898.00.$10.00Current price is: $10.00.

Original price was: $997.00.$8.00Current price is: $8.00.
Forex Trading
Original price was: $499.00.$15.00Current price is: $15.00.

Forex Trading
Original price was: $999.00.$15.00Current price is: $15.00.

Original price was: $2,120.00.$15.00Current price is: $15.00.

Original price was: $197.00.$5.00Current price is: $5.00.
Original price was: $700.00.$39.00Current price is: $39.00.

Original price was: $450.00.$23.00Current price is: $23.00.
Original price was: $299.00.$8.00Current price is: $8.00.

Forex Trading
Original price was: $697.00.$5.00Current price is: $5.00.

Forex Trading
Original price was: $125.00.$17.00Current price is: $17.00.

Original price was: $1,849.00.$15.00Current price is: $15.00.

Forex Trading
Original price was: $797.00.$10.00Current price is: $10.00.
Forex Trading
Original price was: $1,098.00.$39.00Current price is: $39.00.
Original price was: $695.00.$41.00Current price is: $41.00.

Reviews
There are no reviews yet.