-
×
 X-Factor Day-Trading
1 × $5.00
X-Factor Day-Trading
1 × $5.00 -
×
 Order flow self-study training program with iMFtracker
1 × $10.00
Order flow self-study training program with iMFtracker
1 × $10.00 -
×
 7 Days Options Masters Course with John Carter
1 × $54.00
7 Days Options Masters Course with John Carter
1 × $54.00 -
×
 Best of the Best: Collars with Amy Meissner & Scott Ruble
1 × $15.00
Best of the Best: Collars with Amy Meissner & Scott Ruble
1 × $15.00 -
×
 The London Close Trade Strategy with Shirley Hudson & Vic Noble
1 × $4.00
The London Close Trade Strategy with Shirley Hudson & Vic Noble
1 × $4.00 -
×
 High Probability Trading Using Elliott Wave And Fibonacci Analysis withVic Patel - Forex Training Group
1 × $10.00
High Probability Trading Using Elliott Wave And Fibonacci Analysis withVic Patel - Forex Training Group
1 × $10.00 -
×
 ActiveBeta Indexes. Capturing Systematic Sources of Active Equity Returns (HTML) with Andrew Lo
1 × $6.00
ActiveBeta Indexes. Capturing Systematic Sources of Active Equity Returns (HTML) with Andrew Lo
1 × $6.00 -
×
 Forex Secrets Exposed
1 × $15.00
Forex Secrets Exposed
1 × $15.00 -
×
 Bird Watch in Lion Country 2010 Ed with Dirk Du Toit
1 × $6.00
Bird Watch in Lion Country 2010 Ed with Dirk Du Toit
1 × $6.00 -
×
 Trading Short TermSame Day Trades Sep 2023 with Dan Sheridan & Mark Fenton - Sheridan Options Mentoring
1 × $31.00
Trading Short TermSame Day Trades Sep 2023 with Dan Sheridan & Mark Fenton - Sheridan Options Mentoring
1 × $31.00 -
×
 Quantamentals - The Next Great Forefront Of Trading and Investing with Trading Markets
1 × $8.00
Quantamentals - The Next Great Forefront Of Trading and Investing with Trading Markets
1 × $8.00 -
×
 Crystal Ball Pack PLUS bonus Live Trade By Pat Mitchell - Trick Trades
1 × $20.00
Crystal Ball Pack PLUS bonus Live Trade By Pat Mitchell - Trick Trades
1 × $20.00 -
×
 Geomagnetic Storms & Stock Markets (Article) with Anna Krivelyova, C.Robotti
1 × $6.00
Geomagnetic Storms & Stock Markets (Article) with Anna Krivelyova, C.Robotti
1 × $6.00 -
×
 8 Year Presidential Election Pattern (Article) with Adam White
1 × $6.00
8 Year Presidential Election Pattern (Article) with Adam White
1 × $6.00 -
×
 3 Technical Indicators to Help You Ride the Elliott Wave Trend with Chris Carolan
1 × $6.00
3 Technical Indicators to Help You Ride the Elliott Wave Trend with Chris Carolan
1 × $6.00 -
×
 Pristine Seminar - Options Trading the Pristine Way
1 × $6.00
Pristine Seminar - Options Trading the Pristine Way
1 × $6.00 -
×
 ICT Prodigy Trading Course – $650K in Payouts with Alex Solignani
1 × $15.00
ICT Prodigy Trading Course – $650K in Payouts with Alex Solignani
1 × $15.00 -
×
 AI For Traders with Trading Markets
1 × $31.00
AI For Traders with Trading Markets
1 × $31.00 -
×
 Activedaytrader - Mastering Technicals
1 × $15.00
Activedaytrader - Mastering Technicals
1 × $15.00 -
×
 A Complete Guide to the Futures Markets: Fundamental Analysis, Technical Analysis, Trading, Spreads, and Options (1st Edition) - Jack Schwager
1 × $6.00
A Complete Guide to the Futures Markets: Fundamental Analysis, Technical Analysis, Trading, Spreads, and Options (1st Edition) - Jack Schwager
1 × $6.00 -
×
 Futures Trading Secrets Home Study Course 2004 with Bill McCready
1 × $7.00
Futures Trading Secrets Home Study Course 2004 with Bill McCready
1 × $7.00 -
×
 Beginner's Guide to Ratio Butterflys Class with Don Kaufman
1 × $6.00
Beginner's Guide to Ratio Butterflys Class with Don Kaufman
1 × $6.00 -
×
 Ultimate Trading Course with Dodgy's Dungeon
1 × $8.00
Ultimate Trading Course with Dodgy's Dungeon
1 × $8.00 -
×
 WondaFX Signature Strategy with WondaFX
1 × $5.00
WondaFX Signature Strategy with WondaFX
1 × $5.00 -
×
 WickOrTreat Trading Course with WickOrTreat
1 × $6.00
WickOrTreat Trading Course with WickOrTreat
1 × $6.00 -
×
 Inside the House of Money (2006) with Steven Drobny
1 × $6.00
Inside the House of Money (2006) with Steven Drobny
1 × $6.00 -
×
 Compass Trading System with Right Line Trading
1 × $39.00
Compass Trading System with Right Line Trading
1 × $39.00 -
×
 $20 – 52k 20 pips a day challange with Rafał Zuchowicz - TopMasterTrader
1 × $5.00
$20 – 52k 20 pips a day challange with Rafał Zuchowicz - TopMasterTrader
1 × $5.00 -
×
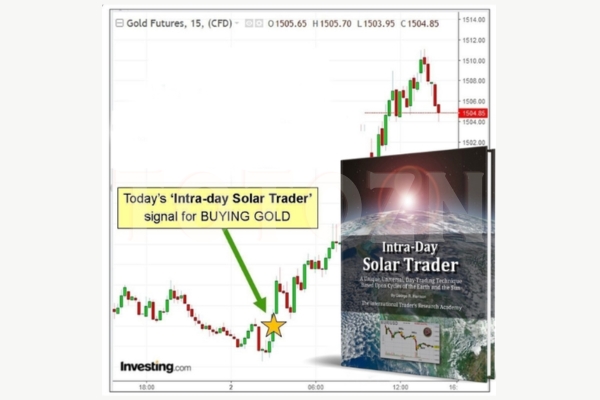 Intra-day Solar Trader with George Harrison
1 × $17.00
Intra-day Solar Trader with George Harrison
1 × $17.00 -
×
 Big Profit Patterns Using Candlestick Signals & Gaps with Stephen W.Bigalow
1 × $6.00
Big Profit Patterns Using Candlestick Signals & Gaps with Stephen W.Bigalow
1 × $6.00 -
×
 Trading as a Business with Alexander Elder
1 × $6.00
Trading as a Business with Alexander Elder
1 × $6.00 -
×
 Wealth Management with Dimitris Chorafas
1 × $6.00
Wealth Management with Dimitris Chorafas
1 × $6.00 -
×
 Trading Economic Data System with CopperChips
1 × $6.00
Trading Economic Data System with CopperChips
1 × $6.00 -
×
 Dan Sheridan Delta Force
1 × $6.00
Dan Sheridan Delta Force
1 × $6.00 -
×
 DaVinci FX Course
1 × $6.00
DaVinci FX Course
1 × $6.00 -
×
 Cycle Hunter Support with Brian James Sklenka
1 × $6.00
Cycle Hunter Support with Brian James Sklenka
1 × $6.00 -
×
 Advanced Group Analysis Turorial with David Vomund
1 × $6.00
Advanced Group Analysis Turorial with David Vomund
1 × $6.00 -
×
 The Best (Public) Trading Methods I’ve Found for Futures & Equities with Perry J.Kaufman
1 × $6.00
The Best (Public) Trading Methods I’ve Found for Futures & Equities with Perry J.Kaufman
1 × $6.00 -
×
 The Orderflows Trade Opportunities Encyclopedia with Michael Valtos
1 × $8.00
The Orderflows Trade Opportunities Encyclopedia with Michael Valtos
1 × $8.00 -
×
 Knowing Where the Energy is Coming From with Charles Drummond
1 × $6.00
Knowing Where the Energy is Coming From with Charles Drummond
1 × $6.00 -
×
 Setups of a Winning Trader with Gareth Soloway
1 × $521.00
Setups of a Winning Trader with Gareth Soloway
1 × $521.00 -
×
 TradeCraft: Your Path to Peak Performance Trading By Adam Grimes
1 × $15.00
TradeCraft: Your Path to Peak Performance Trading By Adam Grimes
1 × $15.00 -
×
 3 Steps To Supply/Demand + 3 Steps To Market Profile 10% Off Combined Price
1 × $23.00
3 Steps To Supply/Demand + 3 Steps To Market Profile 10% Off Combined Price
1 × $23.00 -
×
 The Psychology of Investing with John Nofsinger
1 × $6.00
The Psychology of Investing with John Nofsinger
1 × $6.00 -
×
 A PLAN TO MAKE $4K MONTHLY ON $20K with Dan Sheridan - Sheridan Options Mentoring
1 × $15.00
A PLAN TO MAKE $4K MONTHLY ON $20K with Dan Sheridan - Sheridan Options Mentoring
1 × $15.00 -
×
 Art & Science of Trend Trading Class with Jeff Bierman
1 × $6.00
Art & Science of Trend Trading Class with Jeff Bierman
1 × $6.00 -
×
 Butterfly and Condor Workshop with Aeromir
1 × $15.00
Butterfly and Condor Workshop with Aeromir
1 × $15.00 -
×
 Candlestick & Pivot Point Strategies with John L.Person
1 × $6.00
Candlestick & Pivot Point Strategies with John L.Person
1 × $6.00 -
×
 Directional Calendars in 2023 with Dan Sheridan & Mark Fenton - Sheridan Options Mentoring
1 × $85.00
Directional Calendars in 2023 with Dan Sheridan & Mark Fenton - Sheridan Options Mentoring
1 × $85.00 -
×
 Investment Titans: Investment Insights from the Minds that Move Wall Street with Jonathan Burton
1 × $6.00
Investment Titans: Investment Insights from the Minds that Move Wall Street with Jonathan Burton
1 × $6.00 -
×
 Home Run Options Trading Course with Dave Aquino - Base Camp Trading
1 × $11.00
Home Run Options Trading Course with Dave Aquino - Base Camp Trading
1 × $11.00 -
×
 Investment Valuation
1 × $6.00
Investment Valuation
1 × $6.00 -
×
 Fibonacci Swing Trader 2.0 with Frank Paul - Forexmentor
1 × $6.00
Fibonacci Swing Trader 2.0 with Frank Paul - Forexmentor
1 × $6.00 -
×
 Advanced Trading Course - Footprint Charts, Market Profile & TPO with Jayson Casper
1 × $31.00
Advanced Trading Course - Footprint Charts, Market Profile & TPO with Jayson Casper
1 × $31.00 -
×
 The EAP Training Program (Apr 2019)
1 × $6.00
The EAP Training Program (Apr 2019)
1 × $6.00 -
×
 Big Boy Volume Spread Analysis + Advanced Price Action Mastery Course with Kai Sheng Chew
1 × $15.00
Big Boy Volume Spread Analysis + Advanced Price Action Mastery Course with Kai Sheng Chew
1 × $15.00 -
×
 Trading by the Book (tradingeducators.com)
1 × $6.00
Trading by the Book (tradingeducators.com)
1 × $6.00 -
×
 PFAZoneSuite [Trading Indicator] 2017
1 × $109.00
PFAZoneSuite [Trading Indicator] 2017
1 × $109.00 -
×
 30 Trading Classics with 3T Live
1 × $5.00
30 Trading Classics with 3T Live
1 × $5.00 -
×
 Gann’s Scientific Methods Unveiled (Vol I, II)
1 × $6.00
Gann’s Scientific Methods Unveiled (Vol I, II)
1 × $6.00 -
×
 Trading The E-Minis for a Living with Don Miller
1 × $6.00
Trading The E-Minis for a Living with Don Miller
1 × $6.00 -
×
 Accelerated Learning Techniques in Action with Colin Rose, Jayne Nicholl & Malcolm Nicholl
1 × $6.00
Accelerated Learning Techniques in Action with Colin Rose, Jayne Nicholl & Malcolm Nicholl
1 × $6.00 -
×
 Principles of Artificial Neural Networks (2nd Ed.) with Daniel Graupe
1 × $6.00
Principles of Artificial Neural Networks (2nd Ed.) with Daniel Graupe
1 × $6.00 -
×
 5 Basic Elliott Wave Patterns + Technical Tools = Trading Success with Jeffrey Kennedy
1 × $15.00
5 Basic Elliott Wave Patterns + Technical Tools = Trading Success with Jeffrey Kennedy
1 × $15.00 -
×
 High Probability Trading with Marcel Link
1 × $6.00
High Probability Trading with Marcel Link
1 × $6.00 -
×
 5-Day Master Trader Program 2022 with Mark Minervini
1 × $31.00
5-Day Master Trader Program 2022 with Mark Minervini
1 × $31.00 -
×
 The Python for Traders Masterclass with Mr James
1 × $10.00
The Python for Traders Masterclass with Mr James
1 × $10.00 -
×
 4-Hour Income Strategy with Todd Mitchell & Craig Hill
1 × $62.00
4-Hour Income Strategy with Todd Mitchell & Craig Hill
1 × $62.00 -
×
 The Precision Profit Float Indicator (TS Code & Setups) with Steve Woods
1 × $6.00
The Precision Profit Float Indicator (TS Code & Setups) with Steve Woods
1 × $6.00 -
×
 The Q’s (2nd Ed.) with Darlene Nelson
1 × $6.00
The Q’s (2nd Ed.) with Darlene Nelson
1 × $6.00 -
×
 9-Pack of TOS Indicators
1 × $6.00
9-Pack of TOS Indicators
1 × $6.00 -
×
 A New Look at Exit Strategies with Charles LeBeau
1 × $6.00
A New Look at Exit Strategies with Charles LeBeau
1 × $6.00 -
×
 Algo Trading Masterclass with Ali Casey - StatOasis
1 × $23.00
Algo Trading Masterclass with Ali Casey - StatOasis
1 × $23.00 -
×
 BD FX Course with FX Learning
1 × $6.00
BD FX Course with FX Learning
1 × $6.00 -
×
 The Complete Guide to Multiple Time Frame Analysis & Reading Price Action with Aiman Almansoori
1 × $13.00
The Complete Guide to Multiple Time Frame Analysis & Reading Price Action with Aiman Almansoori
1 × $13.00 -
×
 How To Read The Market Professionally with TradeSmart
1 × $27.00
How To Read The Market Professionally with TradeSmart
1 × $27.00 -
×
 All About Bonds, Bond Mutual Funds & Bond ETFs (3rd Ed.) with Esme Faerber
1 × $6.00
All About Bonds, Bond Mutual Funds & Bond ETFs (3rd Ed.) with Esme Faerber
1 × $6.00 -
×
 Forecast 2024 Clarification with Larry Williams
1 × $15.00
Forecast 2024 Clarification with Larry Williams
1 × $15.00 -
×
 Power Combo with Random Walk Trading
1 × $15.00
Power Combo with Random Walk Trading
1 × $15.00 -
×
 D.A.T.E. Unlock Your Trading DNA Worskshop with Geoff Bysshe
1 × $6.00
D.A.T.E. Unlock Your Trading DNA Worskshop with Geoff Bysshe
1 × $6.00 -
×
 Options, Futures, and Other Derivative Securities
1 × $6.00
Options, Futures, and Other Derivative Securities
1 × $6.00 -
×
 The A14 Weekly Option Strategy Workshop with Amy Meissner
1 × $23.00
The A14 Weekly Option Strategy Workshop with Amy Meissner
1 × $23.00 -
×
 30 Day Masterclass with Joe Elite Trader Hub ICT
1 × $6.00
30 Day Masterclass with Joe Elite Trader Hub ICT
1 × $6.00 -
×
 A Non-Random Walk Down Wall Street with Andrew W.Lo
1 × $6.00
A Non-Random Walk Down Wall Street with Andrew W.Lo
1 × $6.00 -
×
 Algo Wizard Essentials Course with Srategy Quant
1 × $13.00
Algo Wizard Essentials Course with Srategy Quant
1 × $13.00 -
×
 Astro Gann Charting Software Wave59 V 3.6
1 × $6.00
Astro Gann Charting Software Wave59 V 3.6
1 × $6.00 -
×
 The Best of the Professional Traders Journal. Market Timing with Larry Connors
1 × $6.00
The Best of the Professional Traders Journal. Market Timing with Larry Connors
1 × $6.00 -
×
 ETFs for the Long Run: What They Are, How They Work, and Simple Strategies for Successful Long-Term Investing - Lawrence Carrel
1 × $6.00
ETFs for the Long Run: What They Are, How They Work, and Simple Strategies for Successful Long-Term Investing - Lawrence Carrel
1 × $6.00 -
×
 The Indices Orderflow Masterclass with The Forex Scalpers
1 × $23.00
The Indices Orderflow Masterclass with The Forex Scalpers
1 × $23.00 -
×
 Traders Workshop – Forex Full Course with Jason Stapleton
1 × $6.00
Traders Workshop – Forex Full Course with Jason Stapleton
1 × $6.00 -
×
 Module IV - Day Trading to Short Term Swing Trades with FX MindShift
1 × $6.00
Module IV - Day Trading to Short Term Swing Trades with FX MindShift
1 × $6.00 -
×
 Planetary Stock Trading with Bill Meridian
1 × $6.00
Planetary Stock Trading with Bill Meridian
1 × $6.00 -
×
 W. D Gann 's Square Of 9 Applied To Modern Markets with Sean Avidar - Hexatrade350
1 × $23.00
W. D Gann 's Square Of 9 Applied To Modern Markets with Sean Avidar - Hexatrade350
1 × $23.00 -
×
 War Room Psychology Vol. 1 with Pat Mitchell – Trick Trades
1 × $23.00
War Room Psychology Vol. 1 with Pat Mitchell – Trick Trades
1 × $23.00 -
×
 Forex Trading Course. Turn $1,260 Into $12,300 In 30 Days with David Arena
1 × $6.00
Forex Trading Course. Turn $1,260 Into $12,300 In 30 Days with David Arena
1 × $6.00 -
×
 Candlestick Charts with Clive Lambert
1 × $6.00
Candlestick Charts with Clive Lambert
1 × $6.00 -
×
 CBOT Seminar on Market Profile (101 & 102) with Alex Benjamin
1 × $6.00
CBOT Seminar on Market Profile (101 & 102) with Alex Benjamin
1 × $6.00 -
×
 The Insured Portfolio: Your Gateway to Stress-Free Global Investments with Erika Nolan, Marc-Andre Sola & Shannon Crouch
1 × $6.00
The Insured Portfolio: Your Gateway to Stress-Free Global Investments with Erika Nolan, Marc-Andre Sola & Shannon Crouch
1 × $6.00 -
×
 The Prop Trading Code with Brannigan Barrett - Axia Futures
1 × $23.00
The Prop Trading Code with Brannigan Barrett - Axia Futures
1 × $23.00

TTM Slingshot & Value Charts Indicators
$6.00
File Size: Coming soon!
Delivery Time: 1–12 hours
Media Type: Online Course
TTM Slingshot & Value Charts Indicators
Introduction to TTM Slingshot & Value Charts
In the dynamic world of trading, having the right tools can make all the difference. Two such powerful tools are the TTM Slingshot and Value Charts Indicators. These indicators provide traders with crucial insights, helping them navigate market complexities and make informed decisions.
Understanding TTM Slingshot
What is TTM Slingshot?
The TTM Slingshot is an advanced trading indicator developed by John Carter. It combines multiple moving averages to identify potential breakout points in the market. By analyzing the relationship between these moving averages, the TTM Slingshot helps traders spot opportunities for entering or exiting trades.
Key Features of TTM Slingshot
- Multiple Moving Averages: Uses short-term and long-term moving averages.
- Breakout Identification: Detects potential breakout points.
- Versatility: Applicable across various markets and timeframes.
Benefits of Using TTM Slingshot
Enhanced Market Analysis
The TTM Slingshot provides a detailed analysis of market trends, allowing traders to anticipate significant price movements. This indicator’s ability to pinpoint breakout points is invaluable for making timely trading decisions.
Improved Trading Accuracy
By combining multiple moving averages, the TTM Slingshot offers a comprehensive view of the market. This integration reduces noise and enhances the accuracy of predictions, leading to more successful trades.
Setting Up TTM Slingshot
Choosing the Right Platform
To utilize the TTM Slingshot, you’ll need a trading platform that supports custom indicators. Platforms like Thinkorswim and TradeStation are popular choices among traders.
Installing the Indicator
- Download the Indicator: Obtain the TTM Slingshot file compatible with your trading platform.
- Open Your Platform: Launch the trading platform.
- Add the Indicator: Navigate to the ‘Indicators’ section and add the TTM Slingshot file.
- Customize Settings: Adjust the settings to align with your trading strategy.
Understanding Value Charts Indicators
What are Value Charts Indicators?
Value Charts Indicators are tools that measure the relative value of a security based on its price history. These indicators help traders determine whether a security is overvalued, undervalued, or fairly valued, providing a clear picture of potential trading opportunities.
Key Features of Value Charts Indicators
- Relative Value Measurement: Assesses the value of a security.
- Overbought/Oversold Conditions: Identifies extreme market conditions.
- Visual Representation: Displays value levels on a chart for easy interpretation.
Benefits of Using Value Charts Indicators
Identifying Market Extremes
Value Charts Indicators are excellent for spotting overbought and oversold conditions. By identifying these extremes, traders can make strategic decisions about entering or exiting positions.
Enhancing Risk Management
These indicators aid in risk management by providing insights into the relative value of a security. Traders can use this information to set stop-loss levels and protect their investments.
Setting Up Value Charts Indicators
Selecting the Appropriate Platform
Choose a trading platform that supports Value Charts Indicators. Many modern trading platforms, such as NinjaTrader and MetaTrader, offer these indicators.
Installing the Indicator
- Download the Indicator: Obtain the Value Charts Indicator file for your platform.
- Open Your Platform: Start the trading platform.
- Add the Indicator: Go to the ‘Indicators’ section and add the Value Charts file.
- Configure Settings: Customize the settings to fit your trading approach.
How to Use TTM Slingshot & Value Charts Together
Combining Indicators for Better Insights
Using TTM Slingshot and Value Charts Indicators together can enhance your market analysis. While TTM Slingshot identifies breakout points, Value Charts Indicators help assess the relative value of the security, providing a more comprehensive view.
Practical Application
- Entry Points: Use TTM Slingshot to identify breakout points and confirm with Value Charts Indicators to ensure the security is not overvalued.
- Exit Points: Value Charts Indicators can signal overbought conditions, indicating a good time to exit, while TTM Slingshot confirms the end of a trend.
Advanced Strategies with TTM Slingshot & Value Charts
Pairing with Other Indicators
For even more robust analysis, pair TTM Slingshot and Value Charts Indicators with other tools such as RSI (Relative Strength Index) and MACD (Moving Average Convergence Divergence).
Developing a Trading Plan
Create a detailed trading plan that incorporates these indicators. Define your entry and exit points, risk management strategies, and the specific market conditions you’re targeting.
Real-Life Examples
Successful Trade Case Study
Consider a scenario where the TTM Slingshot indicates a breakout, and Value Charts Indicators show the security is undervalued. Entering a trade at this point could lead to significant profits as the price moves to its fair value.
Learning from Mistakes
Analyze trades where the indicators did not predict the expected outcome. Understanding these failures can help refine your strategy and improve future performance.
Conclusion
Maximizing Your Trading Success
The TTM Slingshot and Value Charts Indicators are powerful tools that, when used together, can significantly enhance your trading strategy. By providing insights into market trends and relative value, these indicators help you make more informed decisions.
Taking the Next Step
Start by setting up these indicators on your trading platform. Practice interpreting the signals and integrating them into your trading strategy to see the benefits firsthand.

FAQs
What is the TTM Slingshot indicator?
The TTM Slingshot is a trading tool that uses multiple moving averages to identify breakout points in the market.
How do Value Charts Indicators work?
Value Charts Indicators measure the relative value of a security, helping traders identify overbought and oversold conditions.
Can these indicators be used together?
Yes, combining TTM Slingshot and Value Charts Indicators provides a comprehensive analysis of market trends and security value.
Which platforms support these indicators?
Platforms like Thinkorswim, TradeStation, NinjaTrader, and MetaTrader support TTM Slingshot and Value Charts Indicators.
How do I install these indicators?
Download the respective indicator files, open your trading platform, and add the indicators through the ‘Indicators’ section.
Be the first to review “TTM Slingshot & Value Charts Indicators”
You must be logged in to post a review.
Related products

Forex Trading
Original price was: $2,997.00.$23.00Current price is: $23.00.
Original price was: $450.00.$23.00Current price is: $23.00.

Original price was: $1,800.00.$54.00Current price is: $54.00.

Original price was: $895.00.$15.00Current price is: $15.00.
Original price was: $197.00.$5.00Current price is: $5.00.

Forex Trading
Original price was: $499.00.$15.00Current price is: $15.00.

Forex Trading
Original price was: $999.00.$15.00Current price is: $15.00.
Forex Trading
Original price was: $1,098.00.$39.00Current price is: $39.00.

Original price was: $997.00.$13.00Current price is: $13.00.
Forex Trading
Quantamentals – The Next Great Forefront Of Trading and Investing with Trading Markets
Original price was: $1,495.00.$8.00Current price is: $8.00.
Forex Trading
Original price was: $239.00.$8.00Current price is: $8.00.
Original price was: $1,200.00.$23.00Current price is: $23.00.
Original price was: $299.00.$8.00Current price is: $8.00.
Original price was: $139.00.$23.00Current price is: $23.00.
Forex Trading
Original price was: $799.00.$15.00Current price is: $15.00.

Original price was: $700.00.$39.00Current price is: $39.00.

Forex Trading
Original price was: $850.00.$23.00Current price is: $23.00.

Original price was: $997.00.$8.00Current price is: $8.00.
Forex Trading
Original price was: $397.00.$31.00Current price is: $31.00.
Forex Trading
Original price was: $550.00.$5.00Current price is: $5.00.

Reviews
There are no reviews yet.