-
×
 Advanced Spread Trading with Guy Bower - MasterClass Trader
1 × $15.00
Advanced Spread Trading with Guy Bower - MasterClass Trader
1 × $15.00 -
×
 Fish Forex Robot 4G
1 × $6.00
Fish Forex Robot 4G
1 × $6.00 -
×
 Algo Trading Masterclass with Ali Casey - StatOasis
1 × $23.00
Algo Trading Masterclass with Ali Casey - StatOasis
1 × $23.00 -
×
 How To Read The Market Professionally with TradeSmart
1 × $27.00
How To Read The Market Professionally with TradeSmart
1 × $27.00 -
×
 White Phoenix’s The Smart (Money) Approach to Trading with Jayson Casper
1 × $39.00
White Phoenix’s The Smart (Money) Approach to Trading with Jayson Casper
1 × $39.00 -
×
 Common Sense on Mutual Funds: Fully Updated 10th Anniversary Edition with John Bogle
1 × $6.00
Common Sense on Mutual Funds: Fully Updated 10th Anniversary Edition with John Bogle
1 × $6.00 -
×
 Instant Profits System with Bill Poulos
1 × $6.00
Instant Profits System with Bill Poulos
1 × $6.00 -
×
 W.O.W. Guaranteed Income with Chuck Hughes
1 × $31.00
W.O.W. Guaranteed Income with Chuck Hughes
1 × $31.00 -
×
 Advanced Trading Strategies with Larry Connors
1 × $6.00
Advanced Trading Strategies with Larry Connors
1 × $6.00 -
×
 Trendfans & Trendline Breaks with Albert Yang
1 × $6.00
Trendfans & Trendline Breaks with Albert Yang
1 × $6.00 -
×
 Millionaire Playbook with Jeremy Lefebvre
1 × $62.00
Millionaire Playbook with Jeremy Lefebvre
1 × $62.00 -
×
 XLT - Forex Trading Course
1 × $6.00
XLT - Forex Trading Course
1 × $6.00 -
×
 Trading Mastery Course 2009
1 × $6.00
Trading Mastery Course 2009
1 × $6.00 -
×
 60 Seconds Sure Shot Strategy with Albert E
1 × $6.00
60 Seconds Sure Shot Strategy with Albert E
1 × $6.00 -
×
 Futures Trading Secrets Home Study with Bill McCready
1 × $6.00
Futures Trading Secrets Home Study with Bill McCready
1 × $6.00 -
×
 Yield Farming MasterClass Course (2022) with Boss Financial
1 × $5.00
Yield Farming MasterClass Course (2022) with Boss Financial
1 × $5.00 -
×
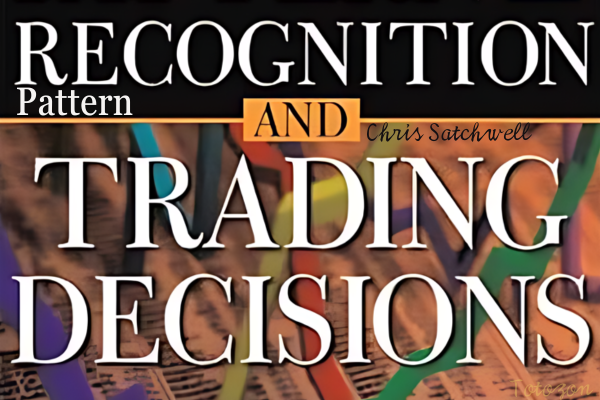 Pattern Recognition & Trading Decisions with Chris Satchwell
1 × $6.00
Pattern Recognition & Trading Decisions with Chris Satchwell
1 × $6.00 -
×
 ICT Prodigy Trading Course – $650K in Payouts with Alex Solignani
1 × $15.00
ICT Prodigy Trading Course – $650K in Payouts with Alex Solignani
1 × $15.00 -
×
 Best of the Best: Collars with Amy Meissner & Scott Ruble
1 × $15.00
Best of the Best: Collars with Amy Meissner & Scott Ruble
1 × $15.00 -
×
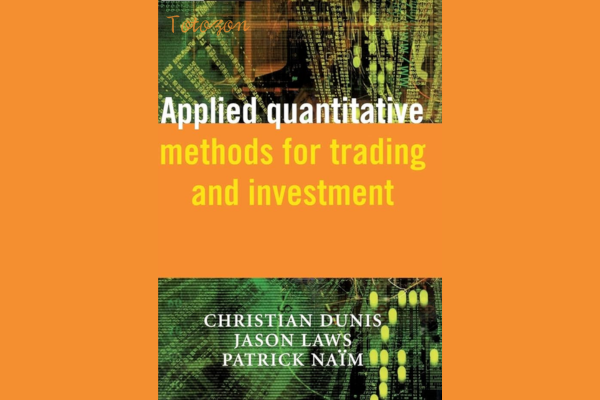 Applied Quantitative Methods for Trading and Investment with Christian Dunis, Jason Laws & Patrick Na¿m
1 × $6.00
Applied Quantitative Methods for Trading and Investment with Christian Dunis, Jason Laws & Patrick Na¿m
1 × $6.00 -
×
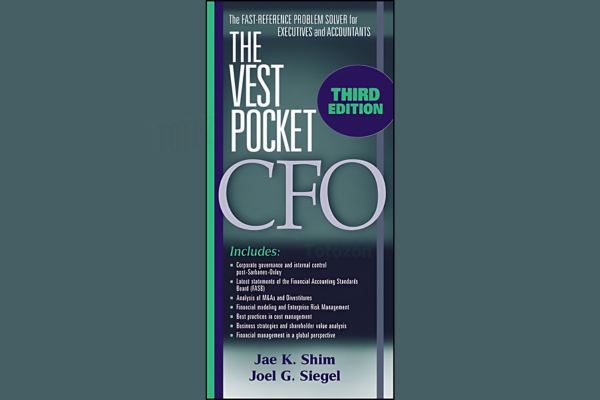 The Vest Pocket CFO (3rd Ed) with Jae Shim
1 × $6.00
The Vest Pocket CFO (3rd Ed) with Jae Shim
1 × $6.00 -
×
 Butterflies For Monthly Income 2016 with Dan Sheridan
1 × $15.00
Butterflies For Monthly Income 2016 with Dan Sheridan
1 × $15.00 -
×
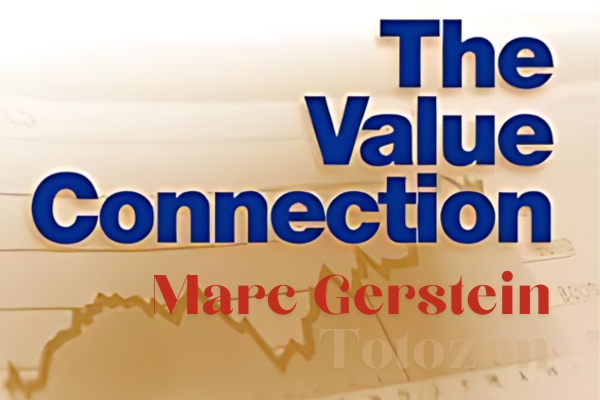 The Value Connection with Marc Gerstein
1 × $5.00
The Value Connection with Marc Gerstein
1 × $5.00 -
×
 Order flow self-study training program with iMFtracker
1 × $10.00
Order flow self-study training program with iMFtracker
1 × $10.00 -
×
 All About Bonds & Mutual Funds with Esme Faerber
1 × $6.00
All About Bonds & Mutual Funds with Esme Faerber
1 × $6.00 -
×
 Out of the Pits with Caitlin Zaloom
1 × $6.00
Out of the Pits with Caitlin Zaloom
1 × $6.00 -
×
 War Room Psychology Vol. 4 with Pat Mitchell – Trick Trades
1 × $23.00
War Room Psychology Vol. 4 with Pat Mitchell – Trick Trades
1 × $23.00 -
×
 Pristine - Dan Gibby – Market Preparation Trading Gaps & Trading the Open
1 × $6.00
Pristine - Dan Gibby – Market Preparation Trading Gaps & Trading the Open
1 × $6.00 -
×
 Yes You Can Time the Market! with Ben Stein
1 × $6.00
Yes You Can Time the Market! with Ben Stein
1 × $6.00 -
×
 4×4 Course with Gregoire Dupont
1 × $6.00
4×4 Course with Gregoire Dupont
1 × $6.00 -
×
 Divergence Super BluePrint with Bill Poulos
1 × $6.00
Divergence Super BluePrint with Bill Poulos
1 × $6.00 -
×
 Handbook of Computer Vision Algorithms in Image Algebra with Gerhard Ritter & Joseph Wilson
1 × $6.00
Handbook of Computer Vision Algorithms in Image Algebra with Gerhard Ritter & Joseph Wilson
1 × $6.00 -
×
 Advanced Swing Trading with John Crane
1 × $6.00
Advanced Swing Trading with John Crane
1 × $6.00 -
×
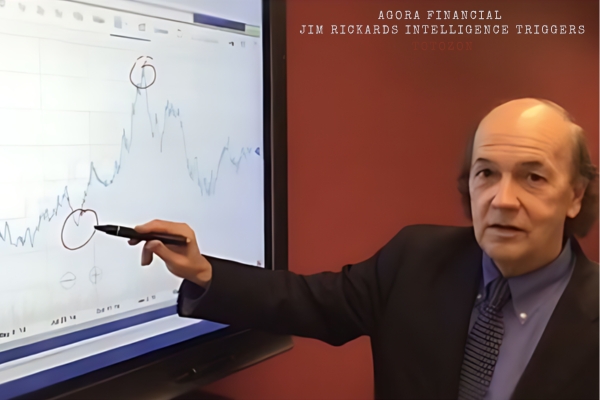 Jim Rickards Intelligence Triggers with Agora Financial
1 × $5.00
Jim Rickards Intelligence Triggers with Agora Financial
1 × $5.00 -
×
 TradeCraft: Your Path to Peak Performance Trading By Adam Grimes
1 × $15.00
TradeCraft: Your Path to Peak Performance Trading By Adam Grimes
1 × $15.00 -
×
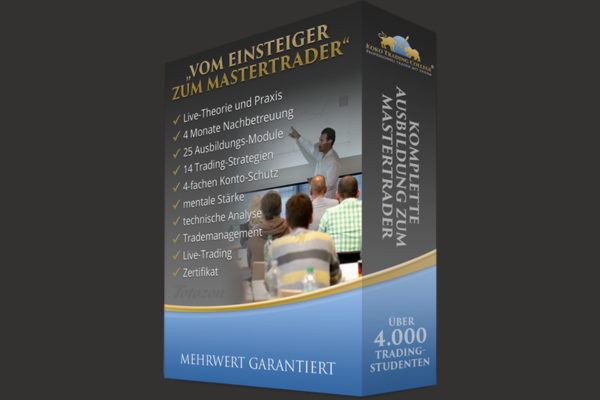 Vom Einsteiger zum Mastertrader 2.0 with Mehrwert Garantier
1 × $109.00
Vom Einsteiger zum Mastertrader 2.0 with Mehrwert Garantier
1 × $109.00 -
×
 Finding Astrocycles with an Ephemeris - Hans Hannula
1 × $6.00
Finding Astrocycles with an Ephemeris - Hans Hannula
1 × $6.00 -
×
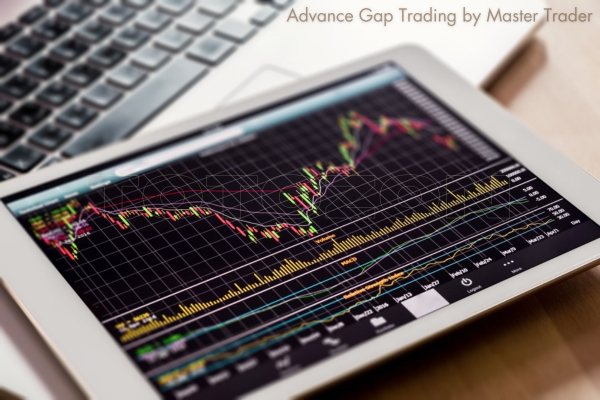 Advance Gap Trading with Master Trader
1 × $39.00
Advance Gap Trading with Master Trader
1 × $39.00 -
×
 All About Dividend Investing with Don Schreiber & Gary Stroik
1 × $6.00
All About Dividend Investing with Don Schreiber & Gary Stroik
1 × $6.00 -
×
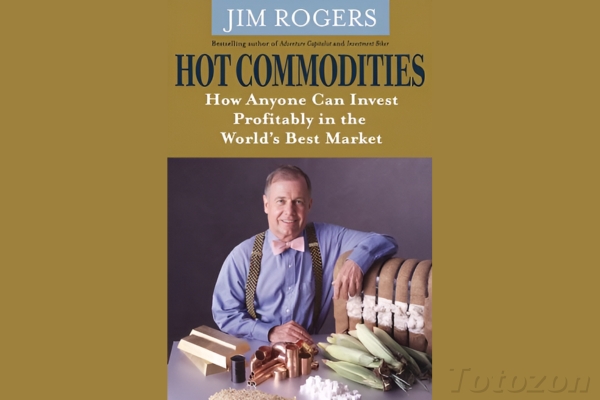 Hot Commodities: How Anyone Can Invest Profitably in the World's Best Market with Jim Rogers
1 × $6.00
Hot Commodities: How Anyone Can Invest Profitably in the World's Best Market with Jim Rogers
1 × $6.00 -
×
 The Superstock Investor with Charles LaLoggia
1 × $6.00
The Superstock Investor with Charles LaLoggia
1 × $6.00 -
×
 Asset Markets, Portfolio Choice and Macroeconomic Activity: A Keynesian Perspective - Toichiro Asadra, Peter Flaschel, Tarik Mouakil & Christian Proaño
1 × $6.00
Asset Markets, Portfolio Choice and Macroeconomic Activity: A Keynesian Perspective - Toichiro Asadra, Peter Flaschel, Tarik Mouakil & Christian Proaño
1 × $6.00 -
×
 An Introduction to Option Trading Success with James Bittman
1 × $6.00
An Introduction to Option Trading Success with James Bittman
1 × $6.00 -
×
 Opening Bell Income Strategy with Todd Mitchell
1 × $54.00
Opening Bell Income Strategy with Todd Mitchell
1 × $54.00 -
×
 The A14 Weekly Option Strategy Workshop with Amy Meissner
1 × $23.00
The A14 Weekly Option Strategy Workshop with Amy Meissner
1 × $23.00 -
×
 ITPM Professional Trading Masterclass (PTM) V2.0 with Anton Kreil
1 × $6.00
ITPM Professional Trading Masterclass (PTM) V2.0 with Anton Kreil
1 × $6.00 -
×
 Analysis of Equity Investments: Valuation with John Stowe, Thomas Robinson, Jerald Pinto & Dennis McLeavey
1 × $6.00
Analysis of Equity Investments: Valuation with John Stowe, Thomas Robinson, Jerald Pinto & Dennis McLeavey
1 × $6.00 -
×
 Forex Millionaire Course with Willis University
1 × $6.00
Forex Millionaire Course with Willis University
1 × $6.00 -
×
 Wave Trading Masterclass: Elliott's Wave Theory/Fibonacci Principles with Wave Trader
1 × $116.00
Wave Trading Masterclass: Elliott's Wave Theory/Fibonacci Principles with Wave Trader
1 × $116.00 -
×
 0 DTE Options Trading Workshop with Aeromir Corporation
1 × $15.00
0 DTE Options Trading Workshop with Aeromir Corporation
1 × $15.00 -
×
 30 Days to Market Mastery: A Step-by-Step Guide to Profitable Trading with Jack Bernstein
1 × $6.00
30 Days to Market Mastery: A Step-by-Step Guide to Profitable Trading with Jack Bernstein
1 × $6.00 -
×
 Iconic Trader Program with Urban Forex
1 × $5.00
Iconic Trader Program with Urban Forex
1 × $5.00 -
×
 Limitless FX Academy Course
1 × $5.00
Limitless FX Academy Course
1 × $5.00 -
×
 The Prop Trading Code with Brannigan Barrett - Axia Futures
1 × $23.00
The Prop Trading Code with Brannigan Barrett - Axia Futures
1 × $23.00 -
×
 Fractal Market Analysis with Edgar Peters
1 × $6.00
Fractal Market Analysis with Edgar Peters
1 × $6.00 -
×
 Mutual Funds: Fifty Years of Research Findings by Seth C. Anderson
1 × $6.00
Mutual Funds: Fifty Years of Research Findings by Seth C. Anderson
1 × $6.00 -
×
 Lee Gettess’s Package
1 × $6.00
Lee Gettess’s Package
1 × $6.00 -
×
 Adx Mastery Complete Course
1 × $6.00
Adx Mastery Complete Course
1 × $6.00 -
×
 Home Run Options Trading Course with Dave Aquino - Base Camp Trading
1 × $11.00
Home Run Options Trading Course with Dave Aquino - Base Camp Trading
1 × $11.00 -
×
 Crystal Ball Pack PLUS bonus Live Trade By Pat Mitchell - Trick Trades
1 × $20.00
Crystal Ball Pack PLUS bonus Live Trade By Pat Mitchell - Trick Trades
1 × $20.00 -
×
 Time Factors in the Stock Market
1 × $6.00
Time Factors in the Stock Market
1 × $6.00 -
×
 Markets 101 Complete Course with Joseph Wang - Central Banking 101
1 × $13.00
Markets 101 Complete Course with Joseph Wang - Central Banking 101
1 × $13.00 -
×
 Advanced Price Action Course with ZenFX
1 × $5.00
Advanced Price Action Course with ZenFX
1 × $5.00 -
×
 Value Investing Today with Charles Brandes
1 × $6.00
Value Investing Today with Charles Brandes
1 × $6.00 -
×
 Self-Managed Trading with Stochastics By George Lane
1 × $4.00
Self-Managed Trading with Stochastics By George Lane
1 × $4.00 -
×
 6 Live Sentiment Analysis Trading Bots using Python with The A.I. Whisperer
1 × $5.00
6 Live Sentiment Analysis Trading Bots using Python with The A.I. Whisperer
1 × $5.00 -
×
 Matrix Spread Options Trading Course with Base Camp Trading
1 × $31.00
Matrix Spread Options Trading Course with Base Camp Trading
1 × $31.00 -
×
 AI For Traders with Trading Markets
1 × $31.00
AI For Traders with Trading Markets
1 × $31.00 -
×
 Point and Figure Mentorship Course
1 × $54.00
Point and Figure Mentorship Course
1 × $54.00 -
×
 A Day In The Life Of A Forex Trader with Vic Noble & Shirley Hudson
1 × $23.00
A Day In The Life Of A Forex Trader with Vic Noble & Shirley Hudson
1 × $23.00 -
×
 Learning Track: Quantitative Approach in Options Trading
1 × $39.00
Learning Track: Quantitative Approach in Options Trading
1 × $39.00 -
×
 WYCKOFF TRADING COURSE (WTC) PART I – ANALYSIS (Fall 2021) with Roman Bogomazov
1 × $209.00
WYCKOFF TRADING COURSE (WTC) PART I – ANALYSIS (Fall 2021) with Roman Bogomazov
1 × $209.00 -
×
 Pristine - Trading the Pristine Method 2
1 × $6.00
Pristine - Trading the Pristine Method 2
1 × $6.00 -
×
 Crypto Trading Academy with Cheeky Investor - Aussie Day Trader
1 × $13.00
Crypto Trading Academy with Cheeky Investor - Aussie Day Trader
1 × $13.00 -
×
 Candlestick - Training Videos (Videos 1.2 GB)
1 × $15.00
Candlestick - Training Videos (Videos 1.2 GB)
1 × $15.00 -
×
 SI Indicator Course 2023 with Scott Pulcini
1 × $15.00
SI Indicator Course 2023 with Scott Pulcini
1 × $15.00 -
×
 The Naked Eye: Raw Data Analytics with Edgar Torres - Raw Data Analytics
1 × $8.00
The Naked Eye: Raw Data Analytics with Edgar Torres - Raw Data Analytics
1 × $8.00 -
×
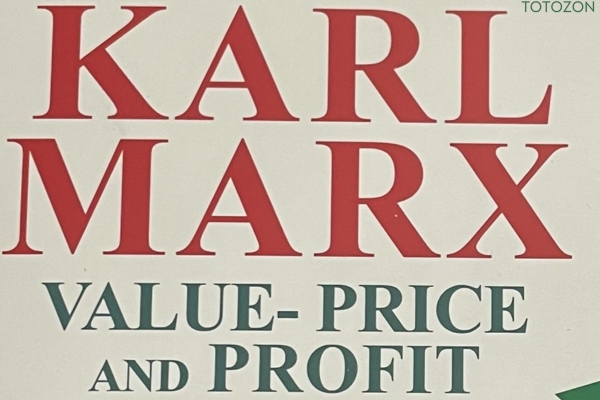 Value, Price & Profit with Karl Marx
1 × $6.00
Value, Price & Profit with Karl Marx
1 × $6.00 -
×
 The Orderflow Masterclass with PrimeTrading
1 × $17.00
The Orderflow Masterclass with PrimeTrading
1 × $17.00 -
×
 Advanced Iron Condor Course in 2021
1 × $6.00
Advanced Iron Condor Course in 2021
1 × $6.00 -
×
 Construction & Application of the MACD Indicator(video) with Gerald Appel
1 × $4.00
Construction & Application of the MACD Indicator(video) with Gerald Appel
1 × $4.00 -
×
 Options for Long Term Trading & Hedging with Option Pit
1 × $39.00
Options for Long Term Trading & Hedging with Option Pit
1 × $39.00 -
×
 Intra-Day Trading with Market Internals I with Greg Capra
1 × $6.00
Intra-Day Trading with Market Internals I with Greg Capra
1 × $6.00 -
×
 Futures Trading (German)
1 × $6.00
Futures Trading (German)
1 × $6.00 -
×
 Breakout Trading Systems with Chris Tate
1 × $6.00
Breakout Trading Systems with Chris Tate
1 × $6.00 -
×
 Applications of Abstract Algebra with Maple - Richard E.Kline, Neil Sigmon, Ernst Stitzinger
1 × $6.00
Applications of Abstract Algebra with Maple - Richard E.Kline, Neil Sigmon, Ernst Stitzinger
1 × $6.00 -
×
 Compass Trading System with Right Line Trading
1 × $39.00
Compass Trading System with Right Line Trading
1 × $39.00 -
×
 Scalp Strategy and Flipping Small Accounts with Opes Trading Group
1 × $5.00
Scalp Strategy and Flipping Small Accounts with Opes Trading Group
1 × $5.00 -
×
 Profitable DayTrading with Precision - George Angell
1 × $6.00
Profitable DayTrading with Precision - George Angell
1 × $6.00 -
×
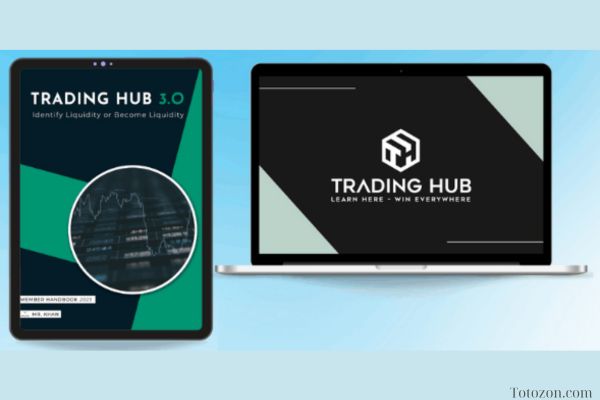 Trading Hub 4.0 with Mr. Khan
1 × $27.00
Trading Hub 4.0 with Mr. Khan
1 × $27.00 -
×
 Accumulation & Distribution with Larry Williams
1 × $4.00
Accumulation & Distribution with Larry Williams
1 × $4.00 -
×
 Trading NQ At The US Open with TradeSmart
1 × $10.00
Trading NQ At The US Open with TradeSmart
1 × $10.00 -
×
 The Use The Moon Trading 2020 Group Webinars Series with Market Occultations
1 × $62.00
The Use The Moon Trading 2020 Group Webinars Series with Market Occultations
1 × $62.00 -
×
 Galactic Trader Seminar
1 × $15.00
Galactic Trader Seminar
1 × $15.00 -
×
 Corruption and Reform: Lessons from America's Economic History with Edward Glaeser & Claudia Goldin
1 × $6.00
Corruption and Reform: Lessons from America's Economic History with Edward Glaeser & Claudia Goldin
1 × $6.00 -
×
 Traders Secret Library
1 × $6.00
Traders Secret Library
1 × $6.00 -
×
 Options Trading & Ultimate MasterClass With Tyrone Abela - FX Evolution
1 × $54.00
Options Trading & Ultimate MasterClass With Tyrone Abela - FX Evolution
1 × $54.00

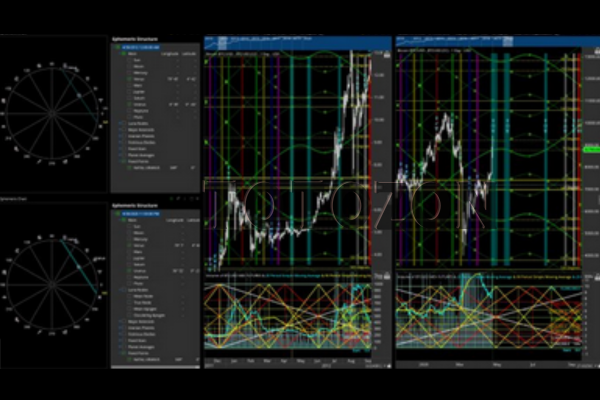
TTM Slingshot & Value Charts Indicators
$6.00
File Size: Coming soon!
Delivery Time: 1–12 hours
Media Type: Online Course
TTM Slingshot & Value Charts Indicators
Introduction to TTM Slingshot & Value Charts
In the dynamic world of trading, having the right tools can make all the difference. Two such powerful tools are the TTM Slingshot and Value Charts Indicators. These indicators provide traders with crucial insights, helping them navigate market complexities and make informed decisions.
Understanding TTM Slingshot
What is TTM Slingshot?
The TTM Slingshot is an advanced trading indicator developed by John Carter. It combines multiple moving averages to identify potential breakout points in the market. By analyzing the relationship between these moving averages, the TTM Slingshot helps traders spot opportunities for entering or exiting trades.
Key Features of TTM Slingshot
- Multiple Moving Averages: Uses short-term and long-term moving averages.
- Breakout Identification: Detects potential breakout points.
- Versatility: Applicable across various markets and timeframes.
Benefits of Using TTM Slingshot
Enhanced Market Analysis
The TTM Slingshot provides a detailed analysis of market trends, allowing traders to anticipate significant price movements. This indicator’s ability to pinpoint breakout points is invaluable for making timely trading decisions.
Improved Trading Accuracy
By combining multiple moving averages, the TTM Slingshot offers a comprehensive view of the market. This integration reduces noise and enhances the accuracy of predictions, leading to more successful trades.
Setting Up TTM Slingshot
Choosing the Right Platform
To utilize the TTM Slingshot, you’ll need a trading platform that supports custom indicators. Platforms like Thinkorswim and TradeStation are popular choices among traders.
Installing the Indicator
- Download the Indicator: Obtain the TTM Slingshot file compatible with your trading platform.
- Open Your Platform: Launch the trading platform.
- Add the Indicator: Navigate to the ‘Indicators’ section and add the TTM Slingshot file.
- Customize Settings: Adjust the settings to align with your trading strategy.
Understanding Value Charts Indicators
What are Value Charts Indicators?
Value Charts Indicators are tools that measure the relative value of a security based on its price history. These indicators help traders determine whether a security is overvalued, undervalued, or fairly valued, providing a clear picture of potential trading opportunities.
Key Features of Value Charts Indicators
- Relative Value Measurement: Assesses the value of a security.
- Overbought/Oversold Conditions: Identifies extreme market conditions.
- Visual Representation: Displays value levels on a chart for easy interpretation.
Benefits of Using Value Charts Indicators
Identifying Market Extremes
Value Charts Indicators are excellent for spotting overbought and oversold conditions. By identifying these extremes, traders can make strategic decisions about entering or exiting positions.
Enhancing Risk Management
These indicators aid in risk management by providing insights into the relative value of a security. Traders can use this information to set stop-loss levels and protect their investments.
Setting Up Value Charts Indicators
Selecting the Appropriate Platform
Choose a trading platform that supports Value Charts Indicators. Many modern trading platforms, such as NinjaTrader and MetaTrader, offer these indicators.
Installing the Indicator
- Download the Indicator: Obtain the Value Charts Indicator file for your platform.
- Open Your Platform: Start the trading platform.
- Add the Indicator: Go to the ‘Indicators’ section and add the Value Charts file.
- Configure Settings: Customize the settings to fit your trading approach.
How to Use TTM Slingshot & Value Charts Together
Combining Indicators for Better Insights
Using TTM Slingshot and Value Charts Indicators together can enhance your market analysis. While TTM Slingshot identifies breakout points, Value Charts Indicators help assess the relative value of the security, providing a more comprehensive view.
Practical Application
- Entry Points: Use TTM Slingshot to identify breakout points and confirm with Value Charts Indicators to ensure the security is not overvalued.
- Exit Points: Value Charts Indicators can signal overbought conditions, indicating a good time to exit, while TTM Slingshot confirms the end of a trend.
Advanced Strategies with TTM Slingshot & Value Charts
Pairing with Other Indicators
For even more robust analysis, pair TTM Slingshot and Value Charts Indicators with other tools such as RSI (Relative Strength Index) and MACD (Moving Average Convergence Divergence).
Developing a Trading Plan
Create a detailed trading plan that incorporates these indicators. Define your entry and exit points, risk management strategies, and the specific market conditions you’re targeting.
Real-Life Examples
Successful Trade Case Study
Consider a scenario where the TTM Slingshot indicates a breakout, and Value Charts Indicators show the security is undervalued. Entering a trade at this point could lead to significant profits as the price moves to its fair value.
Learning from Mistakes
Analyze trades where the indicators did not predict the expected outcome. Understanding these failures can help refine your strategy and improve future performance.
Conclusion
Maximizing Your Trading Success
The TTM Slingshot and Value Charts Indicators are powerful tools that, when used together, can significantly enhance your trading strategy. By providing insights into market trends and relative value, these indicators help you make more informed decisions.
Taking the Next Step
Start by setting up these indicators on your trading platform. Practice interpreting the signals and integrating them into your trading strategy to see the benefits firsthand.

FAQs
What is the TTM Slingshot indicator?
The TTM Slingshot is a trading tool that uses multiple moving averages to identify breakout points in the market.
How do Value Charts Indicators work?
Value Charts Indicators measure the relative value of a security, helping traders identify overbought and oversold conditions.
Can these indicators be used together?
Yes, combining TTM Slingshot and Value Charts Indicators provides a comprehensive analysis of market trends and security value.
Which platforms support these indicators?
Platforms like Thinkorswim, TradeStation, NinjaTrader, and MetaTrader support TTM Slingshot and Value Charts Indicators.
How do I install these indicators?
Download the respective indicator files, open your trading platform, and add the indicators through the ‘Indicators’ section.
Be the first to review “TTM Slingshot & Value Charts Indicators”
You must be logged in to post a review.
Related products

Original price was: $695.00.$41.00Current price is: $41.00.

Forex Trading
The Complete Guide to Multiple Time Frame Analysis & Reading Price Action with Aiman Almansoori
Original price was: $1,399.00.$13.00Current price is: $13.00.
Original price was: $997.00.$13.00Current price is: $13.00.
Original price was: $895.00.$15.00Current price is: $15.00.
Forex Trading
Original price was: $2,000.00.$23.00Current price is: $23.00.

Forex Trading
Original price was: $397.00.$31.00Current price is: $31.00.
Original price was: $649.00.$20.00Current price is: $20.00.
Original price was: $999.00.$5.00Current price is: $5.00.
Forex Trading
Original price was: $999.00.$15.00Current price is: $15.00.

Forex Trading
Original price was: $239.00.$8.00Current price is: $8.00.
Forex Trading
Original price was: $1,098.00.$39.00Current price is: $39.00.
Forex Trading
Original price was: $1,898.00.$10.00Current price is: $10.00.
Forex Trading
Original price was: $2,995.00.$31.00Current price is: $31.00.

Forex Trading
Original price was: $850.00.$23.00Current price is: $23.00.

Forex Trading
Original price was: $550.00.$5.00Current price is: $5.00.

Forex Trading
Original price was: $500.00.$5.00Current price is: $5.00.
Forex Trading
Original price was: $4,997.00.$27.00Current price is: $27.00.
Original price was: $497.00.$11.00Current price is: $11.00.

Forex Trading
Original price was: $799.00.$15.00Current price is: $15.00.

Forex Trading
Original price was: $697.00.$5.00Current price is: $5.00.

Reviews
There are no reviews yet.