-
×
 Advanced Spread Trading with Guy Bower - MasterClass Trader
1 × $15.00
Advanced Spread Trading with Guy Bower - MasterClass Trader
1 × $15.00 -
×
 The New Trading For a Living with Alexander Elder
1 × $23.00
The New Trading For a Living with Alexander Elder
1 × $23.00 -
×
 How To Read The Market Professionally with TradeSmart
1 × $27.00
How To Read The Market Professionally with TradeSmart
1 × $27.00 -
×
 Trading Forecasts Manual with Yuri Shramenko
1 × $4.00
Trading Forecasts Manual with Yuri Shramenko
1 × $4.00 -
×
 Best of the Best: Collars with Amy Meissner & Scott Ruble
1 × $15.00
Best of the Best: Collars with Amy Meissner & Scott Ruble
1 × $15.00 -
×
 Market Profile Course
1 × $54.00
Market Profile Course
1 × $54.00 -
×
 Build A Solid Foundation For Trading Options with Corey Halliday
1 × $6.00
Build A Solid Foundation For Trading Options with Corey Halliday
1 × $6.00 -
×
 BOSSPack Course with Pat Mitchell – Trick Trades
1 × $69.00
BOSSPack Course with Pat Mitchell – Trick Trades
1 × $69.00 -
×
 W. D Gann 's Square Of 9 Applied To Modern Markets with Sean Avidar - Hexatrade350
1 × $23.00
W. D Gann 's Square Of 9 Applied To Modern Markets with Sean Avidar - Hexatrade350
1 × $23.00 -
×
 Wealth Management with Dimitris Chorafas
1 × $6.00
Wealth Management with Dimitris Chorafas
1 × $6.00 -
×
 Crystal Ball Pack PLUS bonus Live Trade By Pat Mitchell - Trick Trades
1 × $20.00
Crystal Ball Pack PLUS bonus Live Trade By Pat Mitchell - Trick Trades
1 × $20.00 -
×
 Lit Trading Course
1 × $15.00
Lit Trading Course
1 × $15.00 -
×
 PROFESSIONAL TRADING EDUCATION with The MarketDelta Edge
1 × $78.00
PROFESSIONAL TRADING EDUCATION with The MarketDelta Edge
1 × $78.00 -
×
 SQX Mentorship with Tip Toe Hippo
1 × $23.00
SQX Mentorship with Tip Toe Hippo
1 × $23.00 -
×
 Hit and Run Trading Updated Version with Jeff Cooper
1 × $6.00
Hit and Run Trading Updated Version with Jeff Cooper
1 × $6.00 -
×
 Options Trading & Ultimate MasterClass With Tyrone Abela - FX Evolution
1 × $54.00
Options Trading & Ultimate MasterClass With Tyrone Abela - FX Evolution
1 × $54.00 -
×
 Inner Circle Trader ICT Mentorship 2021 with Michael Huddleston
1 × $5.00
Inner Circle Trader ICT Mentorship 2021 with Michael Huddleston
1 × $5.00 -
×
 Secrets of Swiss Banking with Hoyt Barber
1 × $6.00
Secrets of Swiss Banking with Hoyt Barber
1 × $6.00 -
×
 The Trading Blueprint with Brad Goh - The Trading Geek
1 × $5.00
The Trading Blueprint with Brad Goh - The Trading Geek
1 × $5.00 -
×
 Level II Trading Warfare - The Undergroundtrader's Powerful Weapons for Winning - Jea Yu
1 × $6.00
Level II Trading Warfare - The Undergroundtrader's Powerful Weapons for Winning - Jea Yu
1 × $6.00 -
×
 Millionaire Playbook with Jeremy Lefebvre
1 × $62.00
Millionaire Playbook with Jeremy Lefebvre
1 × $62.00 -
×
 The Naked Eye: Raw Data Analytics with Edgar Torres - Raw Data Analytics
1 × $8.00
The Naked Eye: Raw Data Analytics with Edgar Torres - Raw Data Analytics
1 × $8.00 -
×
 Trading Short TermSame Day Trades Sep 2023 with Dan Sheridan & Mark Fenton - Sheridan Options Mentoring
1 × $31.00
Trading Short TermSame Day Trades Sep 2023 with Dan Sheridan & Mark Fenton - Sheridan Options Mentoring
1 × $31.00 -
×
 $20 – 52k 20 pips a day challange with Rafał Zuchowicz - TopMasterTrader
1 × $5.00
$20 – 52k 20 pips a day challange with Rafał Zuchowicz - TopMasterTrader
1 × $5.00 -
×
 Stealth Trader (Ebook) with Andy Jordan - Trading Educators
1 × $132.00
Stealth Trader (Ebook) with Andy Jordan - Trading Educators
1 × $132.00 -
×
 Price Action Forex Trading Strategies Training Course & Members Videos with Nial Fuller
1 × $28.00
Price Action Forex Trading Strategies Training Course & Members Videos with Nial Fuller
1 × $28.00 -
×
 Seven Principles of Great Trading (Audio CD) By Van Tharp
1 × $6.00
Seven Principles of Great Trading (Audio CD) By Van Tharp
1 × $6.00 -
×
 Forecast 2024 Clarification with Larry Williams
1 × $15.00
Forecast 2024 Clarification with Larry Williams
1 × $15.00 -
×
 TradeCraft: Your Path to Peak Performance Trading By Adam Grimes
1 × $15.00
TradeCraft: Your Path to Peak Performance Trading By Adam Grimes
1 × $15.00 -
×
 Evolutionary Decision Trees for Stock Index Options and Futures Arbitrage by S.Markose, E.Tsang,H.Er
1 × $6.00
Evolutionary Decision Trees for Stock Index Options and Futures Arbitrage by S.Markose, E.Tsang,H.Er
1 × $6.00 -
×
 Breakouts with Feibel Trading
1 × $5.00
Breakouts with Feibel Trading
1 × $5.00 -
×
 Netpicks - The Ultimate Trading Machine Complete Set of Courses, TS Indicators & Daily Updates
1 × $6.00
Netpicks - The Ultimate Trading Machine Complete Set of Courses, TS Indicators & Daily Updates
1 × $6.00 -
×
 The Art Of Adaptive Trading Using Market Profile & Market Delta
1 × $23.00
The Art Of Adaptive Trading Using Market Profile & Market Delta
1 × $23.00 -
×
 Hot Trading Investing Strategy: ETF and Futures with QSB Funds
1 × $6.00
Hot Trading Investing Strategy: ETF and Futures with QSB Funds
1 × $6.00 -
×
 Greatest Trading Tools with Michael Parsons
1 × $6.00
Greatest Trading Tools with Michael Parsons
1 × $6.00 -
×
 Deep Dive Butterfly Trading Strategy Class with SJG Trades
1 × $41.00
Deep Dive Butterfly Trading Strategy Class with SJG Trades
1 × $41.00 -
×
 Self-Study Day Trading Course
1 × $39.00
Self-Study Day Trading Course
1 × $39.00 -
×
 Option Profits Success System
1 × $54.00
Option Profits Success System
1 × $54.00 -
×
 Orderflows Gems 2-Private Sessions with Mike Valtos
1 × $20.00
Orderflows Gems 2-Private Sessions with Mike Valtos
1 × $20.00 -
×
 Algo Trading Masterclass with Ali Casey - StatOasis
1 × $23.00
Algo Trading Masterclass with Ali Casey - StatOasis
1 × $23.00 -
×
 Butterfly and Condor Workshop with Aeromir
1 × $15.00
Butterfly and Condor Workshop with Aeromir
1 × $15.00 -
×
 Technical Analysis. The Basis with Glenn Ring
1 × $6.00
Technical Analysis. The Basis with Glenn Ring
1 × $6.00 -
×
 Forex Strategies Course For Weekly Charts with Cory Mitchell - Vantage Point Trading
1 × $4.00
Forex Strategies Course For Weekly Charts with Cory Mitchell - Vantage Point Trading
1 × $4.00 -
×
 The Complete Guide to Multiple Time Frame Analysis & Reading Price Action with Aiman Almansoori
1 × $13.00
The Complete Guide to Multiple Time Frame Analysis & Reading Price Action with Aiman Almansoori
1 × $13.00 -
×
 The Geography of Money with Benjamin J.Cohen
1 × $6.00
The Geography of Money with Benjamin J.Cohen
1 × $6.00 -
×
 Professional Level Trading (IPLT) Online Video Series with Anton Kreil
1 × $6.00
Professional Level Trading (IPLT) Online Video Series with Anton Kreil
1 × $6.00 -
×
 The Indices Orderflow Masterclass with The Forex Scalpers
1 × $23.00
The Indices Orderflow Masterclass with The Forex Scalpers
1 × $23.00 -
×
 My Favorite Trades – Trading Mastery
1 × $6.00
My Favorite Trades – Trading Mastery
1 × $6.00 -
×
 Quantamentals - The Next Great Forefront Of Trading and Investing with Trading Markets
1 × $8.00
Quantamentals - The Next Great Forefront Of Trading and Investing with Trading Markets
1 × $8.00 -
×
 EZ2 Trade Charting Collection eSignal (ez2tradesoftware.com) - Raghee Horner
1 × $6.00
EZ2 Trade Charting Collection eSignal (ez2tradesoftware.com) - Raghee Horner
1 × $6.00 -
×
 Learning How to Successfully Trade the E-mini & S&P 500 Markets
1 × $6.00
Learning How to Successfully Trade the E-mini & S&P 500 Markets
1 × $6.00 -
×
 Insider Signal Exclusive Forex Course - 9 CD with Andy X
1 × $6.00
Insider Signal Exclusive Forex Course - 9 CD with Andy X
1 × $6.00 -
×
 WondaFX Signature Strategy with WondaFX
1 × $5.00
WondaFX Signature Strategy with WondaFX
1 × $5.00 -
×
 A Grand Supercycle Top Webinar with Steven Hochberg
1 × $6.00
A Grand Supercycle Top Webinar with Steven Hochberg
1 × $6.00 -
×
 Arcane 2.0 Course
1 × $6.00
Arcane 2.0 Course
1 × $6.00 -
×
 Monthly Cash Flow Trading Options (Intermediate Option Trading Course) with Randy Perez
1 × $85.00
Monthly Cash Flow Trading Options (Intermediate Option Trading Course) with Randy Perez
1 × $85.00 -
×
 Neowave. Inovations that Make Elliott Wave Work Better for You with Glenn Neely
1 × $6.00
Neowave. Inovations that Make Elliott Wave Work Better for You with Glenn Neely
1 × $6.00 -
×
 TRADING NFX Course with Andrew NFX
1 × $5.00
TRADING NFX Course with Andrew NFX
1 × $5.00 -
×
 High Reward Low Risk Forex Trading with Jarratt Davis and Vic Noble
1 × $6.00
High Reward Low Risk Forex Trading with Jarratt Davis and Vic Noble
1 × $6.00 -
×
 The Orderflow Masterclass with PrimeTrading
1 × $17.00
The Orderflow Masterclass with PrimeTrading
1 × $17.00 -
×
 OneUmbrellaFX
1 × $5.00
OneUmbrellaFX
1 × $5.00 -
×
 Dynamic Swing Trader-NETPICKS (Unlocked)
1 × $54.00
Dynamic Swing Trader-NETPICKS (Unlocked)
1 × $54.00 -
×
 Lessons from the Greatest Stock Traders of all Time with John Boik
1 × $6.00
Lessons from the Greatest Stock Traders of all Time with John Boik
1 × $6.00 -
×
 The A14 Weekly Option Strategy Workshop with Amy Meissner
1 × $23.00
The A14 Weekly Option Strategy Workshop with Amy Meissner
1 × $23.00 -
×
 The Ultimate Trader Transformation
1 × $62.00
The Ultimate Trader Transformation
1 × $62.00 -
×
 My Trading Strategy with Evolved Traders
1 × $5.00
My Trading Strategy with Evolved Traders
1 × $5.00 -
×
 Matrix Spread Options Trading Course with Base Camp Trading
1 × $31.00
Matrix Spread Options Trading Course with Base Camp Trading
1 × $31.00 -
×
 AI For Traders with Trading Markets
1 × $31.00
AI For Traders with Trading Markets
1 × $31.00 -
×
 Learn to Make Money Trading Options
1 × $6.00
Learn to Make Money Trading Options
1 × $6.00 -
×
 Forex Powerband Dominator
1 × $6.00
Forex Powerband Dominator
1 × $6.00 -
×
 Essentials in Quantitative Trading QT01 By HangukQuant's
1 × $23.00
Essentials in Quantitative Trading QT01 By HangukQuant's
1 × $23.00 -
×
 Advanced AmiBroker Coding with Matt Radtke & Connors Research
1 × $23.00
Advanced AmiBroker Coding with Matt Radtke & Connors Research
1 × $23.00 -
×
 The Orderflows Trade Opportunities Encyclopedia with Michael Valtos
1 × $8.00
The Orderflows Trade Opportunities Encyclopedia with Michael Valtos
1 × $8.00 -
×
 XLT - Forex Trading Course
1 × $6.00
XLT - Forex Trading Course
1 × $6.00 -
×
 Crypto Trading Academy with Cheeky Investor - Aussie Day Trader
1 × $13.00
Crypto Trading Academy with Cheeky Investor - Aussie Day Trader
1 × $13.00 -
×
 White Phoenix’s The Smart (Money) Approach to Trading with Jayson Casper
1 × $39.00
White Phoenix’s The Smart (Money) Approach to Trading with Jayson Casper
1 × $39.00 -
×
 One-way Formula for Trading in Stocks and Commodities with William Dunnigan
1 × $6.00
One-way Formula for Trading in Stocks and Commodities with William Dunnigan
1 × $6.00 -
×
 August Forex Golem V3
1 × $6.00
August Forex Golem V3
1 × $6.00 -
×
 Trend Following: How Great Traders Make Millions in Up or Down Markets with Michael Covel
1 × $6.00
Trend Following: How Great Traders Make Millions in Up or Down Markets with Michael Covel
1 × $6.00 -
×
 Intra-Day Trading Techniques CD with Greg Capra
1 × $6.00
Intra-Day Trading Techniques CD with Greg Capra
1 × $6.00 -
×
 Original Charting 1936 with W.D.Gann
1 × $6.00
Original Charting 1936 with W.D.Gann
1 × $6.00 -
×
 DNA Wealth Blueprint 3 (Complete)
1 × $54.00
DNA Wealth Blueprint 3 (Complete)
1 × $54.00 -
×
 Pay me in Stock Options with Carol Curtis
1 × $6.00
Pay me in Stock Options with Carol Curtis
1 × $6.00 -
×
 The Volatility Surface with Jim Gatheral
1 × $6.00
The Volatility Surface with Jim Gatheral
1 × $6.00 -
×
 Market Risk Analysis, Volume IV, Value at Risk Models with Carol Alexander
1 × $6.00
Market Risk Analysis, Volume IV, Value at Risk Models with Carol Alexander
1 × $6.00 -
×
 Mastering The ICO: Spotting Needles In A Haystack with Alphashark
1 × $39.00
Mastering The ICO: Spotting Needles In A Haystack with Alphashark
1 × $39.00 -
×
 Protecting your Retirement Account in a Correction with Dan Sheridan - Sheridan Options Mentoring
1 × $31.00
Protecting your Retirement Account in a Correction with Dan Sheridan - Sheridan Options Mentoring
1 × $31.00 -
×
 Renko Mastery with Thomas Wood
1 × $15.00
Renko Mastery with Thomas Wood
1 × $15.00 -
×
 Price Headley - Using Williams %R The BigTrends Way
1 × $6.00
Price Headley - Using Williams %R The BigTrends Way
1 × $6.00 -
×
 Slump Busting Techniques with Linda Raschke
1 × $4.00
Slump Busting Techniques with Linda Raschke
1 × $4.00 -
×
 Vom Einsteiger zum Mastertrader 2.0 with Mehrwert Garantier
1 × $109.00
Vom Einsteiger zum Mastertrader 2.0 with Mehrwert Garantier
1 × $109.00 -
×
 0 DTE Options Trading Workshop with Aeromir Corporation
1 × $15.00
0 DTE Options Trading Workshop with Aeromir Corporation
1 × $15.00 -
×
 High Powered Investing with Amine Bouchentouf
1 × $6.00
High Powered Investing with Amine Bouchentouf
1 × $6.00 -
×
 The C3PO Forex Trading Strategy with Jared Passey
1 × $4.00
The C3PO Forex Trading Strategy with Jared Passey
1 × $4.00 -
×
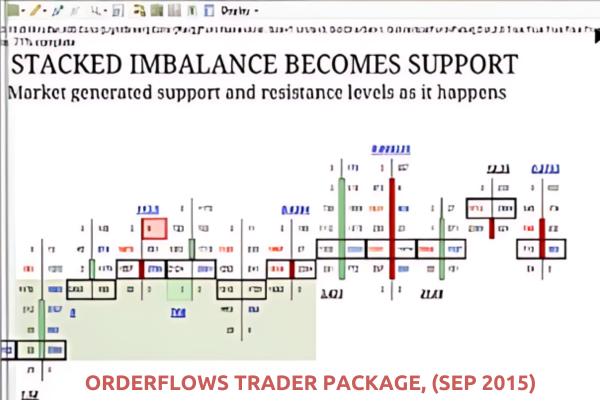 OrderFlows Trader Package, (Sep 2015)
1 × $54.00
OrderFlows Trader Package, (Sep 2015)
1 × $54.00 -
×
 Market Profile Training with Futexlive
1 × $23.00
Market Profile Training with Futexlive
1 × $23.00 -
×
 The Ultimate Trading Program with Tradeciety
1 × $5.00
The Ultimate Trading Program with Tradeciety
1 × $5.00 -
×
 Rate of Change Indicator with Alphashark
1 × $31.00
Rate of Change Indicator with Alphashark
1 × $31.00

TTM Slingshot & Value Charts Indicators
$6.00
File Size: Coming soon!
Delivery Time: 1–12 hours
Media Type: Online Course
TTM Slingshot & Value Charts Indicators
Introduction to TTM Slingshot & Value Charts
In the dynamic world of trading, having the right tools can make all the difference. Two such powerful tools are the TTM Slingshot and Value Charts Indicators. These indicators provide traders with crucial insights, helping them navigate market complexities and make informed decisions.
Understanding TTM Slingshot
What is TTM Slingshot?
The TTM Slingshot is an advanced trading indicator developed by John Carter. It combines multiple moving averages to identify potential breakout points in the market. By analyzing the relationship between these moving averages, the TTM Slingshot helps traders spot opportunities for entering or exiting trades.
Key Features of TTM Slingshot
- Multiple Moving Averages: Uses short-term and long-term moving averages.
- Breakout Identification: Detects potential breakout points.
- Versatility: Applicable across various markets and timeframes.
Benefits of Using TTM Slingshot
Enhanced Market Analysis
The TTM Slingshot provides a detailed analysis of market trends, allowing traders to anticipate significant price movements. This indicator’s ability to pinpoint breakout points is invaluable for making timely trading decisions.
Improved Trading Accuracy
By combining multiple moving averages, the TTM Slingshot offers a comprehensive view of the market. This integration reduces noise and enhances the accuracy of predictions, leading to more successful trades.
Setting Up TTM Slingshot
Choosing the Right Platform
To utilize the TTM Slingshot, you’ll need a trading platform that supports custom indicators. Platforms like Thinkorswim and TradeStation are popular choices among traders.
Installing the Indicator
- Download the Indicator: Obtain the TTM Slingshot file compatible with your trading platform.
- Open Your Platform: Launch the trading platform.
- Add the Indicator: Navigate to the ‘Indicators’ section and add the TTM Slingshot file.
- Customize Settings: Adjust the settings to align with your trading strategy.
Understanding Value Charts Indicators
What are Value Charts Indicators?
Value Charts Indicators are tools that measure the relative value of a security based on its price history. These indicators help traders determine whether a security is overvalued, undervalued, or fairly valued, providing a clear picture of potential trading opportunities.
Key Features of Value Charts Indicators
- Relative Value Measurement: Assesses the value of a security.
- Overbought/Oversold Conditions: Identifies extreme market conditions.
- Visual Representation: Displays value levels on a chart for easy interpretation.
Benefits of Using Value Charts Indicators
Identifying Market Extremes
Value Charts Indicators are excellent for spotting overbought and oversold conditions. By identifying these extremes, traders can make strategic decisions about entering or exiting positions.
Enhancing Risk Management
These indicators aid in risk management by providing insights into the relative value of a security. Traders can use this information to set stop-loss levels and protect their investments.
Setting Up Value Charts Indicators
Selecting the Appropriate Platform
Choose a trading platform that supports Value Charts Indicators. Many modern trading platforms, such as NinjaTrader and MetaTrader, offer these indicators.
Installing the Indicator
- Download the Indicator: Obtain the Value Charts Indicator file for your platform.
- Open Your Platform: Start the trading platform.
- Add the Indicator: Go to the ‘Indicators’ section and add the Value Charts file.
- Configure Settings: Customize the settings to fit your trading approach.
How to Use TTM Slingshot & Value Charts Together
Combining Indicators for Better Insights
Using TTM Slingshot and Value Charts Indicators together can enhance your market analysis. While TTM Slingshot identifies breakout points, Value Charts Indicators help assess the relative value of the security, providing a more comprehensive view.
Practical Application
- Entry Points: Use TTM Slingshot to identify breakout points and confirm with Value Charts Indicators to ensure the security is not overvalued.
- Exit Points: Value Charts Indicators can signal overbought conditions, indicating a good time to exit, while TTM Slingshot confirms the end of a trend.
Advanced Strategies with TTM Slingshot & Value Charts
Pairing with Other Indicators
For even more robust analysis, pair TTM Slingshot and Value Charts Indicators with other tools such as RSI (Relative Strength Index) and MACD (Moving Average Convergence Divergence).
Developing a Trading Plan
Create a detailed trading plan that incorporates these indicators. Define your entry and exit points, risk management strategies, and the specific market conditions you’re targeting.
Real-Life Examples
Successful Trade Case Study
Consider a scenario where the TTM Slingshot indicates a breakout, and Value Charts Indicators show the security is undervalued. Entering a trade at this point could lead to significant profits as the price moves to its fair value.
Learning from Mistakes
Analyze trades where the indicators did not predict the expected outcome. Understanding these failures can help refine your strategy and improve future performance.
Conclusion
Maximizing Your Trading Success
The TTM Slingshot and Value Charts Indicators are powerful tools that, when used together, can significantly enhance your trading strategy. By providing insights into market trends and relative value, these indicators help you make more informed decisions.
Taking the Next Step
Start by setting up these indicators on your trading platform. Practice interpreting the signals and integrating them into your trading strategy to see the benefits firsthand.

FAQs
What is the TTM Slingshot indicator?
The TTM Slingshot is a trading tool that uses multiple moving averages to identify breakout points in the market.
How do Value Charts Indicators work?
Value Charts Indicators measure the relative value of a security, helping traders identify overbought and oversold conditions.
Can these indicators be used together?
Yes, combining TTM Slingshot and Value Charts Indicators provides a comprehensive analysis of market trends and security value.
Which platforms support these indicators?
Platforms like Thinkorswim, TradeStation, NinjaTrader, and MetaTrader support TTM Slingshot and Value Charts Indicators.
How do I install these indicators?
Download the respective indicator files, open your trading platform, and add the indicators through the ‘Indicators’ section.
Be the first to review “TTM Slingshot & Value Charts Indicators”
You must be logged in to post a review.
Related products
Forex Trading
Original price was: $125.00.$17.00Current price is: $17.00.

Forex Trading
Original price was: $1,098.00.$39.00Current price is: $39.00.
Forex Trading
Original price was: $2,995.00.$31.00Current price is: $31.00.
Forex Trading
Original price was: $999.00.$15.00Current price is: $15.00.
Forex Trading
Original price was: $249.00.$15.00Current price is: $15.00.
Original price was: $1,800.00.$54.00Current price is: $54.00.
Original price was: $450.00.$23.00Current price is: $23.00.
Forex Trading
Original price was: $550.00.$5.00Current price is: $5.00.
Original price was: $649.00.$20.00Current price is: $20.00.
Forex Trading
Original price was: $4,997.00.$27.00Current price is: $27.00.
Forex Trading
Original price was: $799.00.$15.00Current price is: $15.00.
Original price was: $997.00.$13.00Current price is: $13.00.

Original price was: $1,200.00.$23.00Current price is: $23.00.
Original price was: $895.00.$15.00Current price is: $15.00.
Forex Trading
Original price was: $850.00.$23.00Current price is: $23.00.
Original price was: $139.00.$23.00Current price is: $23.00.

Forex Trading
Original price was: $239.00.$8.00Current price is: $8.00.
Original price was: $497.00.$31.00Current price is: $31.00.
Original price was: $799.00.$15.00Current price is: $15.00.

Original price was: $497.00.$11.00Current price is: $11.00.

Reviews
There are no reviews yet.