-
×
 Wyckoff 2.0: Structures, Volume Profile and Order Flow (Trading and Investing Course: Advanced Technical Analysis) by Rubén Villahermosa
1 × $5.00
Wyckoff 2.0: Structures, Volume Profile and Order Flow (Trading and Investing Course: Advanced Technical Analysis) by Rubén Villahermosa
1 × $5.00 -
×
 FX Masterclass 2.0 with Uprise Academy
1 × $26.00
FX Masterclass 2.0 with Uprise Academy
1 × $26.00 -
×
 W. D Gann 's Square Of 9 Applied To Modern Markets with Sean Avidar - Hexatrade350
1 × $23.00
W. D Gann 's Square Of 9 Applied To Modern Markets with Sean Avidar - Hexatrade350
1 × $23.00 -
×
 B.O.S.S. SPY Sniper with Pat Mitchell – Trick Trades
1 × $39.00
B.O.S.S. SPY Sniper with Pat Mitchell – Trick Trades
1 × $39.00 -
×
 Crypto Trading Academy with Cheeky Investor - Aussie Day Trader
1 × $13.00
Crypto Trading Academy with Cheeky Investor - Aussie Day Trader
1 × $13.00 -
×
 Essentials in Quantitative Trading QT01 By HangukQuant's
1 × $23.00
Essentials in Quantitative Trading QT01 By HangukQuant's
1 × $23.00 -
×
 White Phoenix’s The Smart (Money) Approach to Trading with Jayson Casper
1 × $39.00
White Phoenix’s The Smart (Money) Approach to Trading with Jayson Casper
1 × $39.00 -
×
 AI For Traders with Trading Markets
1 × $31.00
AI For Traders with Trading Markets
1 × $31.00 -
×
 Jason Bond Dvds for Traders (all 4 programs)
1 × $6.00
Jason Bond Dvds for Traders (all 4 programs)
1 × $6.00 -
×
 Gold XAUUSD Trading Strategy - The Gold Box with The Trading Guide
1 × $5.00
Gold XAUUSD Trading Strategy - The Gold Box with The Trading Guide
1 × $5.00 -
×
 Out of the Pits with Caitlin Zaloom
1 × $6.00
Out of the Pits with Caitlin Zaloom
1 × $6.00 -
×
 Profit Freedom Blueprint with High Performance Trading
1 × $5.00
Profit Freedom Blueprint with High Performance Trading
1 × $5.00 -
×
 Deep Dive Butterfly Trading Strategy Class with SJG Trades
1 × $41.00
Deep Dive Butterfly Trading Strategy Class with SJG Trades
1 × $41.00 -
×
 One Week S&P Workshop II with Linda Raschke
1 × $5.00
One Week S&P Workshop II with Linda Raschke
1 × $5.00 -
×
 $20 – 52k 20 pips a day challange with Rafał Zuchowicz - TopMasterTrader
1 × $5.00
$20 – 52k 20 pips a day challange with Rafał Zuchowicz - TopMasterTrader
1 × $5.00 -
×
 Mastering Debit Spreads with Vince Vora
1 × $15.00
Mastering Debit Spreads with Vince Vora
1 × $15.00 -
×
 Bear Trap Indicator with Markay Latimer
1 × $5.00
Bear Trap Indicator with Markay Latimer
1 × $5.00 -
×
 War Room Psychology Vol. 2 with Pat Mitchell – Trick Trades
1 × $23.00
War Room Psychology Vol. 2 with Pat Mitchell – Trick Trades
1 × $23.00 -
×
 TRADING NFX Course with Andrew NFX
1 × $5.00
TRADING NFX Course with Andrew NFX
1 × $5.00 -
×
 Sovereign Man Confidential
1 × $6.00
Sovereign Man Confidential
1 × $6.00 -
×
 Fibonacci – CCI Workshop Recording Series (2006 & 2008)
1 × $6.00
Fibonacci – CCI Workshop Recording Series (2006 & 2008)
1 × $6.00 -
×
 Home Run Options Trading Course with Dave Aquino - Base Camp Trading
1 × $11.00
Home Run Options Trading Course with Dave Aquino - Base Camp Trading
1 × $11.00 -
×
 How Charts Can Help You in the Stock Market with William Jiller
1 × $6.00
How Charts Can Help You in the Stock Market with William Jiller
1 × $6.00 -
×
 ICT Prodigy Trading Course – $650K in Payouts with Alex Solignani
1 × $15.00
ICT Prodigy Trading Course – $650K in Payouts with Alex Solignani
1 × $15.00 -
×
 Opening Range Success Formula with Geoff Bysshe
1 × $4.00
Opening Range Success Formula with Geoff Bysshe
1 × $4.00 -
×
 The Best Option Trading Course with David Jaffee - Best Stock Strategy
1 × $15.00
The Best Option Trading Course with David Jaffee - Best Stock Strategy
1 × $15.00 -
×
 Bond Market Course with The Macro Compass
1 × $15.00
Bond Market Course with The Macro Compass
1 × $15.00 -
×
 FX Simplified
1 × $5.00
FX Simplified
1 × $5.00 -
×
 The Tickmaster Indicator
1 × $54.00
The Tickmaster Indicator
1 × $54.00 -
×
 Slump Busting Techniques with Linda Raschke
1 × $4.00
Slump Busting Techniques with Linda Raschke
1 × $4.00 -
×
 Investments (6th Ed.)
1 × $6.00
Investments (6th Ed.)
1 × $6.00 -
×
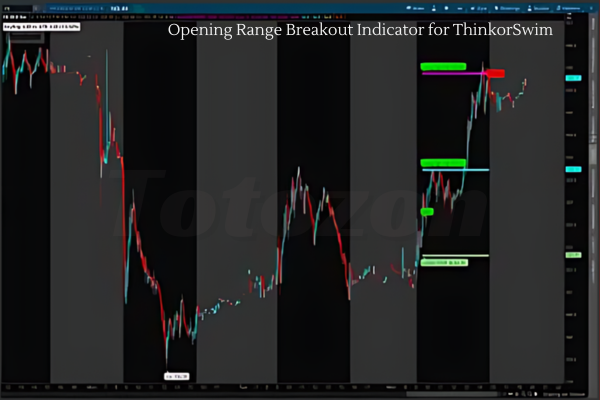 Opening Range Breakout Indicator for ThinkorSwim
1 × $6.00
Opening Range Breakout Indicator for ThinkorSwim
1 × $6.00 -
×
 Module I - Foundation with FX MindShift
1 × $6.00
Module I - Foundation with FX MindShift
1 × $6.00 -
×
 A Seminar On Ocean Theory Home Study Trading Course with Pat Raffalovich
1 × $6.00
A Seminar On Ocean Theory Home Study Trading Course with Pat Raffalovich
1 × $6.00 -
×
 Quantitative Finance & Algorithmic Trading II - Time Series with Holczer Balazs
1 × $4.00
Quantitative Finance & Algorithmic Trading II - Time Series with Holczer Balazs
1 × $4.00 -
×
 Momentum Explained. Vol.1
1 × $6.00
Momentum Explained. Vol.1
1 × $6.00 -
×
 A Plan to make $3k Monthly on $25k with Short Term Trades with Dan Sheridan
1 × $23.00
A Plan to make $3k Monthly on $25k with Short Term Trades with Dan Sheridan
1 × $23.00 -
×
 Mastering High Probability Chart Reading Methods with John Murphy
1 × $6.00
Mastering High Probability Chart Reading Methods with John Murphy
1 × $6.00 -
×
 Options Trading for the Conservative Trader with Michael Thomsett
1 × $6.00
Options Trading for the Conservative Trader with Michael Thomsett
1 × $6.00 -
×
 Letal Forex System with Alex Seeni
1 × $6.00
Letal Forex System with Alex Seeni
1 × $6.00 -
×
 Perfecting Execution and Trade Management Online Masterclass with The Trading Framework
1 × $6.00
Perfecting Execution and Trade Management Online Masterclass with The Trading Framework
1 × $6.00 -
×
 MorningSwing Method with Austin Passamonte
1 × $6.00
MorningSwing Method with Austin Passamonte
1 × $6.00 -
×
 TRADINGWITHRAYNER - PRICE ACTION TRADING INSTITUTE
1 × $23.00
TRADINGWITHRAYNER - PRICE ACTION TRADING INSTITUTE
1 × $23.00 -
×
 How to Trade a Vertical Market
1 × $93.00
How to Trade a Vertical Market
1 × $93.00 -
×
 Chicago Trading Workshop 2017 with Marketdelta
1 × $23.00
Chicago Trading Workshop 2017 with Marketdelta
1 × $23.00 -
×
 Spread Trading
1 × $6.00
Spread Trading
1 × $6.00 -
×
 Mastering The ICO: Spotting Needles In A Haystack with Alphashark
1 × $39.00
Mastering The ICO: Spotting Needles In A Haystack with Alphashark
1 × $39.00 -
×
 Gann’s Scientific Methods Unveiled (Vol I, II)
1 × $6.00
Gann’s Scientific Methods Unveiled (Vol I, II)
1 × $6.00 -
×
 Advanced Spread Trading with Guy Bower - MasterClass Trader
1 × $15.00
Advanced Spread Trading with Guy Bower - MasterClass Trader
1 × $15.00 -
×
 The Indices Orderflow Masterclass with The Forex Scalpers
1 × $23.00
The Indices Orderflow Masterclass with The Forex Scalpers
1 × $23.00 -
×
 The Instagram DM Automation Playbook with Natasha Takahashi
1 × $6.00
The Instagram DM Automation Playbook with Natasha Takahashi
1 × $6.00 -
×
 Foundations of Stock & Options. Home Study Course
1 × $6.00
Foundations of Stock & Options. Home Study Course
1 × $6.00 -
×
 Introduction to Position Sizing Strategies with Van Tharp Institute
1 × $6.00
Introduction to Position Sizing Strategies with Van Tharp Institute
1 × $6.00 -
×
 Using Options to Buy Stocks: Build Wealth with Little Risk and No Capital - Dennis Eisen
1 × $4.00
Using Options to Buy Stocks: Build Wealth with Little Risk and No Capital - Dennis Eisen
1 × $4.00 -
×
 Active Investing courses notes with Alan Hull
1 × $6.00
Active Investing courses notes with Alan Hull
1 × $6.00 -
×
 Quantamentals - The Next Great Forefront Of Trading and Investing with Trading Markets
1 × $8.00
Quantamentals - The Next Great Forefront Of Trading and Investing with Trading Markets
1 × $8.00 -
×
 TCG Educational Course Bundle Entries & Exits + Trading
1 × $23.00
TCG Educational Course Bundle Entries & Exits + Trading
1 × $23.00 -
×
 Ichimoku Cloud Triple Confirmation Indicator and Scan with AlphaShark
1 × $31.00
Ichimoku Cloud Triple Confirmation Indicator and Scan with AlphaShark
1 × $31.00 -
×
 Pivot Day Trader for NinjaTrader
1 × $31.00
Pivot Day Trader for NinjaTrader
1 × $31.00 -
×
 Trading to Win with Ari Kiev
1 × $6.00
Trading to Win with Ari Kiev
1 × $6.00 -
×
 How to Make Money in Deflationary Markets with Gary Shilling
1 × $6.00
How to Make Money in Deflationary Markets with Gary Shilling
1 × $6.00 -
×
 The Trading Blueprint with Brad Goh - The Trading Geek
1 × $5.00
The Trading Blueprint with Brad Goh - The Trading Geek
1 × $5.00 -
×
 Algo Trading Masterclass with Ali Casey - StatOasis
1 × $23.00
Algo Trading Masterclass with Ali Casey - StatOasis
1 × $23.00

TTM Slingshot & Value Charts Indicators
$6.00
File Size: Coming soon!
Delivery Time: 1–12 hours
Media Type: Online Course
TTM Slingshot & Value Charts Indicators
Introduction to TTM Slingshot & Value Charts
In the dynamic world of trading, having the right tools can make all the difference. Two such powerful tools are the TTM Slingshot and Value Charts Indicators. These indicators provide traders with crucial insights, helping them navigate market complexities and make informed decisions.
Understanding TTM Slingshot
What is TTM Slingshot?
The TTM Slingshot is an advanced trading indicator developed by John Carter. It combines multiple moving averages to identify potential breakout points in the market. By analyzing the relationship between these moving averages, the TTM Slingshot helps traders spot opportunities for entering or exiting trades.
Key Features of TTM Slingshot
- Multiple Moving Averages: Uses short-term and long-term moving averages.
- Breakout Identification: Detects potential breakout points.
- Versatility: Applicable across various markets and timeframes.
Benefits of Using TTM Slingshot
Enhanced Market Analysis
The TTM Slingshot provides a detailed analysis of market trends, allowing traders to anticipate significant price movements. This indicator’s ability to pinpoint breakout points is invaluable for making timely trading decisions.
Improved Trading Accuracy
By combining multiple moving averages, the TTM Slingshot offers a comprehensive view of the market. This integration reduces noise and enhances the accuracy of predictions, leading to more successful trades.
Setting Up TTM Slingshot
Choosing the Right Platform
To utilize the TTM Slingshot, you’ll need a trading platform that supports custom indicators. Platforms like Thinkorswim and TradeStation are popular choices among traders.
Installing the Indicator
- Download the Indicator: Obtain the TTM Slingshot file compatible with your trading platform.
- Open Your Platform: Launch the trading platform.
- Add the Indicator: Navigate to the ‘Indicators’ section and add the TTM Slingshot file.
- Customize Settings: Adjust the settings to align with your trading strategy.
Understanding Value Charts Indicators
What are Value Charts Indicators?
Value Charts Indicators are tools that measure the relative value of a security based on its price history. These indicators help traders determine whether a security is overvalued, undervalued, or fairly valued, providing a clear picture of potential trading opportunities.
Key Features of Value Charts Indicators
- Relative Value Measurement: Assesses the value of a security.
- Overbought/Oversold Conditions: Identifies extreme market conditions.
- Visual Representation: Displays value levels on a chart for easy interpretation.
Benefits of Using Value Charts Indicators
Identifying Market Extremes
Value Charts Indicators are excellent for spotting overbought and oversold conditions. By identifying these extremes, traders can make strategic decisions about entering or exiting positions.
Enhancing Risk Management
These indicators aid in risk management by providing insights into the relative value of a security. Traders can use this information to set stop-loss levels and protect their investments.
Setting Up Value Charts Indicators
Selecting the Appropriate Platform
Choose a trading platform that supports Value Charts Indicators. Many modern trading platforms, such as NinjaTrader and MetaTrader, offer these indicators.
Installing the Indicator
- Download the Indicator: Obtain the Value Charts Indicator file for your platform.
- Open Your Platform: Start the trading platform.
- Add the Indicator: Go to the ‘Indicators’ section and add the Value Charts file.
- Configure Settings: Customize the settings to fit your trading approach.
How to Use TTM Slingshot & Value Charts Together
Combining Indicators for Better Insights
Using TTM Slingshot and Value Charts Indicators together can enhance your market analysis. While TTM Slingshot identifies breakout points, Value Charts Indicators help assess the relative value of the security, providing a more comprehensive view.
Practical Application
- Entry Points: Use TTM Slingshot to identify breakout points and confirm with Value Charts Indicators to ensure the security is not overvalued.
- Exit Points: Value Charts Indicators can signal overbought conditions, indicating a good time to exit, while TTM Slingshot confirms the end of a trend.
Advanced Strategies with TTM Slingshot & Value Charts
Pairing with Other Indicators
For even more robust analysis, pair TTM Slingshot and Value Charts Indicators with other tools such as RSI (Relative Strength Index) and MACD (Moving Average Convergence Divergence).
Developing a Trading Plan
Create a detailed trading plan that incorporates these indicators. Define your entry and exit points, risk management strategies, and the specific market conditions you’re targeting.
Real-Life Examples
Successful Trade Case Study
Consider a scenario where the TTM Slingshot indicates a breakout, and Value Charts Indicators show the security is undervalued. Entering a trade at this point could lead to significant profits as the price moves to its fair value.
Learning from Mistakes
Analyze trades where the indicators did not predict the expected outcome. Understanding these failures can help refine your strategy and improve future performance.
Conclusion
Maximizing Your Trading Success
The TTM Slingshot and Value Charts Indicators are powerful tools that, when used together, can significantly enhance your trading strategy. By providing insights into market trends and relative value, these indicators help you make more informed decisions.
Taking the Next Step
Start by setting up these indicators on your trading platform. Practice interpreting the signals and integrating them into your trading strategy to see the benefits firsthand.

FAQs
What is the TTM Slingshot indicator?
The TTM Slingshot is a trading tool that uses multiple moving averages to identify breakout points in the market.
How do Value Charts Indicators work?
Value Charts Indicators measure the relative value of a security, helping traders identify overbought and oversold conditions.
Can these indicators be used together?
Yes, combining TTM Slingshot and Value Charts Indicators provides a comprehensive analysis of market trends and security value.
Which platforms support these indicators?
Platforms like Thinkorswim, TradeStation, NinjaTrader, and MetaTrader support TTM Slingshot and Value Charts Indicators.
How do I install these indicators?
Download the respective indicator files, open your trading platform, and add the indicators through the ‘Indicators’ section.
Be the first to review “TTM Slingshot & Value Charts Indicators”
You must be logged in to post a review.
Related products
Forex Trading
Original price was: $697.00.$5.00Current price is: $5.00.

Forex Trading
Original price was: $239.00.$8.00Current price is: $8.00.

Original price was: $649.00.$20.00Current price is: $20.00.
Forex Trading
Quantamentals – The Next Great Forefront Of Trading and Investing with Trading Markets
Original price was: $1,495.00.$8.00Current price is: $8.00.
Forex Trading
Original price was: $850.00.$23.00Current price is: $23.00.
Original price was: $2,120.00.$15.00Current price is: $15.00.
Original price was: $1,849.00.$15.00Current price is: $15.00.

Forex Trading
Original price was: $1,098.00.$39.00Current price is: $39.00.
Forex Trading
Original price was: $2,995.00.$31.00Current price is: $31.00.

Forex Trading
Original price was: $799.00.$15.00Current price is: $15.00.

Original price was: $310.00.$23.00Current price is: $23.00.
Original price was: $895.00.$15.00Current price is: $15.00.

Forex Trading
The Complete Guide to Multiple Time Frame Analysis & Reading Price Action with Aiman Almansoori
Original price was: $1,399.00.$13.00Current price is: $13.00.
Original price was: $197.00.$5.00Current price is: $5.00.
Original price was: $700.00.$39.00Current price is: $39.00.

Forex Trading
Original price was: $999.00.$15.00Current price is: $15.00.

Original price was: $799.00.$15.00Current price is: $15.00.

Original price was: $4,995.00.$15.00Current price is: $15.00.

Original price was: $1,800.00.$54.00Current price is: $54.00.
Original price was: $450.00.$23.00Current price is: $23.00.

Reviews
There are no reviews yet.