-
×
 Zap Seminar - David Stendahl – Day Trading the E-Minis
1 × $6.00
Zap Seminar - David Stendahl – Day Trading the E-Minis
1 × $6.00 -
×
 The A14 Weekly Option Strategy Workshop with Amy Meissner
1 × $23.00
The A14 Weekly Option Strategy Workshop with Amy Meissner
1 × $23.00 -
×
 Advanced Trading System - How To 10x Your Trading Skillsets & Results with The Trade Academy
1 × $6.00
Advanced Trading System - How To 10x Your Trading Skillsets & Results with The Trade Academy
1 × $6.00 -
×
 Transforms and Applications Handbook (2nd Edition) with Alexander Poularikas
1 × $6.00
Transforms and Applications Handbook (2nd Edition) with Alexander Poularikas
1 × $6.00 -
×
 Home Run Options Trading Course with Dave Aquino - Base Camp Trading
1 × $11.00
Home Run Options Trading Course with Dave Aquino - Base Camp Trading
1 × $11.00 -
×
 WYCKOFF TRADING COURSE (WTC) PART I – ANALYSIS (Fall 2021) with Roman Bogomazov
1 × $209.00
WYCKOFF TRADING COURSE (WTC) PART I – ANALYSIS (Fall 2021) with Roman Bogomazov
1 × $209.00 -
×
 The Best Option Trading Course with David Jaffee - Best Stock Strategy
1 × $15.00
The Best Option Trading Course with David Jaffee - Best Stock Strategy
1 × $15.00 -
×
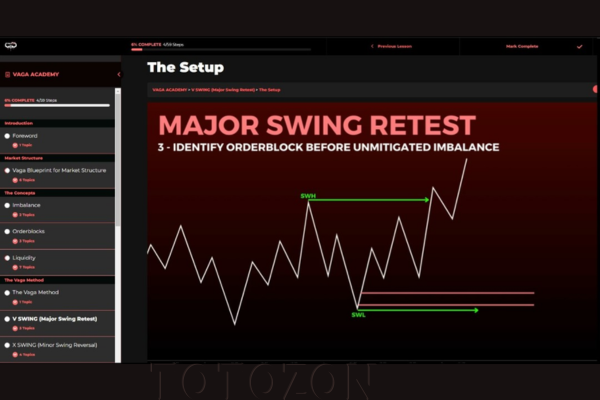 Vaga Academy with VAGAFX
1 × $5.00
Vaga Academy with VAGAFX
1 × $5.00 -
×
 Behavioral Trading with Woody Dorsey
1 × $6.00
Behavioral Trading with Woody Dorsey
1 × $6.00 -
×
 ZipTraderU 2023 with ZipTrader
1 × $5.00
ZipTraderU 2023 with ZipTrader
1 × $5.00 -
×
 Alexander Elder Full Courses Package
1 × $6.00
Alexander Elder Full Courses Package
1 × $6.00 -
×
 Matrix Spread Options Trading Course with Base Camp Trading
1 × $31.00
Matrix Spread Options Trading Course with Base Camp Trading
1 × $31.00 -
×
 The Prop Trading Code with Brannigan Barrett - Axia Futures
1 × $23.00
The Prop Trading Code with Brannigan Barrett - Axia Futures
1 × $23.00 -
×
 Weekly Options Trading Advantage Class with Doc Severson
1 × $6.00
Weekly Options Trading Advantage Class with Doc Severson
1 × $6.00 -
×
 How To Read The Market Professionally with TradeSmart
1 × $27.00
How To Read The Market Professionally with TradeSmart
1 × $27.00 -
×
 90 Days To Trade MasterClass with Jerremy Newsome & Matt Delong - Real Life Trading
1 × $104.00
90 Days To Trade MasterClass with Jerremy Newsome & Matt Delong - Real Life Trading
1 × $104.00 -
×
 What Ranks Schema Course with Clint Butler
1 × $23.00
What Ranks Schema Course with Clint Butler
1 × $23.00 -
×
 ALGO™ Online Retail - Version 2.9
1 × $155.00
ALGO™ Online Retail - Version 2.9
1 × $155.00 -
×
 Trading Options as a Professional: Techniques for Market Makers and Experienced Traders with James Bittman
1 × $6.00
Trading Options as a Professional: Techniques for Market Makers and Experienced Traders with James Bittman
1 × $6.00 -
×
 MACD Divergence Fully Automatic Indicator for ThinkOrSwim TOS
1 × $6.00
MACD Divergence Fully Automatic Indicator for ThinkOrSwim TOS
1 × $6.00 -
×
 ICT Prodigy Trading Course – $650K in Payouts with Alex Solignani
1 × $15.00
ICT Prodigy Trading Course – $650K in Payouts with Alex Solignani
1 × $15.00 -
×
 Forecast 2024 Clarification with Larry Williams
1 × $15.00
Forecast 2024 Clarification with Larry Williams
1 × $15.00 -
×
 ValueCharts Ultimate Bundle with Base Camp Trading
1 × $54.00
ValueCharts Ultimate Bundle with Base Camp Trading
1 × $54.00 -
×
 Crystal Ball Pack PLUS bonus Live Trade By Pat Mitchell - Trick Trades
1 × $20.00
Crystal Ball Pack PLUS bonus Live Trade By Pat Mitchell - Trick Trades
1 × $20.00 -
×
 Ultimate Trading Course with Dodgy's Dungeon
1 × $8.00
Ultimate Trading Course with Dodgy's Dungeon
1 × $8.00 -
×
 5 Week Live Web Seminar (Video & WorkBook ) with Larry Connors
1 × $6.00
5 Week Live Web Seminar (Video & WorkBook ) with Larry Connors
1 × $6.00 -
×
 AI For Traders with Trading Markets
1 × $31.00
AI For Traders with Trading Markets
1 × $31.00 -
×
 All About Technical Analysis with Constance Brown
1 × $6.00
All About Technical Analysis with Constance Brown
1 × $6.00 -
×
 SQX Mentorship with Tip Toe Hippo
1 × $23.00
SQX Mentorship with Tip Toe Hippo
1 × $23.00 -
×
 Crash Course Special Edition Set with Chris Martenson
1 × $6.00
Crash Course Special Edition Set with Chris Martenson
1 × $6.00 -
×
 Volatility Trading with Euan Sinclair
1 × $6.00
Volatility Trading with Euan Sinclair
1 × $6.00 -
×
 The Value Connection with Marc Gerstein
1 × $5.00
The Value Connection with Marc Gerstein
1 × $5.00 -
×
 $20 – 52k 20 pips a day challange with Rafał Zuchowicz - TopMasterTrader
1 × $5.00
$20 – 52k 20 pips a day challange with Rafał Zuchowicz - TopMasterTrader
1 × $5.00 -
×
 High Probability Trading Using Elliott Wave And Fibonacci Analysis withVic Patel - Forex Training Group
1 × $10.00
High Probability Trading Using Elliott Wave And Fibonacci Analysis withVic Patel - Forex Training Group
1 × $10.00 -
×
 After Hour Trading Made Easy with Joe Duarte & Roland Burke
1 × $6.00
After Hour Trading Made Easy with Joe Duarte & Roland Burke
1 × $6.00 -
×
 Winning with Options with Michael Thomsett
1 × $6.00
Winning with Options with Michael Thomsett
1 × $6.00 -
×
 Trading Short TermSame Day Trades Sep 2023 with Dan Sheridan & Mark Fenton - Sheridan Options Mentoring
1 × $31.00
Trading Short TermSame Day Trades Sep 2023 with Dan Sheridan & Mark Fenton - Sheridan Options Mentoring
1 × $31.00 -
×
 A Comparison of Twelve Technical Trading Systems with Louis Lukac
1 × $6.00
A Comparison of Twelve Technical Trading Systems with Louis Lukac
1 × $6.00 -
×
 Advanced Stock Trading Course + Strategies
1 × $15.00
Advanced Stock Trading Course + Strategies
1 × $15.00 -
×
 Chris Swaggy C Williams - The Swag Academy
1 × $6.00
Chris Swaggy C Williams - The Swag Academy
1 × $6.00 -
×
 Butterfly and Condor Workshop with Aeromir
1 × $15.00
Butterfly and Condor Workshop with Aeromir
1 × $15.00 -
×
 Scalp Strategy and Flipping Small Accounts with Opes Trading Group
1 × $5.00
Scalp Strategy and Flipping Small Accounts with Opes Trading Group
1 × $5.00 -
×
 Advanced Symmetrics Mental Harmonics Course
1 × $15.00
Advanced Symmetrics Mental Harmonics Course
1 × $15.00 -
×
 60 Minute Trader with Chris Kobewka
1 × $6.00
60 Minute Trader with Chris Kobewka
1 × $6.00 -
×
 0 DTE Options Trading Workshop with Aeromir Corporation
1 × $15.00
0 DTE Options Trading Workshop with Aeromir Corporation
1 × $15.00 -
×
 Advent Forex Course with Cecil Robles
1 × $6.00
Advent Forex Course with Cecil Robles
1 × $6.00 -
×
 YTC Price Action Trader
1 × $6.00
YTC Price Action Trader
1 × $6.00 -
×
 Advanced Price Action Course with ZenFX
1 × $5.00
Advanced Price Action Course with ZenFX
1 × $5.00 -
×
 Advanced Daytrading Seminar with Ken Calhoun
1 × $155.00
Advanced Daytrading Seminar with Ken Calhoun
1 × $155.00 -
×
 The Way to Trade with John Piper
1 × $6.00
The Way to Trade with John Piper
1 × $6.00 -
×
 You can be a Stock Market Genious with Joel Greenblaat
1 × $6.00
You can be a Stock Market Genious with Joel Greenblaat
1 × $6.00 -
×
 Crypto Trading Academy with Cheeky Investor - Aussie Day Trader
1 × $13.00
Crypto Trading Academy with Cheeky Investor - Aussie Day Trader
1 × $13.00 -
×
 CFA Level 2 - Sample Item Sets 2003
1 × $6.00
CFA Level 2 - Sample Item Sets 2003
1 × $6.00 -
×
 Trading Hub 3.0 (Ebook)
1 × $6.00
Trading Hub 3.0 (Ebook)
1 × $6.00 -
×
 Compass Trading System with Right Line Trading
1 × $39.00
Compass Trading System with Right Line Trading
1 × $39.00 -
×
 Bond Market Course with The Macro Compass
1 × $15.00
Bond Market Course with The Macro Compass
1 × $15.00 -
×
 Unsorted Articles about the Psychology of Trading with Brett N.Steenbarger
1 × $6.00
Unsorted Articles about the Psychology of Trading with Brett N.Steenbarger
1 × $6.00 -
×
 The Triple Bottom Line
1 × $6.00
The Triple Bottom Line
1 × $6.00 -
×
 Deep Dive Butterfly Trading Strategy Class with SJG Trades
1 × $41.00
Deep Dive Butterfly Trading Strategy Class with SJG Trades
1 × $41.00 -
×
 The Indices Orderflow Masterclass with The Forex Scalpers
1 × $23.00
The Indices Orderflow Masterclass with The Forex Scalpers
1 × $23.00 -
×
 BETT Strategy (Breakout Entry Two Target Strategy)
1 × $62.00
BETT Strategy (Breakout Entry Two Target Strategy)
1 × $62.00 -
×
 Advanced Trading Techniques 2 CDs with Sammy Chua
1 × $6.00
Advanced Trading Techniques 2 CDs with Sammy Chua
1 × $6.00 -
×
 The Trading Blueprint with Brad Goh - The Trading Geek
1 × $5.00
The Trading Blueprint with Brad Goh - The Trading Geek
1 × $5.00 -
×
 The Naked Eye: Raw Data Analytics with Edgar Torres - Raw Data Analytics
1 × $8.00
The Naked Eye: Raw Data Analytics with Edgar Torres - Raw Data Analytics
1 × $8.00 -
×
 Trading Option Greeks with Dan Passarelli
1 × $6.00
Trading Option Greeks with Dan Passarelli
1 × $6.00 -
×
 Yield Farming MasterClass Course (2022) with Boss Financial
1 × $5.00
Yield Farming MasterClass Course (2022) with Boss Financial
1 × $5.00 -
×
 The Orderflows Trade Opportunities Encyclopedia with Michael Valtos
1 × $8.00
The Orderflows Trade Opportunities Encyclopedia with Michael Valtos
1 × $8.00 -
×
 Wyckoff Stock Market Institute
1 × $5.00
Wyckoff Stock Market Institute
1 × $5.00 -
×
 Quantamentals - The Next Great Forefront Of Trading and Investing with Trading Markets
1 × $8.00
Quantamentals - The Next Great Forefront Of Trading and Investing with Trading Markets
1 × $8.00 -
×
 Advanced Get 12.0.3485 x86 (August 2014) (+ open code efs, dll's) for Any eSignal Account
1 × $23.00
Advanced Get 12.0.3485 x86 (August 2014) (+ open code efs, dll's) for Any eSignal Account
1 × $23.00 -
×
 Zulu Trading Method for the Soybeans with Joe Ross
1 × $6.00
Zulu Trading Method for the Soybeans with Joe Ross
1 × $6.00 -
×
 Power Cycle Trading The Ultimate Option Guide: When & How to Use Which Option Strategy For the Best Results - Powercycletrading
1 × $69.00
Power Cycle Trading The Ultimate Option Guide: When & How to Use Which Option Strategy For the Best Results - Powercycletrading
1 × $69.00 -
×
 Beat the Market with Edward O.Thorp
1 × $6.00
Beat the Market with Edward O.Thorp
1 × $6.00 -
×
 TradeCraft: Your Path to Peak Performance Trading By Adam Grimes
1 × $15.00
TradeCraft: Your Path to Peak Performance Trading By Adam Grimes
1 × $15.00 -
×
 DAY TRADE (LONG & SHORT) STRATEGIES PACKAGE - The Chartist
1 × $272.00
DAY TRADE (LONG & SHORT) STRATEGIES PACKAGE - The Chartist
1 × $272.00 -
×
 War Room Technicals Volume 2 with Pat Mitchell – Trick Trades
1 × $6.00
War Room Technicals Volume 2 with Pat Mitchell – Trick Trades
1 × $6.00 -
×
 Tradematic Trading Strategy
1 × $31.00
Tradematic Trading Strategy
1 × $31.00 -
×
 Ambush Trading Method (EBOOK) with MARCO MAYER - Trading Educators
1 × $256.00
Ambush Trading Method (EBOOK) with MARCO MAYER - Trading Educators
1 × $256.00 -
×
 Essentials in Quantitative Trading QT01 By HangukQuant's
1 × $23.00
Essentials in Quantitative Trading QT01 By HangukQuant's
1 × $23.00 -
×
 VintagEducation - The Fast Track Forex Bootcamp
1 × $6.00
VintagEducation - The Fast Track Forex Bootcamp
1 × $6.00 -
×
 White Phoenix’s The Smart (Money) Approach to Trading with Jayson Casper
1 × $39.00
White Phoenix’s The Smart (Money) Approach to Trading with Jayson Casper
1 × $39.00 -
×
 7 Day FX Mastery Course with Market Masters
1 × $6.00
7 Day FX Mastery Course with Market Masters
1 × $6.00 -
×
 Understanding Wall Street (4th Ed.) with Jeffrey Little
1 × $6.00
Understanding Wall Street (4th Ed.) with Jeffrey Little
1 × $6.00 -
×
 Advanced Technical Analysis PART2 with Corey Halliday
1 × $6.00
Advanced Technical Analysis PART2 with Corey Halliday
1 × $6.00 -
×
 TRADING NFX Course with Andrew NFX
1 × $5.00
TRADING NFX Course with Andrew NFX
1 × $5.00 -
×
 Traders World Past Issue Articles on CD with Magazine
1 × $6.00
Traders World Past Issue Articles on CD with Magazine
1 × $6.00 -
×
 CM APR (A Pivot Reverse) Trade Method with Austin Passamonte
1 × $6.00
CM APR (A Pivot Reverse) Trade Method with Austin Passamonte
1 × $6.00 -
×
 Adaptation in Sports Training (1995) with Atko Viru
1 × $23.00
Adaptation in Sports Training (1995) with Atko Viru
1 × $23.00 -
×
 Complete Trading System with Segma Singh
1 × $6.00
Complete Trading System with Segma Singh
1 × $6.00 -
×
 Art & Science of Trend Trading Class with Jeff Bierman
1 × $6.00
Art & Science of Trend Trading Class with Jeff Bierman
1 × $6.00 -
×
 What Works in Online Trading with Mark Etzkorn
1 × $6.00
What Works in Online Trading with Mark Etzkorn
1 × $6.00 -
×
 The Orderflow Masterclass with PrimeTrading
1 × $17.00
The Orderflow Masterclass with PrimeTrading
1 × $17.00 -
×
 A Trader’s Guide To Discipline
1 × $6.00
A Trader’s Guide To Discipline
1 × $6.00 -
×
 WondaFX Signature Strategy with WondaFX
1 × $5.00
WondaFX Signature Strategy with WondaFX
1 × $5.00 -
×
 Active Beta Indexes with Khalid Ghayur
1 × $6.00
Active Beta Indexes with Khalid Ghayur
1 × $6.00 -
×
 BOSSPack Course with Pat Mitchell – Trick Trades
1 × $69.00
BOSSPack Course with Pat Mitchell – Trick Trades
1 × $69.00 -
×
 USDX Trading Course with Jared Martinez - MTI
1 × $6.00
USDX Trading Course with Jared Martinez - MTI
1 × $6.00 -
×
 Algo Trading Masterclass with Ali Casey - StatOasis
1 × $23.00
Algo Trading Masterclass with Ali Casey - StatOasis
1 × $23.00

TTM Slingshot & Value Charts Indicators
$6.00
File Size: Coming soon!
Delivery Time: 1–12 hours
Media Type: Online Course
TTM Slingshot & Value Charts Indicators
Introduction to TTM Slingshot & Value Charts
In the dynamic world of trading, having the right tools can make all the difference. Two such powerful tools are the TTM Slingshot and Value Charts Indicators. These indicators provide traders with crucial insights, helping them navigate market complexities and make informed decisions.
Understanding TTM Slingshot
What is TTM Slingshot?
The TTM Slingshot is an advanced trading indicator developed by John Carter. It combines multiple moving averages to identify potential breakout points in the market. By analyzing the relationship between these moving averages, the TTM Slingshot helps traders spot opportunities for entering or exiting trades.
Key Features of TTM Slingshot
- Multiple Moving Averages: Uses short-term and long-term moving averages.
- Breakout Identification: Detects potential breakout points.
- Versatility: Applicable across various markets and timeframes.
Benefits of Using TTM Slingshot
Enhanced Market Analysis
The TTM Slingshot provides a detailed analysis of market trends, allowing traders to anticipate significant price movements. This indicator’s ability to pinpoint breakout points is invaluable for making timely trading decisions.
Improved Trading Accuracy
By combining multiple moving averages, the TTM Slingshot offers a comprehensive view of the market. This integration reduces noise and enhances the accuracy of predictions, leading to more successful trades.
Setting Up TTM Slingshot
Choosing the Right Platform
To utilize the TTM Slingshot, you’ll need a trading platform that supports custom indicators. Platforms like Thinkorswim and TradeStation are popular choices among traders.
Installing the Indicator
- Download the Indicator: Obtain the TTM Slingshot file compatible with your trading platform.
- Open Your Platform: Launch the trading platform.
- Add the Indicator: Navigate to the ‘Indicators’ section and add the TTM Slingshot file.
- Customize Settings: Adjust the settings to align with your trading strategy.
Understanding Value Charts Indicators
What are Value Charts Indicators?
Value Charts Indicators are tools that measure the relative value of a security based on its price history. These indicators help traders determine whether a security is overvalued, undervalued, or fairly valued, providing a clear picture of potential trading opportunities.
Key Features of Value Charts Indicators
- Relative Value Measurement: Assesses the value of a security.
- Overbought/Oversold Conditions: Identifies extreme market conditions.
- Visual Representation: Displays value levels on a chart for easy interpretation.
Benefits of Using Value Charts Indicators
Identifying Market Extremes
Value Charts Indicators are excellent for spotting overbought and oversold conditions. By identifying these extremes, traders can make strategic decisions about entering or exiting positions.
Enhancing Risk Management
These indicators aid in risk management by providing insights into the relative value of a security. Traders can use this information to set stop-loss levels and protect their investments.
Setting Up Value Charts Indicators
Selecting the Appropriate Platform
Choose a trading platform that supports Value Charts Indicators. Many modern trading platforms, such as NinjaTrader and MetaTrader, offer these indicators.
Installing the Indicator
- Download the Indicator: Obtain the Value Charts Indicator file for your platform.
- Open Your Platform: Start the trading platform.
- Add the Indicator: Go to the ‘Indicators’ section and add the Value Charts file.
- Configure Settings: Customize the settings to fit your trading approach.
How to Use TTM Slingshot & Value Charts Together
Combining Indicators for Better Insights
Using TTM Slingshot and Value Charts Indicators together can enhance your market analysis. While TTM Slingshot identifies breakout points, Value Charts Indicators help assess the relative value of the security, providing a more comprehensive view.
Practical Application
- Entry Points: Use TTM Slingshot to identify breakout points and confirm with Value Charts Indicators to ensure the security is not overvalued.
- Exit Points: Value Charts Indicators can signal overbought conditions, indicating a good time to exit, while TTM Slingshot confirms the end of a trend.
Advanced Strategies with TTM Slingshot & Value Charts
Pairing with Other Indicators
For even more robust analysis, pair TTM Slingshot and Value Charts Indicators with other tools such as RSI (Relative Strength Index) and MACD (Moving Average Convergence Divergence).
Developing a Trading Plan
Create a detailed trading plan that incorporates these indicators. Define your entry and exit points, risk management strategies, and the specific market conditions you’re targeting.
Real-Life Examples
Successful Trade Case Study
Consider a scenario where the TTM Slingshot indicates a breakout, and Value Charts Indicators show the security is undervalued. Entering a trade at this point could lead to significant profits as the price moves to its fair value.
Learning from Mistakes
Analyze trades where the indicators did not predict the expected outcome. Understanding these failures can help refine your strategy and improve future performance.
Conclusion
Maximizing Your Trading Success
The TTM Slingshot and Value Charts Indicators are powerful tools that, when used together, can significantly enhance your trading strategy. By providing insights into market trends and relative value, these indicators help you make more informed decisions.
Taking the Next Step
Start by setting up these indicators on your trading platform. Practice interpreting the signals and integrating them into your trading strategy to see the benefits firsthand.

FAQs
What is the TTM Slingshot indicator?
The TTM Slingshot is a trading tool that uses multiple moving averages to identify breakout points in the market.
How do Value Charts Indicators work?
Value Charts Indicators measure the relative value of a security, helping traders identify overbought and oversold conditions.
Can these indicators be used together?
Yes, combining TTM Slingshot and Value Charts Indicators provides a comprehensive analysis of market trends and security value.
Which platforms support these indicators?
Platforms like Thinkorswim, TradeStation, NinjaTrader, and MetaTrader support TTM Slingshot and Value Charts Indicators.
How do I install these indicators?
Download the respective indicator files, open your trading platform, and add the indicators through the ‘Indicators’ section.
Be the first to review “TTM Slingshot & Value Charts Indicators”
You must be logged in to post a review.
Related products
Forex Trading
Original price was: $2,000.00.$23.00Current price is: $23.00.
Forex Trading
Original price was: $797.00.$10.00Current price is: $10.00.
Forex Trading
Original price was: $1,898.00.$10.00Current price is: $10.00.
Original price was: $450.00.$23.00Current price is: $23.00.
Forex Trading
Original price was: $1,098.00.$39.00Current price is: $39.00.
Original price was: $299.00.$8.00Current price is: $8.00.
Original price was: $700.00.$39.00Current price is: $39.00.
Forex Trading
Original price was: $2,997.00.$23.00Current price is: $23.00.
Forex Trading
Original price was: $697.00.$5.00Current price is: $5.00.
Forex Trading
Original price was: $249.00.$15.00Current price is: $15.00.
Original price was: $2,120.00.$15.00Current price is: $15.00.

Original price was: $895.00.$15.00Current price is: $15.00.
Original price was: $997.00.$8.00Current price is: $8.00.
Forex Trading
Original price was: $499.00.$15.00Current price is: $15.00.
Forex Trading
Original price was: $4,997.00.$27.00Current price is: $27.00.
Forex Trading
Original price was: $850.00.$23.00Current price is: $23.00.
Original price was: $695.00.$41.00Current price is: $41.00.
Original price was: $1,200.00.$23.00Current price is: $23.00.
Original price was: $1,849.00.$15.00Current price is: $15.00.
Forex Trading
Original price was: $2,995.00.$31.00Current price is: $31.00.

Reviews
There are no reviews yet.