-
×
 The Right Stock at the Right Time. Prospering in the Coming Good Years with Larry Williams
1 × $6.00
The Right Stock at the Right Time. Prospering in the Coming Good Years with Larry Williams
1 × $6.00 -
×
 How I Get Paid $1,000 Every Friday Trading Options with Jeff Tompkins
1 × $15.00
How I Get Paid $1,000 Every Friday Trading Options with Jeff Tompkins
1 × $15.00 -
×
 How I Quit my Job & Turned 6k into Half Million Trading Commodities with Bob Buran
1 × $4.00
How I Quit my Job & Turned 6k into Half Million Trading Commodities with Bob Buran
1 × $4.00 -
×
 A Forex System For Catching Pips All Day Long with Forex Pip Fishing
1 × $4.00
A Forex System For Catching Pips All Day Long with Forex Pip Fishing
1 × $4.00 -
×
 The Master Indicator with Elite Money Trader
1 × $5.00
The Master Indicator with Elite Money Trader
1 × $5.00 -
×
 The Complete Guide to Market Breadth Indicators: How to Analyze and Evaluate market Direction and Strength - Greg Morris
1 × $6.00
The Complete Guide to Market Breadth Indicators: How to Analyze and Evaluate market Direction and Strength - Greg Morris
1 × $6.00 -
×
 C'MON MAN SHEEEIIIITTT PACKAGE with King Khang
1 × $23.00
C'MON MAN SHEEEIIIITTT PACKAGE with King Khang
1 × $23.00 -
×
 How To Read The Market Professionally with TradeSmart
1 × $27.00
How To Read The Market Professionally with TradeSmart
1 × $27.00 -
×
 WITS Turbo Seminars with Brian James Sklenka
1 × $6.00
WITS Turbo Seminars with Brian James Sklenka
1 × $6.00 -
×
 Intra-day Trading Strategies. Proven Steps to Trading Profits
1 × $6.00
Intra-day Trading Strategies. Proven Steps to Trading Profits
1 × $6.00 -
×
 The New Contrarian Investing Strategies. The Next Generation. Psychology and the Stock with David Dreman
1 × $6.00
The New Contrarian Investing Strategies. The Next Generation. Psychology and the Stock with David Dreman
1 × $6.00 -
×
 Active Trader Program (Smarter Starter Pack + the Number One Trading Plan)
1 × $15.00
Active Trader Program (Smarter Starter Pack + the Number One Trading Plan)
1 × $15.00 -
×
 The Prop Trading Code with Brannigan Barrett - Axia Futures
1 × $23.00
The Prop Trading Code with Brannigan Barrett - Axia Futures
1 × $23.00 -
×
 The Q’s (2nd Ed.) with Darlene Nelson
1 × $6.00
The Q’s (2nd Ed.) with Darlene Nelson
1 × $6.00 -
×
 Avoiding Trading Mistakes with Mark D.Cook
1 × $6.00
Avoiding Trading Mistakes with Mark D.Cook
1 × $6.00 -
×
 Cracking The Forex Code with Kevin Adams
1 × $6.00
Cracking The Forex Code with Kevin Adams
1 × $6.00 -
×
 Japanese Trading Systems with Tradesmart University
1 × $9.00
Japanese Trading Systems with Tradesmart University
1 × $9.00 -
×
 Wyckoff 2.0: Structures, Volume Profile and Order Flow (Trading and Investing Course: Advanced Technical Analysis) by Rubén Villahermosa
1 × $5.00
Wyckoff 2.0: Structures, Volume Profile and Order Flow (Trading and Investing Course: Advanced Technical Analysis) by Rubén Villahermosa
1 × $5.00 -
×
 7 Days Options Masters Course with John Carter
1 × $54.00
7 Days Options Masters Course with John Carter
1 × $54.00 -
×
 The Chaos Course. Cash in on Chaos with Hans Hannula
1 × $6.00
The Chaos Course. Cash in on Chaos with Hans Hannula
1 × $6.00 -
×
 Vaga Academy with VAGAFX
1 × $5.00
Vaga Academy with VAGAFX
1 × $5.00 -
×
 Mission Million Money Management Course
1 × $31.00
Mission Million Money Management Course
1 × $31.00 -
×
 Consistent Small Account Growth Formula with Matt Williamson
1 × $6.00
Consistent Small Account Growth Formula with Matt Williamson
1 × $6.00 -
×
 3 Day Live Trading Webinar (Jan 2010)
1 × $6.00
3 Day Live Trading Webinar (Jan 2010)
1 × $6.00 -
×
 Computerized Trading. Maximizing Day Trading and Overnight Profits with Mark Jurik
1 × $6.00
Computerized Trading. Maximizing Day Trading and Overnight Profits with Mark Jurik
1 × $6.00 -
×
 Investing for the Long Term with Peter Bernstein
1 × $6.00
Investing for the Long Term with Peter Bernstein
1 × $6.00 -
×
 Blueprint to Extreme Reversals with Aiman Almansoori - Trading Terminal
1 × $8.00
Blueprint to Extreme Reversals with Aiman Almansoori - Trading Terminal
1 × $8.00 -
×
 6 Dynamic Trader Real Time and End Of Day
1 × $39.00
6 Dynamic Trader Real Time and End Of Day
1 × $39.00 -
×
 Annual Forecast Reports - Forecast 2023 with Larry Williams
1 × $8.00
Annual Forecast Reports - Forecast 2023 with Larry Williams
1 × $8.00 -
×
 Advanced Forex Mastery Course with Alpha Forex Global
1 × $5.00
Advanced Forex Mastery Course with Alpha Forex Global
1 × $5.00 -
×
 A Momentum Based Approach to Swing Trading with Dave Landry
1 × $6.00
A Momentum Based Approach to Swing Trading with Dave Landry
1 × $6.00 -
×
 Volatility and Timing with Jay Kaeppel – The Option Trader’s Guide to Probability
1 × $6.00
Volatility and Timing with Jay Kaeppel – The Option Trader’s Guide to Probability
1 × $6.00 -
×
 The 30-Day Cash Flow Blueprint with Andy Tanner
1 × $31.00
The 30-Day Cash Flow Blueprint with Andy Tanner
1 × $31.00 -
×
 Unlocking the Mysteries of Trend Analysis - Rick Bensignor
1 × $6.00
Unlocking the Mysteries of Trend Analysis - Rick Bensignor
1 × $6.00 -
×
 Wave Trading Masterclass: Elliott's Wave Theory/Fibonacci Principles with Wave Trader
1 × $116.00
Wave Trading Masterclass: Elliott's Wave Theory/Fibonacci Principles with Wave Trader
1 × $116.00 -
×
 Compass Trading System with Right Line Trading
1 × $39.00
Compass Trading System with Right Line Trading
1 × $39.00 -
×
 Andy’s EMini Bar – 40 Min System with Joe Ross
1 × $6.00
Andy’s EMini Bar – 40 Min System with Joe Ross
1 × $6.00 -
×
 Secrets of Investors on WallStreet (Audio) with Ken Fisher
1 × $6.00
Secrets of Investors on WallStreet (Audio) with Ken Fisher
1 × $6.00 -
×
 Advanced GET 8.0 EOD
1 × $6.00
Advanced GET 8.0 EOD
1 × $6.00 -
×
 The Complete Guide to Multiple Time Frame Analysis & Reading Price Action with Aiman Almansoori
1 × $13.00
The Complete Guide to Multiple Time Frame Analysis & Reading Price Action with Aiman Almansoori
1 × $13.00 -
×
 Trade Execution with Yuri Shramenko
1 × $6.00
Trade Execution with Yuri Shramenko
1 × $6.00 -
×
 Donald Delves – Stock Options and the New Rules of Corporate Accountability
1 × $6.00
Donald Delves – Stock Options and the New Rules of Corporate Accountability
1 × $6.00 -
×
 Weekly Options Boot Camp with Price Headley
1 × $15.00
Weekly Options Boot Camp with Price Headley
1 × $15.00 -
×
 Astro View Horse Racing Show
1 × $6.00
Astro View Horse Racing Show
1 × $6.00 -
×
 Buying and Selling Volatility with Kevin B.Connolly
1 × $6.00
Buying and Selling Volatility with Kevin B.Connolly
1 × $6.00 -
×
 Ultimate Trading Course with Dodgy's Dungeon
1 × $8.00
Ultimate Trading Course with Dodgy's Dungeon
1 × $8.00 -
×
 All About High-Frequency Trading with Michael Durbin
1 × $6.00
All About High-Frequency Trading with Michael Durbin
1 × $6.00 -
×
 W. D Gann 's Square Of 9 Applied To Modern Markets with Sean Avidar - Hexatrade350
1 × $23.00
W. D Gann 's Square Of 9 Applied To Modern Markets with Sean Avidar - Hexatrade350
1 × $23.00 -
×
 The Tickmaster Indicator
1 × $54.00
The Tickmaster Indicator
1 × $54.00 -
×
 A Bull in China with Jim Rogers
1 × $6.00
A Bull in China with Jim Rogers
1 × $6.00 -
×
 Scalp Strategy and Flipping Small Accounts with Opes Trading Group
1 × $5.00
Scalp Strategy and Flipping Small Accounts with Opes Trading Group
1 × $5.00 -
×
 Seasonality. Systems, Strategies & Signals
1 × $6.00
Seasonality. Systems, Strategies & Signals
1 × $6.00 -
×
 Basecamptrading - How to Become a More Consistent Trader
1 × $15.00
Basecamptrading - How to Become a More Consistent Trader
1 × $15.00 -
×
 Advanced Trading Strategies with Larry Connors
1 × $6.00
Advanced Trading Strategies with Larry Connors
1 × $6.00 -
×
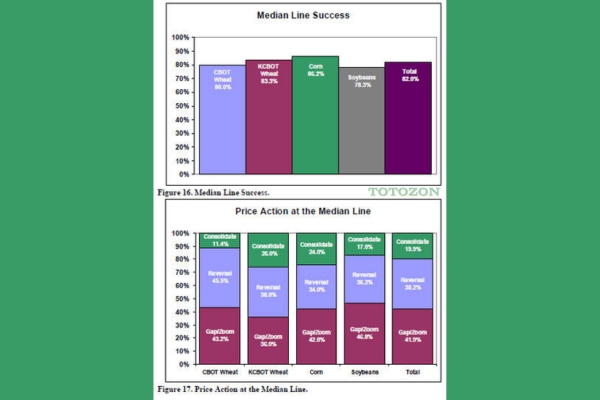 Using Median Lines as a Trading Tool with Greg Fisher
1 × $6.00
Using Median Lines as a Trading Tool with Greg Fisher
1 × $6.00 -
×
 The Great Depression with David Burg
1 × $6.00
The Great Depression with David Burg
1 × $6.00 -
×
 Ambush Trading Method (EBOOK) with MARCO MAYER - Trading Educators
1 × $256.00
Ambush Trading Method (EBOOK) with MARCO MAYER - Trading Educators
1 × $256.00 -
×
 Art & Science of Trend Trading Class with Jeff Bierman
1 × $6.00
Art & Science of Trend Trading Class with Jeff Bierman
1 × $6.00 -
×
 The New Investment Superstars: 13 Great Investors and Their Strategies for Superior Returns - Lois Peltz
1 × $6.00
The New Investment Superstars: 13 Great Investors and Their Strategies for Superior Returns - Lois Peltz
1 × $6.00 -
×
 Dynamic Time Cycles with Peter Eliades
1 × $6.00
Dynamic Time Cycles with Peter Eliades
1 × $6.00 -
×
 The Naked Eye: Raw Data Analytics with Edgar Torres - Raw Data Analytics
1 × $8.00
The Naked Eye: Raw Data Analytics with Edgar Torres - Raw Data Analytics
1 × $8.00 -
×
 Forex Avenger Trading System with David Curran
1 × $6.00
Forex Avenger Trading System with David Curran
1 × $6.00 -
×
 Algo Trading Masterclass with Ali Casey - StatOasis
1 × $23.00
Algo Trading Masterclass with Ali Casey - StatOasis
1 × $23.00

TTM Slingshot & Value Charts Indicators
$6.00
File Size: Coming soon!
Delivery Time: 1–12 hours
Media Type: Online Course
TTM Slingshot & Value Charts Indicators
Introduction to TTM Slingshot & Value Charts
In the dynamic world of trading, having the right tools can make all the difference. Two such powerful tools are the TTM Slingshot and Value Charts Indicators. These indicators provide traders with crucial insights, helping them navigate market complexities and make informed decisions.
Understanding TTM Slingshot
What is TTM Slingshot?
The TTM Slingshot is an advanced trading indicator developed by John Carter. It combines multiple moving averages to identify potential breakout points in the market. By analyzing the relationship between these moving averages, the TTM Slingshot helps traders spot opportunities for entering or exiting trades.
Key Features of TTM Slingshot
- Multiple Moving Averages: Uses short-term and long-term moving averages.
- Breakout Identification: Detects potential breakout points.
- Versatility: Applicable across various markets and timeframes.
Benefits of Using TTM Slingshot
Enhanced Market Analysis
The TTM Slingshot provides a detailed analysis of market trends, allowing traders to anticipate significant price movements. This indicator’s ability to pinpoint breakout points is invaluable for making timely trading decisions.
Improved Trading Accuracy
By combining multiple moving averages, the TTM Slingshot offers a comprehensive view of the market. This integration reduces noise and enhances the accuracy of predictions, leading to more successful trades.
Setting Up TTM Slingshot
Choosing the Right Platform
To utilize the TTM Slingshot, you’ll need a trading platform that supports custom indicators. Platforms like Thinkorswim and TradeStation are popular choices among traders.
Installing the Indicator
- Download the Indicator: Obtain the TTM Slingshot file compatible with your trading platform.
- Open Your Platform: Launch the trading platform.
- Add the Indicator: Navigate to the ‘Indicators’ section and add the TTM Slingshot file.
- Customize Settings: Adjust the settings to align with your trading strategy.
Understanding Value Charts Indicators
What are Value Charts Indicators?
Value Charts Indicators are tools that measure the relative value of a security based on its price history. These indicators help traders determine whether a security is overvalued, undervalued, or fairly valued, providing a clear picture of potential trading opportunities.
Key Features of Value Charts Indicators
- Relative Value Measurement: Assesses the value of a security.
- Overbought/Oversold Conditions: Identifies extreme market conditions.
- Visual Representation: Displays value levels on a chart for easy interpretation.
Benefits of Using Value Charts Indicators
Identifying Market Extremes
Value Charts Indicators are excellent for spotting overbought and oversold conditions. By identifying these extremes, traders can make strategic decisions about entering or exiting positions.
Enhancing Risk Management
These indicators aid in risk management by providing insights into the relative value of a security. Traders can use this information to set stop-loss levels and protect their investments.
Setting Up Value Charts Indicators
Selecting the Appropriate Platform
Choose a trading platform that supports Value Charts Indicators. Many modern trading platforms, such as NinjaTrader and MetaTrader, offer these indicators.
Installing the Indicator
- Download the Indicator: Obtain the Value Charts Indicator file for your platform.
- Open Your Platform: Start the trading platform.
- Add the Indicator: Go to the ‘Indicators’ section and add the Value Charts file.
- Configure Settings: Customize the settings to fit your trading approach.
How to Use TTM Slingshot & Value Charts Together
Combining Indicators for Better Insights
Using TTM Slingshot and Value Charts Indicators together can enhance your market analysis. While TTM Slingshot identifies breakout points, Value Charts Indicators help assess the relative value of the security, providing a more comprehensive view.
Practical Application
- Entry Points: Use TTM Slingshot to identify breakout points and confirm with Value Charts Indicators to ensure the security is not overvalued.
- Exit Points: Value Charts Indicators can signal overbought conditions, indicating a good time to exit, while TTM Slingshot confirms the end of a trend.
Advanced Strategies with TTM Slingshot & Value Charts
Pairing with Other Indicators
For even more robust analysis, pair TTM Slingshot and Value Charts Indicators with other tools such as RSI (Relative Strength Index) and MACD (Moving Average Convergence Divergence).
Developing a Trading Plan
Create a detailed trading plan that incorporates these indicators. Define your entry and exit points, risk management strategies, and the specific market conditions you’re targeting.
Real-Life Examples
Successful Trade Case Study
Consider a scenario where the TTM Slingshot indicates a breakout, and Value Charts Indicators show the security is undervalued. Entering a trade at this point could lead to significant profits as the price moves to its fair value.
Learning from Mistakes
Analyze trades where the indicators did not predict the expected outcome. Understanding these failures can help refine your strategy and improve future performance.
Conclusion
Maximizing Your Trading Success
The TTM Slingshot and Value Charts Indicators are powerful tools that, when used together, can significantly enhance your trading strategy. By providing insights into market trends and relative value, these indicators help you make more informed decisions.
Taking the Next Step
Start by setting up these indicators on your trading platform. Practice interpreting the signals and integrating them into your trading strategy to see the benefits firsthand.

FAQs
What is the TTM Slingshot indicator?
The TTM Slingshot is a trading tool that uses multiple moving averages to identify breakout points in the market.
How do Value Charts Indicators work?
Value Charts Indicators measure the relative value of a security, helping traders identify overbought and oversold conditions.
Can these indicators be used together?
Yes, combining TTM Slingshot and Value Charts Indicators provides a comprehensive analysis of market trends and security value.
Which platforms support these indicators?
Platforms like Thinkorswim, TradeStation, NinjaTrader, and MetaTrader support TTM Slingshot and Value Charts Indicators.
How do I install these indicators?
Download the respective indicator files, open your trading platform, and add the indicators through the ‘Indicators’ section.
Be the first to review “TTM Slingshot & Value Charts Indicators”
You must be logged in to post a review.
Related products

Original price was: $197.00.$5.00Current price is: $5.00.

Original price was: $1,800.00.$54.00Current price is: $54.00.

Original price was: $700.00.$39.00Current price is: $39.00.

Forex Trading
Original price was: $799.00.$15.00Current price is: $15.00.

Forex Trading
Original price was: $500.00.$5.00Current price is: $5.00.

Forex Trading
Original price was: $397.00.$31.00Current price is: $31.00.
Original price was: $139.00.$23.00Current price is: $23.00.

Forex Trading
Original price was: $2,995.00.$31.00Current price is: $31.00.
Forex Trading
The Complete Guide to Multiple Time Frame Analysis & Reading Price Action with Aiman Almansoori
Original price was: $1,399.00.$13.00Current price is: $13.00.

Original price was: $4,995.00.$15.00Current price is: $15.00.

Forex Trading
Original price was: $999.00.$15.00Current price is: $15.00.

Forex Trading
Original price was: $249.00.$15.00Current price is: $15.00.

Forex Trading
Original price was: $850.00.$23.00Current price is: $23.00.

Original price was: $497.00.$11.00Current price is: $11.00.

Original price was: $450.00.$23.00Current price is: $23.00.

Forex Trading
Original price was: $697.00.$5.00Current price is: $5.00.

Forex Trading
Original price was: $2,997.00.$23.00Current price is: $23.00.

Original price was: $695.00.$41.00Current price is: $41.00.
Original price was: $997.00.$8.00Current price is: $8.00.

Original price was: $649.00.$20.00Current price is: $20.00.

Reviews
There are no reviews yet.