-
×
 FX GOAT CURRENCIES COURSE 2.0
1 × $13.00
FX GOAT CURRENCIES COURSE 2.0
1 × $13.00 -
×
 Flux Investor Package v2.2.1, (Jan 2016) with Back To The Future Trading
1 × $85.00
Flux Investor Package v2.2.1, (Jan 2016) with Back To The Future Trading
1 × $85.00 -
×
 Trade for Life - 5 Day Trading Laboratory
1 × $54.00
Trade for Life - 5 Day Trading Laboratory
1 × $54.00 -
×
 Mastering Income Spread Trading with Dave Aquino - Base Camp Trading
1 × $23.00
Mastering Income Spread Trading with Dave Aquino - Base Camp Trading
1 × $23.00 -
×
 Learning KST
1 × $6.00
Learning KST
1 × $6.00 -
×
 Trend Commandments with Michael Covel
1 × $6.00
Trend Commandments with Michael Covel
1 × $6.00 -
×
 CM APR (A Pivot Reverse) Trade Method with Austin Passamonte
1 × $6.00
CM APR (A Pivot Reverse) Trade Method with Austin Passamonte
1 × $6.00 -
×
 A Bull in China with Jim Rogers
1 × $6.00
A Bull in China with Jim Rogers
1 × $6.00 -
×
 How I Trade Major First-Hour Reversals For Rapid Gains with Kevin Haggerty
1 × $6.00
How I Trade Major First-Hour Reversals For Rapid Gains with Kevin Haggerty
1 × $6.00 -
×
 Getting Started in Forex Trading Strategies with Michael Duane Archer
1 × $6.00
Getting Started in Forex Trading Strategies with Michael Duane Archer
1 × $6.00 -
×
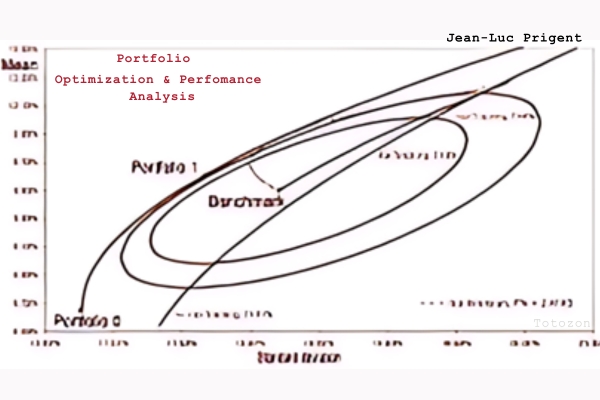 Portfolio Optimization & Perfomance Analysis with Jean-Luc Prigent
1 × $6.00
Portfolio Optimization & Perfomance Analysis with Jean-Luc Prigent
1 × $6.00 -
×
 The Prop Trading Code with Brannigan Barrett - Axia Futures
1 × $23.00
The Prop Trading Code with Brannigan Barrett - Axia Futures
1 × $23.00 -
×
 Futures Broker Home Study Course CTA Series 3 (Fourteenth Ed.) with Center for Futures Education
1 × $6.00
Futures Broker Home Study Course CTA Series 3 (Fourteenth Ed.) with Center for Futures Education
1 × $6.00 -
×
 White Phoenix’s The Smart (Money) Approach to Trading with Jayson Casper
1 × $39.00
White Phoenix’s The Smart (Money) Approach to Trading with Jayson Casper
1 × $39.00 -
×
 How To Read The Market Professionally with TradeSmart
1 × $27.00
How To Read The Market Professionally with TradeSmart
1 × $27.00 -
×
 Order flow self-study training program with iMFtracker
1 × $10.00
Order flow self-study training program with iMFtracker
1 × $10.00 -
×
 Practical Approach to Ninjatrader 8 Platform with Rajandran R
1 × $6.00
Practical Approach to Ninjatrader 8 Platform with Rajandran R
1 × $6.00 -
×
 Best Trading Strategies Revealed - The Prosperity Trading Course (BTSR)
1 × $78.00
Best Trading Strategies Revealed - The Prosperity Trading Course (BTSR)
1 × $78.00 -
×
 Bulk REO 2.0
1 × $23.00
Bulk REO 2.0
1 × $23.00 -
×
 Philadelphia Seminar Replay & PDF Study Guide with ASFX Day Trading
1 × $31.00
Philadelphia Seminar Replay & PDF Study Guide with ASFX Day Trading
1 × $31.00 -
×
 Main Online Course with MadCharts
1 × $5.00
Main Online Course with MadCharts
1 × $5.00 -
×
 Growing Rich with Growth Stocks: Wall Street's Top Money Managers Reveal the 12 Rules for Investment Success - Kirk Kazanjian
1 × $6.00
Growing Rich with Growth Stocks: Wall Street's Top Money Managers Reveal the 12 Rules for Investment Success - Kirk Kazanjian
1 × $6.00 -
×
 Markets In Motion with Ned Davis
1 × $6.00
Markets In Motion with Ned Davis
1 × $6.00 -
×
 The Indices Orderflow Masterclass with The Forex Scalpers
1 × $23.00
The Indices Orderflow Masterclass with The Forex Scalpers
1 × $23.00 -
×
 The Best Option Trading Course with David Jaffee - Best Stock Strategy
1 × $15.00
The Best Option Trading Course with David Jaffee - Best Stock Strategy
1 × $15.00 -
×
 High Probability Trading Using Elliott Wave And Fibonacci Analysis withVic Patel - Forex Training Group
1 × $10.00
High Probability Trading Using Elliott Wave And Fibonacci Analysis withVic Patel - Forex Training Group
1 × $10.00 -
×
 REMORA OPTIONS TRADING (Silver Membership)
1 × $23.00
REMORA OPTIONS TRADING (Silver Membership)
1 × $23.00 -
×
 Forecast 2024 Clarification with Larry Williams
1 × $15.00
Forecast 2024 Clarification with Larry Williams
1 × $15.00 -
×
 Trading Short TermSame Day Trades Sep 2023 with Dan Sheridan & Mark Fenton - Sheridan Options Mentoring
1 × $31.00
Trading Short TermSame Day Trades Sep 2023 with Dan Sheridan & Mark Fenton - Sheridan Options Mentoring
1 × $31.00 -
×
 Getting Started in Technical Analysis with Jack Schwager
1 × $6.00
Getting Started in Technical Analysis with Jack Schwager
1 × $6.00 -
×
 Best of the Best: Collars with Amy Meissner & Scott Ruble
1 × $15.00
Best of the Best: Collars with Amy Meissner & Scott Ruble
1 × $15.00 -
×
 Forex Never Lose Trade & Forex Unknown Secret with Karl Dittmann
1 × $6.00
Forex Never Lose Trade & Forex Unknown Secret with Karl Dittmann
1 × $6.00 -
×
 The Trading Blueprint with Brad Goh - The Trading Geek
1 × $5.00
The Trading Blueprint with Brad Goh - The Trading Geek
1 × $5.00 -
×
 Trend Trading Techniques with Rob Hoffman
1 × $6.00
Trend Trading Techniques with Rob Hoffman
1 × $6.00 -
×
 Advanced Spread Trading with Guy Bower - MasterClass Trader
1 × $15.00
Advanced Spread Trading with Guy Bower - MasterClass Trader
1 × $15.00 -
×
 Understanding the Markets with David Loader
1 × $6.00
Understanding the Markets with David Loader
1 × $6.00 -
×
 TRADING NFX Course with Andrew NFX
1 × $5.00
TRADING NFX Course with Andrew NFX
1 × $5.00 -
×
 Indicators & BWT Bar Types for NT7
1 × $139.00
Indicators & BWT Bar Types for NT7
1 × $139.00 -
×
 AI For Traders with Trading Markets
1 × $31.00
AI For Traders with Trading Markets
1 × $31.00 -
×
 The HV7 Option Trading System with Amy Meissner – Aeromir
1 × $8.00
The HV7 Option Trading System with Amy Meissner – Aeromir
1 × $8.00 -
×
 Quantamentals - The Next Great Forefront Of Trading and Investing with Trading Markets
1 × $8.00
Quantamentals - The Next Great Forefront Of Trading and Investing with Trading Markets
1 × $8.00 -
×
 The A14 Weekly Option Strategy Workshop with Amy Meissner
1 × $23.00
The A14 Weekly Option Strategy Workshop with Amy Meissner
1 × $23.00 -
×
 Home Run Options Trading Course with Dave Aquino - Base Camp Trading
1 × $11.00
Home Run Options Trading Course with Dave Aquino - Base Camp Trading
1 × $11.00 -
×
 WondaFX Signature Strategy with WondaFX
1 × $5.00
WondaFX Signature Strategy with WondaFX
1 × $5.00 -
×
 Compass Trading System with Right Line Trading
1 × $39.00
Compass Trading System with Right Line Trading
1 × $39.00 -
×
 Deep Dive Butterfly Trading Strategy Class with SJG Trades
1 × $41.00
Deep Dive Butterfly Trading Strategy Class with SJG Trades
1 × $41.00 -
×
 Crypto Trading Academy with Cheeky Investor - Aussie Day Trader
1 × $13.00
Crypto Trading Academy with Cheeky Investor - Aussie Day Trader
1 × $13.00 -
×
 Traders Positioning System with Lee Gettess
1 × $4.00
Traders Positioning System with Lee Gettess
1 × $4.00 -
×
 Ichimoku 101 Cloud Trading Secrets
1 × $24.00
Ichimoku 101 Cloud Trading Secrets
1 × $24.00 -
×
 Forex Breakthrough Academy
1 × $31.00
Forex Breakthrough Academy
1 × $31.00 -
×
 TradeCraft: Your Path to Peak Performance Trading By Adam Grimes
1 × $15.00
TradeCraft: Your Path to Peak Performance Trading By Adam Grimes
1 × $15.00 -
×
 Jim Rickards Intelligence Triggers with Agora Financial
1 × $5.00
Jim Rickards Intelligence Triggers with Agora Financial
1 × $5.00 -
×
 The Complete Guide to Multiple Time Frame Analysis & Reading Price Action with Aiman Almansoori
1 × $13.00
The Complete Guide to Multiple Time Frame Analysis & Reading Price Action with Aiman Almansoori
1 × $13.00 -
×
 Harmonic Pattern Detection Indicator
1 × $6.00
Harmonic Pattern Detection Indicator
1 × $6.00 -
×
 Dynamic Support and Resistance Indicator for MT4
1 × $23.00
Dynamic Support and Resistance Indicator for MT4
1 × $23.00 -
×
 Ocean’s CPA Force (Ebook)
1 × $6.00
Ocean’s CPA Force (Ebook)
1 × $6.00 -
×
 Essentials For Amibroker with Matt Radtke - Marwood Research
1 × $15.00
Essentials For Amibroker with Matt Radtke - Marwood Research
1 × $15.00 -
×
 How to Capture Big Profits from Explosive Markets with Glen Ring
1 × $6.00
How to Capture Big Profits from Explosive Markets with Glen Ring
1 × $6.00 -
×
 Wyckoff 2.0: Structures, Volume Profile and Order Flow (Trading and Investing Course: Advanced Technical Analysis) by Rubén Villahermosa
1 × $5.00
Wyckoff 2.0: Structures, Volume Profile and Order Flow (Trading and Investing Course: Advanced Technical Analysis) by Rubén Villahermosa
1 × $5.00 -
×
 Crystal Ball Pack PLUS bonus Live Trade By Pat Mitchell - Trick Trades
1 × $20.00
Crystal Ball Pack PLUS bonus Live Trade By Pat Mitchell - Trick Trades
1 × $20.00 -
×
 All About Market Timing with Leslie N.Masonson
1 × $6.00
All About Market Timing with Leslie N.Masonson
1 × $6.00 -
×
 If You Are So Smart Why Aren’t You Rich with Ben Branch
1 × $6.00
If You Are So Smart Why Aren’t You Rich with Ben Branch
1 × $6.00 -
×
 Forex Trading For Beginners with John Jagerson - Investopedia Academy
1 × $6.00
Forex Trading For Beginners with John Jagerson - Investopedia Academy
1 × $6.00 -
×
 Scalping Master Class with Day One Traders
1 × $5.00
Scalping Master Class with Day One Traders
1 × $5.00 -
×
 W. D Gann 's Square Of 9 Applied To Modern Markets with Sean Avidar - Hexatrade350
1 × $23.00
W. D Gann 's Square Of 9 Applied To Modern Markets with Sean Avidar - Hexatrade350
1 × $23.00 -
×
 Forex Trading using Intermarket Analysis with Louis Mendelsohn
1 × $6.00
Forex Trading using Intermarket Analysis with Louis Mendelsohn
1 × $6.00 -
×
 Trading by the Book (tradingeducators.com)
1 × $6.00
Trading by the Book (tradingeducators.com)
1 × $6.00 -
×
 Maximizing Profits with Weekly Options with Optionpit
1 × $15.00
Maximizing Profits with Weekly Options with Optionpit
1 × $15.00 -
×
 FX Daniel Savage Bundle (2in1)
1 × $23.00
FX Daniel Savage Bundle (2in1)
1 × $23.00 -
×
 The Whale Trade Workshop Plus One Week of Live Trading with Doc Severson
1 × $6.00
The Whale Trade Workshop Plus One Week of Live Trading with Doc Severson
1 × $6.00 -
×
 Matrix Spread Options Trading Course with Base Camp Trading
1 × $31.00
Matrix Spread Options Trading Course with Base Camp Trading
1 × $31.00 -
×
 Trading by the Minute - Joe Ross
1 × $6.00
Trading by the Minute - Joe Ross
1 × $6.00 -
×
 Wyckoff Stock Market Institute
1 × $5.00
Wyckoff Stock Market Institute
1 × $5.00 -
×
 Pay me in Stock Options with Carol Curtis
1 × $6.00
Pay me in Stock Options with Carol Curtis
1 × $6.00 -
×
 Outsmarting Wall Street (3rd Ed) with Daniel Alan Seiver
1 × $6.00
Outsmarting Wall Street (3rd Ed) with Daniel Alan Seiver
1 × $6.00 -
×
 Iron Condors in a Volatile Market 2022 with Dan Sheridan - Sheridan Options Mentoring
1 × $46.00
Iron Condors in a Volatile Market 2022 with Dan Sheridan - Sheridan Options Mentoring
1 × $46.00 -
×
 Market Stalkers Level 2 - Daytrading College (2020)
1 × $8.00
Market Stalkers Level 2 - Daytrading College (2020)
1 × $8.00 -
×
 Forex Master Levels with Nicola Delic
1 × $15.00
Forex Master Levels with Nicola Delic
1 × $15.00 -
×
 7 Things You MUST Know about Forex Candlesticks
1 × $4.00
7 Things You MUST Know about Forex Candlesticks
1 × $4.00 -
×
 Essentials in Quantitative Trading QT01 By HangukQuant's
1 × $23.00
Essentials in Quantitative Trading QT01 By HangukQuant's
1 × $23.00 -
×
 How I Trade Options with Jon Najarian
1 × $4.00
How I Trade Options with Jon Najarian
1 × $4.00 -
×
 Market Magic: Riding the Greatest Bull Market of the Century with Louise Yamada
1 × $6.00
Market Magic: Riding the Greatest Bull Market of the Century with Louise Yamada
1 × $6.00 -
×
 Beating the Financial Futures Market
1 × $6.00
Beating the Financial Futures Market
1 × $6.00 -
×
 Trading with the Gods Fibonacci Series with Alan Oliver
1 × $6.00
Trading with the Gods Fibonacci Series with Alan Oliver
1 × $6.00 -
×
 What Works in Online Trading with Mark Etzkorn
1 × $6.00
What Works in Online Trading with Mark Etzkorn
1 × $6.00 -
×
 Order Flow With The Power Of Point Of Control Course and The Imbalance
1 × $6.00
Order Flow With The Power Of Point Of Control Course and The Imbalance
1 × $6.00 -
×
 Options Trading & Ultimate MasterClass With Tyrone Abela - FX Evolution
1 × $54.00
Options Trading & Ultimate MasterClass With Tyrone Abela - FX Evolution
1 × $54.00 -
×
 Power Charting - Robert’s Indicator Webinar
1 × $6.00
Power Charting - Robert’s Indicator Webinar
1 × $6.00 -
×
 Time, Price & Pattern with John Crane
1 × $6.00
Time, Price & Pattern with John Crane
1 × $6.00 -
×
 Ichimoku Traders Academy with Tyler Espitia
1 × $31.00
Ichimoku Traders Academy with Tyler Espitia
1 × $31.00 -
×
 Artificial Neural Networks Technology with Dave Anderson, George McNeill
1 × $6.00
Artificial Neural Networks Technology with Dave Anderson, George McNeill
1 × $6.00 -
×
 Smart Money Trading Course with Prosperity Academy
1 × $5.00
Smart Money Trading Course with Prosperity Academy
1 × $5.00 -
×
 Understanding Wall Street (4th Ed.) with Jeffrey Little
1 × $6.00
Understanding Wall Street (4th Ed.) with Jeffrey Little
1 × $6.00 -
×
 5-Step-Trading Stocks I and II with Lex Van Dam
1 × $4.00
5-Step-Trading Stocks I and II with Lex Van Dam
1 × $4.00 -
×
 WITS Turbo Seminars with Brian James Sklenka
1 × $6.00
WITS Turbo Seminars with Brian James Sklenka
1 × $6.00 -
×
 Options University - FX Technical Analysis
1 × $6.00
Options University - FX Technical Analysis
1 × $6.00 -
×
 Complete Cryptocurrency Trading 2021
1 × $5.00
Complete Cryptocurrency Trading 2021
1 × $5.00 -
×
 Build A Career In Forex Trading - Learn Fundamental Analysis - Luciano Kelly & Learn Forex Mentor
1 × $4.00
Build A Career In Forex Trading - Learn Fundamental Analysis - Luciano Kelly & Learn Forex Mentor
1 × $4.00

TTM Slingshot & Value Charts Indicators
$6.00
File Size: Coming soon!
Delivery Time: 1–12 hours
Media Type: Online Course
TTM Slingshot & Value Charts Indicators
Introduction to TTM Slingshot & Value Charts
In the dynamic world of trading, having the right tools can make all the difference. Two such powerful tools are the TTM Slingshot and Value Charts Indicators. These indicators provide traders with crucial insights, helping them navigate market complexities and make informed decisions.
Understanding TTM Slingshot
What is TTM Slingshot?
The TTM Slingshot is an advanced trading indicator developed by John Carter. It combines multiple moving averages to identify potential breakout points in the market. By analyzing the relationship between these moving averages, the TTM Slingshot helps traders spot opportunities for entering or exiting trades.
Key Features of TTM Slingshot
- Multiple Moving Averages: Uses short-term and long-term moving averages.
- Breakout Identification: Detects potential breakout points.
- Versatility: Applicable across various markets and timeframes.
Benefits of Using TTM Slingshot
Enhanced Market Analysis
The TTM Slingshot provides a detailed analysis of market trends, allowing traders to anticipate significant price movements. This indicator’s ability to pinpoint breakout points is invaluable for making timely trading decisions.
Improved Trading Accuracy
By combining multiple moving averages, the TTM Slingshot offers a comprehensive view of the market. This integration reduces noise and enhances the accuracy of predictions, leading to more successful trades.
Setting Up TTM Slingshot
Choosing the Right Platform
To utilize the TTM Slingshot, you’ll need a trading platform that supports custom indicators. Platforms like Thinkorswim and TradeStation are popular choices among traders.
Installing the Indicator
- Download the Indicator: Obtain the TTM Slingshot file compatible with your trading platform.
- Open Your Platform: Launch the trading platform.
- Add the Indicator: Navigate to the ‘Indicators’ section and add the TTM Slingshot file.
- Customize Settings: Adjust the settings to align with your trading strategy.
Understanding Value Charts Indicators
What are Value Charts Indicators?
Value Charts Indicators are tools that measure the relative value of a security based on its price history. These indicators help traders determine whether a security is overvalued, undervalued, or fairly valued, providing a clear picture of potential trading opportunities.
Key Features of Value Charts Indicators
- Relative Value Measurement: Assesses the value of a security.
- Overbought/Oversold Conditions: Identifies extreme market conditions.
- Visual Representation: Displays value levels on a chart for easy interpretation.
Benefits of Using Value Charts Indicators
Identifying Market Extremes
Value Charts Indicators are excellent for spotting overbought and oversold conditions. By identifying these extremes, traders can make strategic decisions about entering or exiting positions.
Enhancing Risk Management
These indicators aid in risk management by providing insights into the relative value of a security. Traders can use this information to set stop-loss levels and protect their investments.
Setting Up Value Charts Indicators
Selecting the Appropriate Platform
Choose a trading platform that supports Value Charts Indicators. Many modern trading platforms, such as NinjaTrader and MetaTrader, offer these indicators.
Installing the Indicator
- Download the Indicator: Obtain the Value Charts Indicator file for your platform.
- Open Your Platform: Start the trading platform.
- Add the Indicator: Go to the ‘Indicators’ section and add the Value Charts file.
- Configure Settings: Customize the settings to fit your trading approach.
How to Use TTM Slingshot & Value Charts Together
Combining Indicators for Better Insights
Using TTM Slingshot and Value Charts Indicators together can enhance your market analysis. While TTM Slingshot identifies breakout points, Value Charts Indicators help assess the relative value of the security, providing a more comprehensive view.
Practical Application
- Entry Points: Use TTM Slingshot to identify breakout points and confirm with Value Charts Indicators to ensure the security is not overvalued.
- Exit Points: Value Charts Indicators can signal overbought conditions, indicating a good time to exit, while TTM Slingshot confirms the end of a trend.
Advanced Strategies with TTM Slingshot & Value Charts
Pairing with Other Indicators
For even more robust analysis, pair TTM Slingshot and Value Charts Indicators with other tools such as RSI (Relative Strength Index) and MACD (Moving Average Convergence Divergence).
Developing a Trading Plan
Create a detailed trading plan that incorporates these indicators. Define your entry and exit points, risk management strategies, and the specific market conditions you’re targeting.
Real-Life Examples
Successful Trade Case Study
Consider a scenario where the TTM Slingshot indicates a breakout, and Value Charts Indicators show the security is undervalued. Entering a trade at this point could lead to significant profits as the price moves to its fair value.
Learning from Mistakes
Analyze trades where the indicators did not predict the expected outcome. Understanding these failures can help refine your strategy and improve future performance.
Conclusion
Maximizing Your Trading Success
The TTM Slingshot and Value Charts Indicators are powerful tools that, when used together, can significantly enhance your trading strategy. By providing insights into market trends and relative value, these indicators help you make more informed decisions.
Taking the Next Step
Start by setting up these indicators on your trading platform. Practice interpreting the signals and integrating them into your trading strategy to see the benefits firsthand.

FAQs
What is the TTM Slingshot indicator?
The TTM Slingshot is a trading tool that uses multiple moving averages to identify breakout points in the market.
How do Value Charts Indicators work?
Value Charts Indicators measure the relative value of a security, helping traders identify overbought and oversold conditions.
Can these indicators be used together?
Yes, combining TTM Slingshot and Value Charts Indicators provides a comprehensive analysis of market trends and security value.
Which platforms support these indicators?
Platforms like Thinkorswim, TradeStation, NinjaTrader, and MetaTrader support TTM Slingshot and Value Charts Indicators.
How do I install these indicators?
Download the respective indicator files, open your trading platform, and add the indicators through the ‘Indicators’ section.
Be the first to review “TTM Slingshot & Value Charts Indicators”
You must be logged in to post a review.
Related products
Original price was: $1,849.00.$15.00Current price is: $15.00.

Original price was: $299.00.$8.00Current price is: $8.00.

Original price was: $2,120.00.$15.00Current price is: $15.00.

Forex Trading
Original price was: $999.00.$15.00Current price is: $15.00.
Forex Trading
Original price was: $4,997.00.$27.00Current price is: $27.00.
Original price was: $700.00.$39.00Current price is: $39.00.
Original price was: $1,800.00.$54.00Current price is: $54.00.
Forex Trading
Original price was: $500.00.$5.00Current price is: $5.00.
Original price was: $497.00.$31.00Current price is: $31.00.
Original price was: $649.00.$20.00Current price is: $20.00.

Original price was: $997.00.$8.00Current price is: $8.00.

Forex Trading
Original price was: $2,000.00.$23.00Current price is: $23.00.

Forex Trading
Original price was: $125.00.$17.00Current price is: $17.00.
Forex Trading
Original price was: $850.00.$23.00Current price is: $23.00.
Original price was: $997.00.$13.00Current price is: $13.00.

Forex Trading
Original price was: $239.00.$8.00Current price is: $8.00.

Forex Trading
Original price was: $799.00.$15.00Current price is: $15.00.
Forex Trading
Original price was: $550.00.$5.00Current price is: $5.00.
Forex Trading
Quantamentals – The Next Great Forefront Of Trading and Investing with Trading Markets
Original price was: $1,495.00.$8.00Current price is: $8.00.
Original price was: $895.00.$15.00Current price is: $15.00.

Reviews
There are no reviews yet.