-
×
 Opportunity Investing with Gerald Appel
1 × $6.00
Opportunity Investing with Gerald Appel
1 × $6.00 -
×
 Jigsaw Orderflow Training Course with Jigsaw Trading
1 × $6.00
Jigsaw Orderflow Training Course with Jigsaw Trading
1 × $6.00 -
×
 Jesse Livermore Trading System with Joe Marwood - Marwood Research
1 × $15.00
Jesse Livermore Trading System with Joe Marwood - Marwood Research
1 × $15.00 -
×
 Ultimate Trading Course with Dodgy's Dungeon
1 × $8.00
Ultimate Trading Course with Dodgy's Dungeon
1 × $8.00 -
×
 The TradingKey - Mastering Elliott Wave by Rob Roy 2010 + Complete Workbooks with HUBB Financial
1 × $6.00
The TradingKey - Mastering Elliott Wave by Rob Roy 2010 + Complete Workbooks with HUBB Financial
1 × $6.00 -
×
 Options Trading & Ultimate MasterClass With Tyrone Abela - FX Evolution
1 × $54.00
Options Trading & Ultimate MasterClass With Tyrone Abela - FX Evolution
1 × $54.00 -
×
 Wyckoff Analysis Series. Module 2. Wyckoff Candle Volume Analysis
1 × $6.00
Wyckoff Analysis Series. Module 2. Wyckoff Candle Volume Analysis
1 × $6.00 -
×
 The Telecoms Trade War with Mark Naftel
1 × $6.00
The Telecoms Trade War with Mark Naftel
1 × $6.00 -
×
 Volcano Trading with Claytrader
1 × $15.00
Volcano Trading with Claytrader
1 × $15.00 -
×
 Tick By Tick By Alphonso Esposito - TradeSmart
1 × $6.00
Tick By Tick By Alphonso Esposito - TradeSmart
1 × $6.00 -
×
 The Haller Theory of Stock Market Trends
1 × $6.00
The Haller Theory of Stock Market Trends
1 × $6.00 -
×
 The Best Option Trading Course with David Jaffee - Best Stock Strategy
1 × $15.00
The Best Option Trading Course with David Jaffee - Best Stock Strategy
1 × $15.00 -
×
 How To Read The Market Professionally with TradeSmart
1 × $27.00
How To Read The Market Professionally with TradeSmart
1 × $27.00 -
×
 Cwesi Forex Trading Bootcamp (Algo Trading)
1 × $13.00
Cwesi Forex Trading Bootcamp (Algo Trading)
1 × $13.00 -
×
 AI For Traders with Trading Markets
1 × $31.00
AI For Traders with Trading Markets
1 × $31.00 -
×
 Matrix Spread Options Trading Course with Base Camp Trading
1 × $31.00
Matrix Spread Options Trading Course with Base Camp Trading
1 × $31.00 -
×
 Trading System Development 101,102,103
1 × $6.00
Trading System Development 101,102,103
1 × $6.00 -
×
 Lessons from the Greatest Stock Traders of all Time with John Boik
1 × $6.00
Lessons from the Greatest Stock Traders of all Time with John Boik
1 × $6.00 -
×
 XJO Quant - High Probability Trading Setups on ASX 200 Index
1 × $31.00
XJO Quant - High Probability Trading Setups on ASX 200 Index
1 × $31.00 -
×
 Butterfly and Condor Workshop with Aeromir
1 × $15.00
Butterfly and Condor Workshop with Aeromir
1 × $15.00 -
×
 BookMap Advanced v6.1
1 × $6.00
BookMap Advanced v6.1
1 × $6.00 -
×
 Advanced Forex Patterns with Vic Noble & Darko Ali
1 × $39.00
Advanced Forex Patterns with Vic Noble & Darko Ali
1 × $39.00 -
×
 Buy the Fear Sell the Greed
1 × $6.00
Buy the Fear Sell the Greed
1 × $6.00 -
×
 The Orderflow Masterclass with PrimeTrading
1 × $17.00
The Orderflow Masterclass with PrimeTrading
1 × $17.00 -
×
 New Foundations for Auction Market Trading Course with Tom Alexander
1 × $54.00
New Foundations for Auction Market Trading Course with Tom Alexander
1 × $54.00 -
×
 Tradematic Trading Strategy
1 × $31.00
Tradematic Trading Strategy
1 × $31.00 -
×
 Trading Weekly Options for Income in 2016 with Dan Sheridan
1 × $23.00
Trading Weekly Options for Income in 2016 with Dan Sheridan
1 × $23.00 -
×
 Mastering Trading Stress with Ari Kiev
1 × $6.00
Mastering Trading Stress with Ari Kiev
1 × $6.00 -
×
 Winning System For Trading High-Performance Stocks with Tim Cho
1 × $6.00
Winning System For Trading High-Performance Stocks with Tim Cho
1 × $6.00 -
×
 Scalp Strategy and Flipping Small Accounts with Opes Trading Group
1 × $5.00
Scalp Strategy and Flipping Small Accounts with Opes Trading Group
1 × $5.00 -
×
 A Trader’s Guide To Discipline
1 × $6.00
A Trader’s Guide To Discipline
1 × $6.00 -
×
 The Orderflows Trade Opportunities Encyclopedia with Michael Valtos
1 × $8.00
The Orderflows Trade Opportunities Encyclopedia with Michael Valtos
1 × $8.00 -
×
 Building Wealth In Stock Market with David Novac
1 × $6.00
Building Wealth In Stock Market with David Novac
1 × $6.00 -
×
 Vom Einsteiger zum Mastertrader 2.0 with Mehrwert Garantier
1 × $109.00
Vom Einsteiger zum Mastertrader 2.0 with Mehrwert Garantier
1 × $109.00 -
×
 W. D Gann 's Square Of 9 Applied To Modern Markets with Sean Avidar - Hexatrade350
1 × $23.00
W. D Gann 's Square Of 9 Applied To Modern Markets with Sean Avidar - Hexatrade350
1 × $23.00 -
×
 Breakthrough Strategies for Predicting Any Market: Charting Elliott Wave, Lucas, Fibonacci and Time for Profit - Jeff Greenblatt & Dawn Bolton-Smith
1 × $6.00
Breakthrough Strategies for Predicting Any Market: Charting Elliott Wave, Lucas, Fibonacci and Time for Profit - Jeff Greenblatt & Dawn Bolton-Smith
1 × $6.00 -
×
 Timing the Market with Unique Indicators with Sherman McCellan
1 × $6.00
Timing the Market with Unique Indicators with Sherman McCellan
1 × $6.00 -
×
 Building Cryptocurrencies with JavaScript By Stone River eLearning
1 × $6.00
Building Cryptocurrencies with JavaScript By Stone River eLearning
1 × $6.00 -
×
 Secret Income with James Altucher
1 × $62.00
Secret Income with James Altucher
1 × $62.00 -
×
 The Volatility Surface with Jim Gatheral
1 × $6.00
The Volatility Surface with Jim Gatheral
1 × $6.00 -
×
 Trading Short TermSame Day Trades Sep 2023 with Dan Sheridan & Mark Fenton - Sheridan Options Mentoring
1 × $31.00
Trading Short TermSame Day Trades Sep 2023 with Dan Sheridan & Mark Fenton - Sheridan Options Mentoring
1 × $31.00 -
×
 Cycle Trends Professional 2.3 Rear Time with Esignal cycletrends.co.za
1 × $6.00
Cycle Trends Professional 2.3 Rear Time with Esignal cycletrends.co.za
1 × $6.00 -
×
 TradeCraft: Your Path to Peak Performance Trading By Adam Grimes
1 × $15.00
TradeCraft: Your Path to Peak Performance Trading By Adam Grimes
1 × $15.00 -
×
 Portfolio Management-Earn 12 Hours CE Credits
1 × $85.00
Portfolio Management-Earn 12 Hours CE Credits
1 × $85.00 -
×
 Snapbacks CD
1 × $6.00
Snapbacks CD
1 × $6.00 -
×
 0 DTE Options Trading Workshop with Aeromir Corporation
1 × $15.00
0 DTE Options Trading Workshop with Aeromir Corporation
1 × $15.00 -
×
 Beat the Bear with Jea Yu
1 × $6.00
Beat the Bear with Jea Yu
1 × $6.00 -
×
 Weekly Iron Condors For Income with Bruce Wayne
1 × $6.00
Weekly Iron Condors For Income with Bruce Wayne
1 × $6.00 -
×
 The Options Trading Body of Knowledge with Michael Thomsett
1 × $6.00
The Options Trading Body of Knowledge with Michael Thomsett
1 × $6.00 -
×
 WyseTrade Trading Masterclass Course
1 × $5.00
WyseTrade Trading Masterclass Course
1 × $5.00 -
×
 Value Investing Bootcamp with Nick Kraakman
1 × $15.00
Value Investing Bootcamp with Nick Kraakman
1 × $15.00 -
×
 The Three Secrets to Trading Momentum Indicators with David Penn
1 × $6.00
The Three Secrets to Trading Momentum Indicators with David Penn
1 × $6.00 -
×
 Order flow self-study training program with iMFtracker
1 × $10.00
Order flow self-study training program with iMFtracker
1 × $10.00 -
×
 TradeGuider VSA Plugin for MetaTrader 4
1 × $6.00
TradeGuider VSA Plugin for MetaTrader 4
1 × $6.00 -
×
 Crypto Trading Academy with Cheeky Investor - Aussie Day Trader
1 × $13.00
Crypto Trading Academy with Cheeky Investor - Aussie Day Trader
1 × $13.00 -
×
 Algo Trading Masterclass with Ali Casey - StatOasis
1 × $23.00
Algo Trading Masterclass with Ali Casey - StatOasis
1 × $23.00 -
×
 The Complete Guide to Multiple Time Frame Analysis & Reading Price Action with Aiman Almansoori
1 × $13.00
The Complete Guide to Multiple Time Frame Analysis & Reading Price Action with Aiman Almansoori
1 × $13.00 -
×
 Baby Blue Trading Technique for the E-Minis with Dave Wright
1 × $6.00
Baby Blue Trading Technique for the E-Minis with Dave Wright
1 × $6.00 -
×
 Hedge Fund Trading Systems with Trading Tuitions
1 × $5.00
Hedge Fund Trading Systems with Trading Tuitions
1 × $5.00 -
×
 Tom Williams Final Mentorship Course
1 × $6.00
Tom Williams Final Mentorship Course
1 × $6.00 -
×
 Advanced Spread Trading with Guy Bower - MasterClass Trader
1 × $15.00
Advanced Spread Trading with Guy Bower - MasterClass Trader
1 × $15.00 -
×
 Adz Trading Academy
1 × $5.00
Adz Trading Academy
1 × $5.00 -
×
 US indices system with LaMartinatradingFx
1 × $10.00
US indices system with LaMartinatradingFx
1 × $10.00 -
×
 The Naked Eye: Raw Data Analytics with Edgar Torres - Raw Data Analytics
1 × $8.00
The Naked Eye: Raw Data Analytics with Edgar Torres - Raw Data Analytics
1 × $8.00 -
×
 Tradezilla 2.0
1 × $5.00
Tradezilla 2.0
1 × $5.00 -
×
 Advanced Daytrading Seminar with Ken Calhoun
1 × $155.00
Advanced Daytrading Seminar with Ken Calhoun
1 × $155.00 -
×
 Volume Profile Formula with Aaron Korbs
1 × $5.00
Volume Profile Formula with Aaron Korbs
1 × $5.00 -
×
 Best of the Best: Collars with Amy Meissner & Scott Ruble
1 × $15.00
Best of the Best: Collars with Amy Meissner & Scott Ruble
1 × $15.00 -
×
 The Whale Order with The Forex Scalpers
1 × $5.00
The Whale Order with The Forex Scalpers
1 × $5.00 -
×
 Essentials in Quantitative Trading QT01 By HangukQuant's
1 × $23.00
Essentials in Quantitative Trading QT01 By HangukQuant's
1 × $23.00 -
×
 Forecast 2024 Clarification with Larry Williams
1 × $15.00
Forecast 2024 Clarification with Larry Williams
1 × $15.00 -
×
 6 Dynamic Trader Real Time and End Of Day
1 × $39.00
6 Dynamic Trader Real Time and End Of Day
1 × $39.00 -
×
 BWT Precision 7.0.2.3 (bluewavetrading.com)
1 × $31.00
BWT Precision 7.0.2.3 (bluewavetrading.com)
1 × $31.00 -
×
 WondaFX Signature Strategy with WondaFX
1 × $5.00
WondaFX Signature Strategy with WondaFX
1 × $5.00 -
×
 Pro Indicator Pack with Trade Confident
1 × $15.00
Pro Indicator Pack with Trade Confident
1 × $15.00 -
×
 The Trading Blueprint with Brad Goh - The Trading Geek
1 × $5.00
The Trading Blueprint with Brad Goh - The Trading Geek
1 × $5.00 -
×
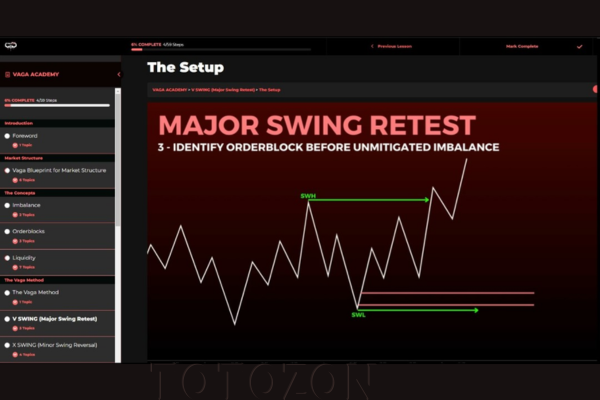 Vaga Academy with VAGAFX
1 × $5.00
Vaga Academy with VAGAFX
1 × $5.00 -
×
 Vega Modified Butterfly Class with Jay Bailey - Sheridan Options Mentoring
1 × $31.00
Vega Modified Butterfly Class with Jay Bailey - Sheridan Options Mentoring
1 × $31.00 -
×
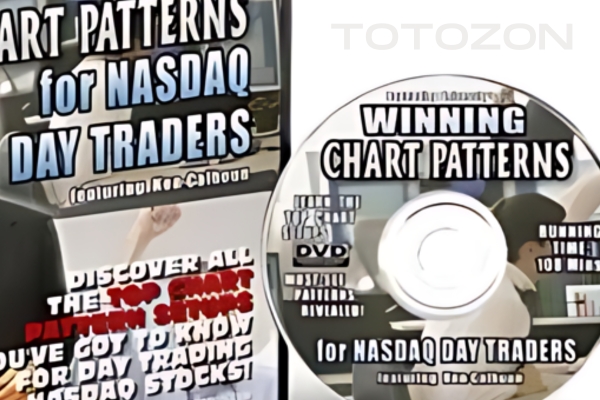 Winning Chart Patterns For NASDAQ Traders Version 2 - 1 DVD with Ken Calhoun
1 × $6.00
Winning Chart Patterns For NASDAQ Traders Version 2 - 1 DVD with Ken Calhoun
1 × $6.00 -
×
 $20 – 52k 20 pips a day challange with Rafał Zuchowicz - TopMasterTrader
1 × $5.00
$20 – 52k 20 pips a day challange with Rafał Zuchowicz - TopMasterTrader
1 × $5.00 -
×
 The Risk-Wise Investor: How to Better Understand and Manage Risk with Michael Carpenter
1 × $6.00
The Risk-Wise Investor: How to Better Understand and Manage Risk with Michael Carpenter
1 × $6.00 -
×
 W.O.W. Guaranteed Income with Chuck Hughes
1 × $31.00
W.O.W. Guaranteed Income with Chuck Hughes
1 × $31.00 -
×
 Astrology & Stock Market Forecasting with Louise McWhirter
1 × $4.00
Astrology & Stock Market Forecasting with Louise McWhirter
1 × $4.00 -
×
 Trendfund.com - Scalping, Options, Advanced Options
1 × $4.00
Trendfund.com - Scalping, Options, Advanced Options
1 × $4.00 -
×
 Top Futures Day Trading Course DVD
1 × $6.00
Top Futures Day Trading Course DVD
1 × $6.00 -
×
 Candlestick Trading Forum Trading Seminar with Stephen W.Bigalow
1 × $4.00
Candlestick Trading Forum Trading Seminar with Stephen W.Bigalow
1 × $4.00 -
×
 Options Trading Course with Consistent Options Income
1 × $5.00
Options Trading Course with Consistent Options Income
1 × $5.00 -
×
 The New Investment Superstars: 13 Great Investors and Their Strategies for Superior Returns - Lois Peltz
1 × $6.00
The New Investment Superstars: 13 Great Investors and Their Strategies for Superior Returns - Lois Peltz
1 × $6.00 -
×
 Anton Kreil - Professional Options Trading Masterclass
1 × $23.00
Anton Kreil - Professional Options Trading Masterclass
1 × $23.00 -
×
 Investors Live Textbook Trading DVD
1 × $15.00
Investors Live Textbook Trading DVD
1 × $15.00 -
×
 The Nature of Risk with Justin Mamis
1 × $6.00
The Nature of Risk with Justin Mamis
1 × $6.00 -
×
 Precise Exits & Entries with Charles LeBeau
1 × $6.00
Precise Exits & Entries with Charles LeBeau
1 × $6.00 -
×
 The Triad Formula System with Jason Fielder
1 × $6.00
The Triad Formula System with Jason Fielder
1 × $6.00 -
×
 Tick Trader Bundle with Top Trade Tools
1 × $54.00
Tick Trader Bundle with Top Trade Tools
1 × $54.00 -
×
 War Room Technicals Vol. 3 with Trick Trades
1 × $6.00
War Room Technicals Vol. 3 with Trick Trades
1 × $6.00 -
×
 SQX Mentorship with Tip Toe Hippo
1 × $23.00
SQX Mentorship with Tip Toe Hippo
1 × $23.00 -
×
 CFA Level 2 - Examination Book Afternoon Section (1999)
1 × $6.00
CFA Level 2 - Examination Book Afternoon Section (1999)
1 × $6.00 -
×
 Unlocking Success in ICT 2022 Mentorship: The Smart Money Guide to The Full ICT Day Trading Model by LumiTraders & Darya Filipenka
1 × $5.00
Unlocking Success in ICT 2022 Mentorship: The Smart Money Guide to The Full ICT Day Trading Model by LumiTraders & Darya Filipenka
1 × $5.00 -
×
 The Ultimate Trader Transformation
1 × $62.00
The Ultimate Trader Transformation
1 × $62.00 -
×
 Bond Market Course with The Macro Compass
1 × $15.00
Bond Market Course with The Macro Compass
1 × $15.00 -
×
 Option Trader Magazine (optionstradermag.com) with Magazine
1 × $6.00
Option Trader Magazine (optionstradermag.com) with Magazine
1 × $6.00 -
×
 The Prop Trading Code with Brannigan Barrett - Axia Futures
1 × $23.00
The Prop Trading Code with Brannigan Barrett - Axia Futures
1 × $23.00 -
×
 Raghee’s Winners Circle Course
1 × $6.00
Raghee’s Winners Circle Course
1 × $6.00 -
×
 Deep Dive Butterfly Trading Strategy Class with SJG Trades
1 × $41.00
Deep Dive Butterfly Trading Strategy Class with SJG Trades
1 × $41.00 -
×
 The A14 Weekly Option Strategy Workshop with Amy Meissner
1 × $23.00
The A14 Weekly Option Strategy Workshop with Amy Meissner
1 × $23.00 -
×
 Learn Forex Cash Bomb
1 × $6.00
Learn Forex Cash Bomb
1 × $6.00 -
×
 Home Run Options Trading Course with Dave Aquino - Base Camp Trading
1 × $11.00
Home Run Options Trading Course with Dave Aquino - Base Camp Trading
1 × $11.00 -
×
 Wall Street Stories with Edwin Lefevre
1 × $6.00
Wall Street Stories with Edwin Lefevre
1 × $6.00 -
×
 The Ultimate Option Guide When & How to Use Which Strategy for The Best Results with Larry Gaines - Power Cycle Trading
1 × $39.00
The Ultimate Option Guide When & How to Use Which Strategy for The Best Results with Larry Gaines - Power Cycle Trading
1 × $39.00 -
×
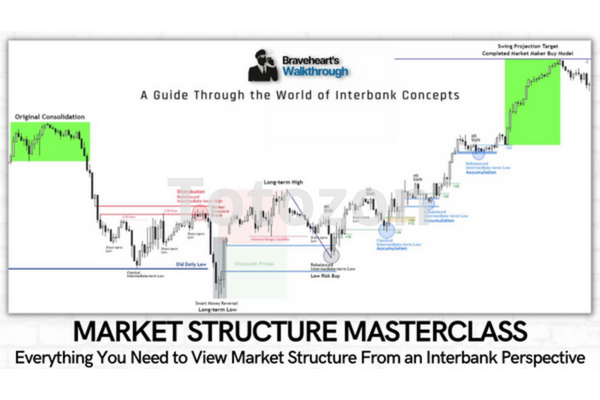 Market Structure Masterclass with Braveheart Trading
1 × $5.00
Market Structure Masterclass with Braveheart Trading
1 × $5.00 -
×
 WealthFRX Trading Mastery 3.0
1 × $5.00
WealthFRX Trading Mastery 3.0
1 × $5.00

TTM Slingshot & Value Charts Indicators
$6.00
File Size: Coming soon!
Delivery Time: 1–12 hours
Media Type: Online Course
TTM Slingshot & Value Charts Indicators
Introduction to TTM Slingshot & Value Charts
In the dynamic world of trading, having the right tools can make all the difference. Two such powerful tools are the TTM Slingshot and Value Charts Indicators. These indicators provide traders with crucial insights, helping them navigate market complexities and make informed decisions.
Understanding TTM Slingshot
What is TTM Slingshot?
The TTM Slingshot is an advanced trading indicator developed by John Carter. It combines multiple moving averages to identify potential breakout points in the market. By analyzing the relationship between these moving averages, the TTM Slingshot helps traders spot opportunities for entering or exiting trades.
Key Features of TTM Slingshot
- Multiple Moving Averages: Uses short-term and long-term moving averages.
- Breakout Identification: Detects potential breakout points.
- Versatility: Applicable across various markets and timeframes.
Benefits of Using TTM Slingshot
Enhanced Market Analysis
The TTM Slingshot provides a detailed analysis of market trends, allowing traders to anticipate significant price movements. This indicator’s ability to pinpoint breakout points is invaluable for making timely trading decisions.
Improved Trading Accuracy
By combining multiple moving averages, the TTM Slingshot offers a comprehensive view of the market. This integration reduces noise and enhances the accuracy of predictions, leading to more successful trades.
Setting Up TTM Slingshot
Choosing the Right Platform
To utilize the TTM Slingshot, you’ll need a trading platform that supports custom indicators. Platforms like Thinkorswim and TradeStation are popular choices among traders.
Installing the Indicator
- Download the Indicator: Obtain the TTM Slingshot file compatible with your trading platform.
- Open Your Platform: Launch the trading platform.
- Add the Indicator: Navigate to the ‘Indicators’ section and add the TTM Slingshot file.
- Customize Settings: Adjust the settings to align with your trading strategy.
Understanding Value Charts Indicators
What are Value Charts Indicators?
Value Charts Indicators are tools that measure the relative value of a security based on its price history. These indicators help traders determine whether a security is overvalued, undervalued, or fairly valued, providing a clear picture of potential trading opportunities.
Key Features of Value Charts Indicators
- Relative Value Measurement: Assesses the value of a security.
- Overbought/Oversold Conditions: Identifies extreme market conditions.
- Visual Representation: Displays value levels on a chart for easy interpretation.
Benefits of Using Value Charts Indicators
Identifying Market Extremes
Value Charts Indicators are excellent for spotting overbought and oversold conditions. By identifying these extremes, traders can make strategic decisions about entering or exiting positions.
Enhancing Risk Management
These indicators aid in risk management by providing insights into the relative value of a security. Traders can use this information to set stop-loss levels and protect their investments.
Setting Up Value Charts Indicators
Selecting the Appropriate Platform
Choose a trading platform that supports Value Charts Indicators. Many modern trading platforms, such as NinjaTrader and MetaTrader, offer these indicators.
Installing the Indicator
- Download the Indicator: Obtain the Value Charts Indicator file for your platform.
- Open Your Platform: Start the trading platform.
- Add the Indicator: Go to the ‘Indicators’ section and add the Value Charts file.
- Configure Settings: Customize the settings to fit your trading approach.
How to Use TTM Slingshot & Value Charts Together
Combining Indicators for Better Insights
Using TTM Slingshot and Value Charts Indicators together can enhance your market analysis. While TTM Slingshot identifies breakout points, Value Charts Indicators help assess the relative value of the security, providing a more comprehensive view.
Practical Application
- Entry Points: Use TTM Slingshot to identify breakout points and confirm with Value Charts Indicators to ensure the security is not overvalued.
- Exit Points: Value Charts Indicators can signal overbought conditions, indicating a good time to exit, while TTM Slingshot confirms the end of a trend.
Advanced Strategies with TTM Slingshot & Value Charts
Pairing with Other Indicators
For even more robust analysis, pair TTM Slingshot and Value Charts Indicators with other tools such as RSI (Relative Strength Index) and MACD (Moving Average Convergence Divergence).
Developing a Trading Plan
Create a detailed trading plan that incorporates these indicators. Define your entry and exit points, risk management strategies, and the specific market conditions you’re targeting.
Real-Life Examples
Successful Trade Case Study
Consider a scenario where the TTM Slingshot indicates a breakout, and Value Charts Indicators show the security is undervalued. Entering a trade at this point could lead to significant profits as the price moves to its fair value.
Learning from Mistakes
Analyze trades where the indicators did not predict the expected outcome. Understanding these failures can help refine your strategy and improve future performance.
Conclusion
Maximizing Your Trading Success
The TTM Slingshot and Value Charts Indicators are powerful tools that, when used together, can significantly enhance your trading strategy. By providing insights into market trends and relative value, these indicators help you make more informed decisions.
Taking the Next Step
Start by setting up these indicators on your trading platform. Practice interpreting the signals and integrating them into your trading strategy to see the benefits firsthand.

FAQs
What is the TTM Slingshot indicator?
The TTM Slingshot is a trading tool that uses multiple moving averages to identify breakout points in the market.
How do Value Charts Indicators work?
Value Charts Indicators measure the relative value of a security, helping traders identify overbought and oversold conditions.
Can these indicators be used together?
Yes, combining TTM Slingshot and Value Charts Indicators provides a comprehensive analysis of market trends and security value.
Which platforms support these indicators?
Platforms like Thinkorswim, TradeStation, NinjaTrader, and MetaTrader support TTM Slingshot and Value Charts Indicators.
How do I install these indicators?
Download the respective indicator files, open your trading platform, and add the indicators through the ‘Indicators’ section.
Be the first to review “TTM Slingshot & Value Charts Indicators”
You must be logged in to post a review.
Related products
Original price was: $997.00.$8.00Current price is: $8.00.
Original price was: $1,849.00.$15.00Current price is: $15.00.
Forex Trading
Original price was: $397.00.$31.00Current price is: $31.00.
Original price was: $4,995.00.$15.00Current price is: $15.00.
Original price was: $695.00.$41.00Current price is: $41.00.
Forex Trading
Original price was: $499.00.$15.00Current price is: $15.00.
Forex Trading
Original price was: $850.00.$23.00Current price is: $23.00.
Original price was: $999.00.$5.00Current price is: $5.00.
Forex Trading
Original price was: $999.00.$15.00Current price is: $15.00.

Forex Trading
Quantamentals – The Next Great Forefront Of Trading and Investing with Trading Markets
Original price was: $1,495.00.$8.00Current price is: $8.00.

Forex Trading
Original price was: $1,098.00.$39.00Current price is: $39.00.

Original price was: $649.00.$20.00Current price is: $20.00.
Forex Trading
Original price was: $125.00.$17.00Current price is: $17.00.
Original price was: $997.00.$13.00Current price is: $13.00.
Forex Trading
Original price was: $239.00.$8.00Current price is: $8.00.

Forex Trading
Original price was: $500.00.$5.00Current price is: $5.00.
Original price was: $197.00.$5.00Current price is: $5.00.
Original price was: $895.00.$15.00Current price is: $15.00.

Original price was: $2,120.00.$15.00Current price is: $15.00.
Forex Trading
Original price was: $2,997.00.$23.00Current price is: $23.00.

Reviews
There are no reviews yet.