-
×
 Weekly Power Options Strategies
1 × $6.00
Weekly Power Options Strategies
1 × $6.00 -
×
 Brian James Sklenka Package
1 × $31.00
Brian James Sklenka Package
1 × $31.00 -
×
 Member Only Videos with Henry W Steele
1 × $27.00
Member Only Videos with Henry W Steele
1 × $27.00 -
×
 Time, Price & Pattern with John Crane
1 × $6.00
Time, Price & Pattern with John Crane
1 × $6.00 -
×
 Master Class: Income Trading with Option Pit
1 × $101.00
Master Class: Income Trading with Option Pit
1 × $101.00 -
×
 SQX Mentorship with Tip Toe Hippo
1 × $23.00
SQX Mentorship with Tip Toe Hippo
1 × $23.00 -
×
 Crypto Trading Academy with Cheeky Investor - Aussie Day Trader
1 × $13.00
Crypto Trading Academy with Cheeky Investor - Aussie Day Trader
1 × $13.00 -
×
 0 DTE Options Trading Workshop with Aeromir Corporation
1 × $15.00
0 DTE Options Trading Workshop with Aeromir Corporation
1 × $15.00 -
×
 Deep Dive Butterfly Trading Strategy Class with SJG Trades
1 × $41.00
Deep Dive Butterfly Trading Strategy Class with SJG Trades
1 × $41.00 -
×
 iMF Tracker – Order Flow Program 2023
1 × $5.00
iMF Tracker – Order Flow Program 2023
1 × $5.00 -
×
 Butterfly and Condor Workshop with Aeromir
1 × $15.00
Butterfly and Condor Workshop with Aeromir
1 × $15.00 -
×
 WondaFX Signature Strategy with WondaFX
1 × $5.00
WondaFX Signature Strategy with WondaFX
1 × $5.00 -
×
 The Science of Trading with Mark Boucher
1 × $6.00
The Science of Trading with Mark Boucher
1 × $6.00 -
×
 Developing Profitable Systems from Discretionary to Mechanical with Fred Shutzman
1 × $6.00
Developing Profitable Systems from Discretionary to Mechanical with Fred Shutzman
1 × $6.00 -
×
 Volume Analysis – Smart Money
1 × $6.00
Volume Analysis – Smart Money
1 × $6.00 -
×
 IBD Advanced Buying Strategies Home Study Program
1 × $10.00
IBD Advanced Buying Strategies Home Study Program
1 × $10.00 -
×
 Use the News with Maria Bartiromo
1 × $6.00
Use the News with Maria Bartiromo
1 × $6.00 -
×
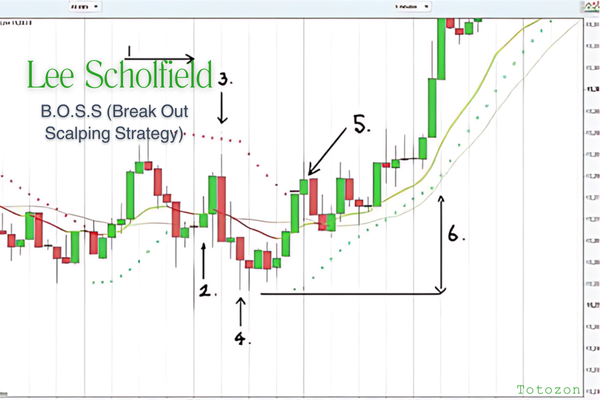 B.O.S.S (Break Out Scalping Strategy) with Lee Scholfield
1 × $6.00
B.O.S.S (Break Out Scalping Strategy) with Lee Scholfield
1 × $6.00 -
×
 AI For Traders with Trading Markets
1 × $31.00
AI For Traders with Trading Markets
1 × $31.00 -
×
 Matrix Spread Options Trading Course with Base Camp Trading
1 × $31.00
Matrix Spread Options Trading Course with Base Camp Trading
1 × $31.00 -
×
 King Zulfan Academy – Course with Malaysian Trader
1 × $5.00
King Zulfan Academy – Course with Malaysian Trader
1 × $5.00 -
×
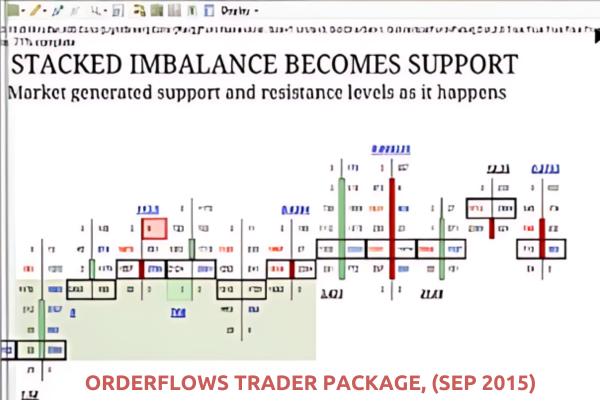 OrderFlows Trader Package, (Sep 2015)
1 × $54.00
OrderFlows Trader Package, (Sep 2015)
1 × $54.00 -
×
 The Top Tier Pro System Basic with Raghee Horner
1 × $41.00
The Top Tier Pro System Basic with Raghee Horner
1 × $41.00 -
×
 Peter Borish Online Trader Program
1 × $15.00
Peter Borish Online Trader Program
1 × $15.00 -
×
 Backtrade Marathon NEW with Real Life Trading
1 × $23.00
Backtrade Marathon NEW with Real Life Trading
1 × $23.00 -
×
 Options Trading & Ultimate MasterClass With Tyrone Abela - FX Evolution
1 × $54.00
Options Trading & Ultimate MasterClass With Tyrone Abela - FX Evolution
1 × $54.00 -
×
 The Python for Traders Masterclass with Mr James
1 × $10.00
The Python for Traders Masterclass with Mr James
1 × $10.00 -
×
 Power Charting - Robert’s Indicator Webinar
1 × $6.00
Power Charting - Robert’s Indicator Webinar
1 × $6.00 -
×
 ApexFX Pro
1 × $5.00
ApexFX Pro
1 × $5.00 -
×
 Mastering High Probability Chart Reading Methods with John Murphy
1 × $6.00
Mastering High Probability Chart Reading Methods with John Murphy
1 × $6.00 -
×
 XLT– Option Trading Course
1 × $6.00
XLT– Option Trading Course
1 × $6.00 -
×
 Analysis Of Entry Signals Part Two (Fundamentals) with Joe Marwood
1 × $23.00
Analysis Of Entry Signals Part Two (Fundamentals) with Joe Marwood
1 × $23.00 -
×
 W. D Gann 's Square Of 9 Applied To Modern Markets with Sean Avidar - Hexatrade350
1 × $23.00
W. D Gann 's Square Of 9 Applied To Modern Markets with Sean Avidar - Hexatrade350
1 × $23.00 -
×
 The Ones That know
1 × $41.00
The Ones That know
1 × $41.00 -
×
 Using Robert’s Indicators with Rob Hoffman
1 × $6.00
Using Robert’s Indicators with Rob Hoffman
1 × $6.00 -
×
 Gillen Predicts with Jack Gillen
1 × $6.00
Gillen Predicts with Jack Gillen
1 × $6.00 -
×
 Technical Analysis By JC Parets - Investopedia Academy
1 × $15.00
Technical Analysis By JC Parets - Investopedia Academy
1 × $15.00 -
×
 The Power of Position Sizing Strategies SQN Secrets Revealed with Van Tharp
1 × $5.00
The Power of Position Sizing Strategies SQN Secrets Revealed with Van Tharp
1 × $5.00 -
×
 TLM Virtual Trading Summit 2021 with TradeLikeMike
1 × $6.00
TLM Virtual Trading Summit 2021 with TradeLikeMike
1 × $6.00 -
×
 Low Timeframe Supply & Demand with RROP
1 × $5.00
Low Timeframe Supply & Demand with RROP
1 × $5.00 -
×
 The Psychology of the Foreign Exchange Market with Thomas Oberlechner
1 × $6.00
The Psychology of the Foreign Exchange Market with Thomas Oberlechner
1 × $6.00 -
×
 We Fund Traders - The Whale Order
1 × $5.00
We Fund Traders - The Whale Order
1 × $5.00 -
×
 Best of the Best: Collars with Amy Meissner & Scott Ruble
1 × $15.00
Best of the Best: Collars with Amy Meissner & Scott Ruble
1 × $15.00 -
×
 Trade Setups And Strategies Program with The Daytrading Room
1 × $23.00
Trade Setups And Strategies Program with The Daytrading Room
1 × $23.00 -
×
 The Orderflow Masterclass with PrimeTrading
1 × $17.00
The Orderflow Masterclass with PrimeTrading
1 × $17.00 -
×
 Accelerated Learning Techniques in Action with Colin Rose, Jayne Nicholl & Malcolm Nicholl
1 × $6.00
Accelerated Learning Techniques in Action with Colin Rose, Jayne Nicholl & Malcolm Nicholl
1 × $6.00 -
×
 Back to the Future – Schabacker’s Principles with Linda Raschke
1 × $6.00
Back to the Future – Schabacker’s Principles with Linda Raschke
1 × $6.00 -
×
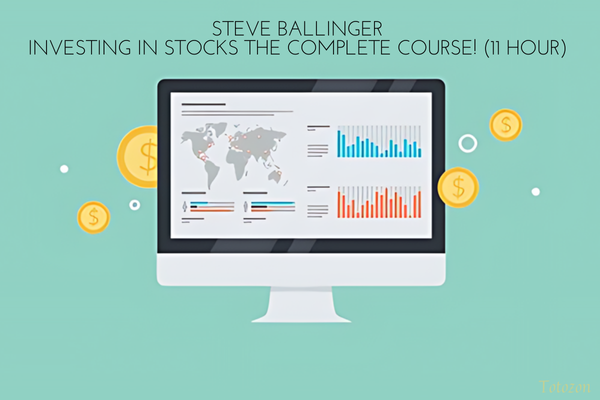 Investing In Stocks The Complete Course! (11 Hour) with Steve Ballinger
1 × $6.00
Investing In Stocks The Complete Course! (11 Hour) with Steve Ballinger
1 × $6.00 -
×
 Scalpathon by Trading Research Group
1 × $23.00
Scalpathon by Trading Research Group
1 × $23.00 -
×
 Learn To Day-Trade the E-Mini S&P 500. Simple-as-123 with Marshall Jones
1 × $6.00
Learn To Day-Trade the E-Mini S&P 500. Simple-as-123 with Marshall Jones
1 × $6.00 -
×
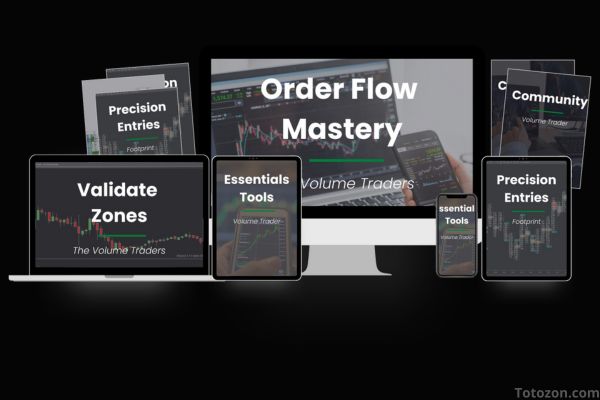 Order Flow Mastery (New 2024) with The Volume Traders
1 × $24.00
Order Flow Mastery (New 2024) with The Volume Traders
1 × $24.00 -
×
 You can be a Stock Market Genious with Joel Greenblaat
1 × $6.00
You can be a Stock Market Genious with Joel Greenblaat
1 × $6.00 -
×
 Crystal Ball Pack PLUS bonus Live Trade By Pat Mitchell - Trick Trades
1 × $20.00
Crystal Ball Pack PLUS bonus Live Trade By Pat Mitchell - Trick Trades
1 × $20.00 -
×
 Algo Wizard Essentials Course with Srategy Quant
1 × $13.00
Algo Wizard Essentials Course with Srategy Quant
1 × $13.00 -
×
 The Introduction to the Magee System of Technical Analysis CD with John Magee
1 × $6.00
The Introduction to the Magee System of Technical Analysis CD with John Magee
1 × $6.00 -
×
 Encyclopedia of Planetary Aspects for Short Term TradingPatrick Mikula – Encyclopedia of Planetary Aspects for Short Term Trading
1 × $4.00
Encyclopedia of Planetary Aspects for Short Term TradingPatrick Mikula – Encyclopedia of Planetary Aspects for Short Term Trading
1 × $4.00 -
×
 5 Part Daytrading Course with Kevin Haggerty
1 × $6.00
5 Part Daytrading Course with Kevin Haggerty
1 × $6.00 -
×
 Altcoin Investing Course with Rekt Capital
1 × $5.00
Altcoin Investing Course with Rekt Capital
1 × $5.00 -
×
 ZipTraderU 2023 with ZipTrader
1 × $5.00
ZipTraderU 2023 with ZipTrader
1 × $5.00 -
×
 Advanced Bond Trading Course
1 × $62.00
Advanced Bond Trading Course
1 × $62.00 -
×
 The Ten Most Powerful Option Trading Secrets with Bernie Schaeffer
1 × $6.00
The Ten Most Powerful Option Trading Secrets with Bernie Schaeffer
1 × $6.00 -
×
 The Orderflows Trade Opportunities Encyclopedia with Michael Valtos
1 × $8.00
The Orderflows Trade Opportunities Encyclopedia with Michael Valtos
1 × $8.00 -
×
 Zero to Hero Course with EVO Capital
1 × $13.00
Zero to Hero Course with EVO Capital
1 × $13.00 -
×
 Investors Live Textbook Trading DVD
1 × $15.00
Investors Live Textbook Trading DVD
1 × $15.00 -
×
 S&P Reloaded System with Ryan Jones
1 × $4.00
S&P Reloaded System with Ryan Jones
1 × $4.00 -
×
 Trading Course 2024 with ZMC x BMO
1 × $17.00
Trading Course 2024 with ZMC x BMO
1 × $17.00 -
×
 TrimTabs Investing with Charles Biderman & David Santschi
1 × $6.00
TrimTabs Investing with Charles Biderman & David Santschi
1 × $6.00 -
×
 Vom Einsteiger zum Mastertrader 2.0 with Mehrwert Garantier
1 × $109.00
Vom Einsteiger zum Mastertrader 2.0 with Mehrwert Garantier
1 × $109.00 -
×
 Wyckoff Analytics Courses Collection
1 × $27.00
Wyckoff Analytics Courses Collection
1 × $27.00 -
×
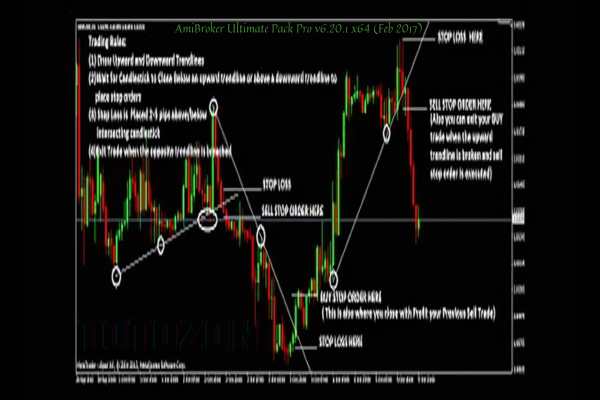 AmiBroker Ultimate Pack Pro v6.20.1 x64 (Feb 2017)
1 × $6.00
AmiBroker Ultimate Pack Pro v6.20.1 x64 (Feb 2017)
1 × $6.00 -
×
 Cobra (aka Viper Crude)
1 × $23.00
Cobra (aka Viper Crude)
1 × $23.00 -
×
 Trading the E-Minis Successfully For A Living 3 Day with Chris Curran with Chris Curran's Live Web Seminar
1 × $6.00
Trading the E-Minis Successfully For A Living 3 Day with Chris Curran with Chris Curran's Live Web Seminar
1 × $6.00 -
×
 Trading Pivot Points with Andrew Peters
1 × $6.00
Trading Pivot Points with Andrew Peters
1 × $6.00 -
×
 Killmex Academy Education Course
1 × $5.00
Killmex Academy Education Course
1 × $5.00 -
×
 A Day Trading Guide
1 × $54.00
A Day Trading Guide
1 × $54.00 -
×
 Middle Market M & A: Handbook for Investment Banking and Business Consulting (1st Edition) - Kenneth Marks
1 × $6.00
Middle Market M & A: Handbook for Investment Banking and Business Consulting (1st Edition) - Kenneth Marks
1 × $6.00 -
×
 Introduction to Fibonacci Time Analysis with Carolyn Boroden
1 × $6.00
Introduction to Fibonacci Time Analysis with Carolyn Boroden
1 × $6.00 -
×
 Unlocking Wealth: Secret to Market Timing with John Crane
1 × $6.00
Unlocking Wealth: Secret to Market Timing with John Crane
1 × $6.00 -
×
 The Handbook of Alternative Investments with Darrell R.Jobman
1 × $6.00
The Handbook of Alternative Investments with Darrell R.Jobman
1 × $6.00 -
×
 Ask the RiskDoctor Q and A [18 Videos (MP4) + 17 Documents (PDF)] with Charles Cottle (The Risk Doctor)
1 × $6.00
Ask the RiskDoctor Q and A [18 Videos (MP4) + 17 Documents (PDF)] with Charles Cottle (The Risk Doctor)
1 × $6.00 -
×
 Best Trading Strategies Revealed - The Prosperity Trading Course (BTSR)
1 × $78.00
Best Trading Strategies Revealed - The Prosperity Trading Course (BTSR)
1 × $78.00 -
×
 Trading Rules that Work
1 × $6.00
Trading Rules that Work
1 × $6.00 -
×
 Elite Keys to Trading Success Class
1 × $23.00
Elite Keys to Trading Success Class
1 × $23.00 -
×
 The Student Guide to Minitab Release 14 with John McKenzie, Robert Goldman
1 × $6.00
The Student Guide to Minitab Release 14 with John McKenzie, Robert Goldman
1 × $6.00 -
×
 The Inner Circle Seminar
1 × $15.00
The Inner Circle Seminar
1 × $15.00 -
×
 Scalp Strategy and Flipping Small Accounts with Opes Trading Group
1 × $5.00
Scalp Strategy and Flipping Small Accounts with Opes Trading Group
1 × $5.00 -
×
 Volatility and Timing with Jay Kaeppel – The Option Trader’s Guide to Probability
1 × $6.00
Volatility and Timing with Jay Kaeppel – The Option Trader’s Guide to Probability
1 × $6.00 -
×
 Trading Indicators for the 21st Century
1 × $6.00
Trading Indicators for the 21st Century
1 × $6.00 -
×
 Using Fundamental Analysis with Andrew Baxter
1 × $6.00
Using Fundamental Analysis with Andrew Baxter
1 × $6.00 -
×
 Wyckoff Stock Market Institute
1 × $5.00
Wyckoff Stock Market Institute
1 × $5.00 -
×
 Directional Option Strategies for Swing and Day Trading with Dan Gibby - Master Trader
1 × $54.00
Directional Option Strategies for Swing and Day Trading with Dan Gibby - Master Trader
1 × $54.00 -
×
 TradeGuider Education Package
1 × $54.00
TradeGuider Education Package
1 × $54.00

TTM Slingshot & Value Charts Indicators
$6.00
File Size: Coming soon!
Delivery Time: 1–12 hours
Media Type: Online Course
TTM Slingshot & Value Charts Indicators
Introduction to TTM Slingshot & Value Charts
In the dynamic world of trading, having the right tools can make all the difference. Two such powerful tools are the TTM Slingshot and Value Charts Indicators. These indicators provide traders with crucial insights, helping them navigate market complexities and make informed decisions.
Understanding TTM Slingshot
What is TTM Slingshot?
The TTM Slingshot is an advanced trading indicator developed by John Carter. It combines multiple moving averages to identify potential breakout points in the market. By analyzing the relationship between these moving averages, the TTM Slingshot helps traders spot opportunities for entering or exiting trades.
Key Features of TTM Slingshot
- Multiple Moving Averages: Uses short-term and long-term moving averages.
- Breakout Identification: Detects potential breakout points.
- Versatility: Applicable across various markets and timeframes.
Benefits of Using TTM Slingshot
Enhanced Market Analysis
The TTM Slingshot provides a detailed analysis of market trends, allowing traders to anticipate significant price movements. This indicator’s ability to pinpoint breakout points is invaluable for making timely trading decisions.
Improved Trading Accuracy
By combining multiple moving averages, the TTM Slingshot offers a comprehensive view of the market. This integration reduces noise and enhances the accuracy of predictions, leading to more successful trades.
Setting Up TTM Slingshot
Choosing the Right Platform
To utilize the TTM Slingshot, you’ll need a trading platform that supports custom indicators. Platforms like Thinkorswim and TradeStation are popular choices among traders.
Installing the Indicator
- Download the Indicator: Obtain the TTM Slingshot file compatible with your trading platform.
- Open Your Platform: Launch the trading platform.
- Add the Indicator: Navigate to the ‘Indicators’ section and add the TTM Slingshot file.
- Customize Settings: Adjust the settings to align with your trading strategy.
Understanding Value Charts Indicators
What are Value Charts Indicators?
Value Charts Indicators are tools that measure the relative value of a security based on its price history. These indicators help traders determine whether a security is overvalued, undervalued, or fairly valued, providing a clear picture of potential trading opportunities.
Key Features of Value Charts Indicators
- Relative Value Measurement: Assesses the value of a security.
- Overbought/Oversold Conditions: Identifies extreme market conditions.
- Visual Representation: Displays value levels on a chart for easy interpretation.
Benefits of Using Value Charts Indicators
Identifying Market Extremes
Value Charts Indicators are excellent for spotting overbought and oversold conditions. By identifying these extremes, traders can make strategic decisions about entering or exiting positions.
Enhancing Risk Management
These indicators aid in risk management by providing insights into the relative value of a security. Traders can use this information to set stop-loss levels and protect their investments.
Setting Up Value Charts Indicators
Selecting the Appropriate Platform
Choose a trading platform that supports Value Charts Indicators. Many modern trading platforms, such as NinjaTrader and MetaTrader, offer these indicators.
Installing the Indicator
- Download the Indicator: Obtain the Value Charts Indicator file for your platform.
- Open Your Platform: Start the trading platform.
- Add the Indicator: Go to the ‘Indicators’ section and add the Value Charts file.
- Configure Settings: Customize the settings to fit your trading approach.
How to Use TTM Slingshot & Value Charts Together
Combining Indicators for Better Insights
Using TTM Slingshot and Value Charts Indicators together can enhance your market analysis. While TTM Slingshot identifies breakout points, Value Charts Indicators help assess the relative value of the security, providing a more comprehensive view.
Practical Application
- Entry Points: Use TTM Slingshot to identify breakout points and confirm with Value Charts Indicators to ensure the security is not overvalued.
- Exit Points: Value Charts Indicators can signal overbought conditions, indicating a good time to exit, while TTM Slingshot confirms the end of a trend.
Advanced Strategies with TTM Slingshot & Value Charts
Pairing with Other Indicators
For even more robust analysis, pair TTM Slingshot and Value Charts Indicators with other tools such as RSI (Relative Strength Index) and MACD (Moving Average Convergence Divergence).
Developing a Trading Plan
Create a detailed trading plan that incorporates these indicators. Define your entry and exit points, risk management strategies, and the specific market conditions you’re targeting.
Real-Life Examples
Successful Trade Case Study
Consider a scenario where the TTM Slingshot indicates a breakout, and Value Charts Indicators show the security is undervalued. Entering a trade at this point could lead to significant profits as the price moves to its fair value.
Learning from Mistakes
Analyze trades where the indicators did not predict the expected outcome. Understanding these failures can help refine your strategy and improve future performance.
Conclusion
Maximizing Your Trading Success
The TTM Slingshot and Value Charts Indicators are powerful tools that, when used together, can significantly enhance your trading strategy. By providing insights into market trends and relative value, these indicators help you make more informed decisions.
Taking the Next Step
Start by setting up these indicators on your trading platform. Practice interpreting the signals and integrating them into your trading strategy to see the benefits firsthand.

FAQs
What is the TTM Slingshot indicator?
The TTM Slingshot is a trading tool that uses multiple moving averages to identify breakout points in the market.
How do Value Charts Indicators work?
Value Charts Indicators measure the relative value of a security, helping traders identify overbought and oversold conditions.
Can these indicators be used together?
Yes, combining TTM Slingshot and Value Charts Indicators provides a comprehensive analysis of market trends and security value.
Which platforms support these indicators?
Platforms like Thinkorswim, TradeStation, NinjaTrader, and MetaTrader support TTM Slingshot and Value Charts Indicators.
How do I install these indicators?
Download the respective indicator files, open your trading platform, and add the indicators through the ‘Indicators’ section.
Be the first to review “TTM Slingshot & Value Charts Indicators”
You must be logged in to post a review.
Related products

Forex Trading
Original price was: $1,098.00.$39.00Current price is: $39.00.
Original price was: $139.00.$23.00Current price is: $23.00.

Original price was: $1,849.00.$15.00Current price is: $15.00.
Original price was: $997.00.$13.00Current price is: $13.00.

Original price was: $2,120.00.$15.00Current price is: $15.00.

Forex Trading
The Complete Guide to Multiple Time Frame Analysis & Reading Price Action with Aiman Almansoori
Original price was: $1,399.00.$13.00Current price is: $13.00.

Original price was: $197.00.$5.00Current price is: $5.00.
Forex Trading
Original price was: $1,898.00.$10.00Current price is: $10.00.

Forex Trading
Original price was: $239.00.$8.00Current price is: $8.00.

Forex Trading
Original price was: $4,997.00.$27.00Current price is: $27.00.

Forex Trading
Original price was: $397.00.$31.00Current price is: $31.00.

Original price was: $310.00.$23.00Current price is: $23.00.
Original price was: $649.00.$20.00Current price is: $20.00.
Original price was: $799.00.$15.00Current price is: $15.00.

Forex Trading
Original price was: $249.00.$15.00Current price is: $15.00.
Forex Trading
Original price was: $125.00.$17.00Current price is: $17.00.

Original price was: $1,200.00.$23.00Current price is: $23.00.

Original price was: $497.00.$11.00Current price is: $11.00.
Forex Trading
Original price was: $2,995.00.$31.00Current price is: $31.00.

Original price was: $997.00.$8.00Current price is: $8.00.

Reviews
There are no reviews yet.