-
×
 The Complete Guide to Multiple Time Frame Analysis & Reading Price Action with Aiman Almansoori
1 × $13.00
The Complete Guide to Multiple Time Frame Analysis & Reading Price Action with Aiman Almansoori
1 × $13.00 -
×
 The Orderflows Trade Opportunities Encyclopedia with Michael Valtos
1 × $8.00
The Orderflows Trade Opportunities Encyclopedia with Michael Valtos
1 × $8.00 -
×
 Butterfly and Condor Workshop with Aeromir
1 × $15.00
Butterfly and Condor Workshop with Aeromir
1 × $15.00 -
×
 Tick Trader Bundle with Top Trade Tools
1 × $54.00
Tick Trader Bundle with Top Trade Tools
1 × $54.00 -
×
 The Prop Trading Code with Brannigan Barrett - Axia Futures
1 × $23.00
The Prop Trading Code with Brannigan Barrett - Axia Futures
1 × $23.00 -
×
 The A14 Weekly Option Strategy Workshop with Amy Meissner
1 × $23.00
The A14 Weekly Option Strategy Workshop with Amy Meissner
1 × $23.00 -
×
 Beat the Market with Edward O.Thorp
1 × $6.00
Beat the Market with Edward O.Thorp
1 × $6.00 -
×
 Market Trader Forecasting Modeling Course
1 × $6.00
Market Trader Forecasting Modeling Course
1 × $6.00 -
×
 Options on Futures Trading Course
1 × $15.00
Options on Futures Trading Course
1 × $15.00 -
×
 Compass Trading System with Right Line Trading
1 × $39.00
Compass Trading System with Right Line Trading
1 × $39.00 -
×
 The Trading Blueprint with Brad Goh - The Trading Geek
1 × $5.00
The Trading Blueprint with Brad Goh - The Trading Geek
1 × $5.00 -
×
 WondaFX Signature Strategy with WondaFX
1 × $5.00
WondaFX Signature Strategy with WondaFX
1 × $5.00 -
×
 Algo Trading Masterclass with Ali Casey - StatOasis
1 × $23.00
Algo Trading Masterclass with Ali Casey - StatOasis
1 × $23.00 -
×
 Gaining Option Leverage: Using Market Makers Tactics with Jon Najarian
1 × $4.00
Gaining Option Leverage: Using Market Makers Tactics with Jon Najarian
1 × $4.00 -
×
 Day Trading Systems & Methods with Charles Le Beau, David Lucas
1 × $6.00
Day Trading Systems & Methods with Charles Le Beau, David Lucas
1 × $6.00 -
×
 Andy’s EMini Bar – 40 Min System with Joe Ross
1 × $6.00
Andy’s EMini Bar – 40 Min System with Joe Ross
1 × $6.00 -
×
 Quick Scalp Trader (Unlocked)
1 × $31.00
Quick Scalp Trader (Unlocked)
1 × $31.00 -
×
 6 Dynamic Trader Real Time and End Of Day
1 × $39.00
6 Dynamic Trader Real Time and End Of Day
1 × $39.00 -
×
 Quantamentals - The Next Great Forefront Of Trading and Investing with Trading Markets
1 × $8.00
Quantamentals - The Next Great Forefront Of Trading and Investing with Trading Markets
1 × $8.00 -
×
 Matrix Spread Options Trading Course with Base Camp Trading
1 × $31.00
Matrix Spread Options Trading Course with Base Camp Trading
1 × $31.00 -
×
 Home Run Options Trading Course with Dave Aquino - Base Camp Trading
1 × $11.00
Home Run Options Trading Course with Dave Aquino - Base Camp Trading
1 × $11.00 -
×
 Derivates with Philip McBride Johnson
1 × $6.00
Derivates with Philip McBride Johnson
1 × $6.00 -
×
 AI For Traders with Trading Markets
1 × $31.00
AI For Traders with Trading Markets
1 × $31.00 -
×
 Survive and Thrive in Extreme Volatility Class with Don Kaufman
1 × $6.00
Survive and Thrive in Extreme Volatility Class with Don Kaufman
1 × $6.00 -
×
 Trading Options as a Professional: Techniques for Market Makers and Experienced Traders with James Bittman
1 × $6.00
Trading Options as a Professional: Techniques for Market Makers and Experienced Traders with James Bittman
1 × $6.00 -
×
 TRADING NFX Course with Andrew NFX
1 × $5.00
TRADING NFX Course with Andrew NFX
1 × $5.00 -
×
 Advanced Spread Trading with Guy Bower - MasterClass Trader
1 × $15.00
Advanced Spread Trading with Guy Bower - MasterClass Trader
1 × $15.00 -
×
 Terry Ashman’s Gann Swings Swing Trading Course (HotTrader Tutorial)
1 × $6.00
Terry Ashman’s Gann Swings Swing Trading Course (HotTrader Tutorial)
1 × $6.00 -
×
 TradeCraft: Your Path to Peak Performance Trading By Adam Grimes
1 × $15.00
TradeCraft: Your Path to Peak Performance Trading By Adam Grimes
1 × $15.00 -
×
 Level 1 - Japanese Candlesticks Trading Mastery Program with Rohit Musale & Rashmi Musale
1 × $5.00
Level 1 - Japanese Candlesticks Trading Mastery Program with Rohit Musale & Rashmi Musale
1 × $5.00 -
×
 John Bollinger on Bollinger Bands
1 × $6.00
John Bollinger on Bollinger Bands
1 × $6.00 -
×
 Bear Trading For Profit Profit From Stock Market Crashes
1 × $6.00
Bear Trading For Profit Profit From Stock Market Crashes
1 × $6.00 -
×
 Essentials in Quantitative Trading QT01 By HangukQuant's
1 × $23.00
Essentials in Quantitative Trading QT01 By HangukQuant's
1 × $23.00 -
×
 How To Read The Market Professionally with TradeSmart
1 × $27.00
How To Read The Market Professionally with TradeSmart
1 × $27.00 -
×
 Best of the Best: Collars with Amy Meissner & Scott Ruble
1 × $15.00
Best of the Best: Collars with Amy Meissner & Scott Ruble
1 × $15.00 -
×
 Kase StatWare 9.7.3
1 × $23.00
Kase StatWare 9.7.3
1 × $23.00 -
×
 Yield Farming MasterClass Course (2022) with Boss Financial
1 × $5.00
Yield Farming MasterClass Course (2022) with Boss Financial
1 × $5.00 -
×
 Forecast 2024 Clarification with Larry Williams
1 × $15.00
Forecast 2024 Clarification with Larry Williams
1 × $15.00 -
×
 Money Management
1 × $6.00
Money Management
1 × $6.00 -
×
 Manage By The Greeks 2016 with Dan Sheridan
1 × $23.00
Manage By The Greeks 2016 with Dan Sheridan
1 × $23.00 -
×
 Day Trading and Swing Trading the Currency Market with Kathy Lien
1 × $6.00
Day Trading and Swing Trading the Currency Market with Kathy Lien
1 × $6.00 -
×
 Bear Market Strategies eLearning Course - Kirk - Van Tharp Institute
1 × $85.00
Bear Market Strategies eLearning Course - Kirk - Van Tharp Institute
1 × $85.00 -
×
 Relentless Trading Course Advanced with Ryan Relentless
1 × $5.00
Relentless Trading Course Advanced with Ryan Relentless
1 × $5.00 -
×
 Indicators & BWT Bar Types for NT7
1 × $139.00
Indicators & BWT Bar Types for NT7
1 × $139.00 -
×
 $20 – 52k 20 pips a day challange with Rafał Zuchowicz - TopMasterTrader
1 × $5.00
$20 – 52k 20 pips a day challange with Rafał Zuchowicz - TopMasterTrader
1 × $5.00 -
×
 Ultimate Trading Course with Dodgy's Dungeon
1 × $8.00
Ultimate Trading Course with Dodgy's Dungeon
1 × $8.00 -
×
 Hustle Trading FX Course
1 × $10.00
Hustle Trading FX Course
1 × $10.00 -
×
 OptioPit Course 2013 (Gold & Silver Course)
1 × $23.00
OptioPit Course 2013 (Gold & Silver Course)
1 × $23.00 -
×
 Advanced Symmetrics Mental Harmonics Course
1 × $15.00
Advanced Symmetrics Mental Harmonics Course
1 × $15.00 -
×
 Generate Weekly Income by Trend-Trading Stocks Intraday Class with Corey Rosenbloom
1 × $6.00
Generate Weekly Income by Trend-Trading Stocks Intraday Class with Corey Rosenbloom
1 × $6.00 -
×
 The Indices Orderflow Masterclass with The Forex Scalpers
1 × $23.00
The Indices Orderflow Masterclass with The Forex Scalpers
1 × $23.00 -
×
 Little Black Book of Scripts
1 × $6.00
Little Black Book of Scripts
1 × $6.00 -
×
 Scalping the Forex
1 × $6.00
Scalping the Forex
1 × $6.00 -
×
 TechnicalProsperity - Red Package
1 × $15.00
TechnicalProsperity - Red Package
1 × $15.00 -
×
 0 DTE Options Trading Workshop with Aeromir Corporation
1 × $15.00
0 DTE Options Trading Workshop with Aeromir Corporation
1 × $15.00 -
×
 The Naked Eye: Raw Data Analytics with Edgar Torres - Raw Data Analytics
1 × $8.00
The Naked Eye: Raw Data Analytics with Edgar Torres - Raw Data Analytics
1 × $8.00 -
×
 Forex and Stocks Trading Course - Set and Forget with Alfonso Moreno
1 × $6.00
Forex and Stocks Trading Course - Set and Forget with Alfonso Moreno
1 × $6.00 -
×
 Renko Mastery with Thomas Wood
1 × $15.00
Renko Mastery with Thomas Wood
1 × $15.00 -
×
 Futures Masterclass with Market Flow Trader
1 × $17.00
Futures Masterclass with Market Flow Trader
1 × $17.00 -
×
 ICT Prodigy Trading Course – $650K in Payouts with Alex Solignani
1 × $15.00
ICT Prodigy Trading Course – $650K in Payouts with Alex Solignani
1 × $15.00 -
×
 High Probability Trading Using Elliott Wave And Fibonacci Analysis withVic Patel - Forex Training Group
1 × $10.00
High Probability Trading Using Elliott Wave And Fibonacci Analysis withVic Patel - Forex Training Group
1 × $10.00 -
×
 Trading Short TermSame Day Trades Sep 2023 with Dan Sheridan & Mark Fenton - Sheridan Options Mentoring
1 × $31.00
Trading Short TermSame Day Trades Sep 2023 with Dan Sheridan & Mark Fenton - Sheridan Options Mentoring
1 × $31.00 -
×
 The Art of Trading Covered Writes [1 video (AVI)]
1 × $15.00
The Art of Trading Covered Writes [1 video (AVI)]
1 × $15.00 -
×
 Volcano Trading with Claytrader
1 × $15.00
Volcano Trading with Claytrader
1 × $15.00 -
×
 Crypto Trading Academy with Cheeky Investor - Aussie Day Trader
1 × $13.00
Crypto Trading Academy with Cheeky Investor - Aussie Day Trader
1 × $13.00 -
×
 All About Technical Analysis with Constance Brown
1 × $6.00
All About Technical Analysis with Constance Brown
1 × $6.00 -
×
 Low Timeframe Supply & Demand with RROP
1 × $5.00
Low Timeframe Supply & Demand with RROP
1 × $5.00 -
×
 Deep Dive Butterfly Trading Strategy Class with SJG Trades
1 × $41.00
Deep Dive Butterfly Trading Strategy Class with SJG Trades
1 × $41.00 -
×
 6-2-4 Winning Strategies & Systems with Jack Bernstein
1 × $6.00
6-2-4 Winning Strategies & Systems with Jack Bernstein
1 × $6.00 -
×
 Trading Spreads and Seasonals (tradingeducators.com)
1 × $6.00
Trading Spreads and Seasonals (tradingeducators.com)
1 × $6.00 -
×
 Stocks, Options & Collars with J.L.Lord
1 × $6.00
Stocks, Options & Collars with J.L.Lord
1 × $6.00 -
×
 Fear Factor Breakout Trading System with Wbprofittrader
1 × $31.00
Fear Factor Breakout Trading System with Wbprofittrader
1 × $31.00 -
×
 Three Point Reversal Method of Point & Figure Stock Market Trading with A.W.Cohen
1 × $6.00
Three Point Reversal Method of Point & Figure Stock Market Trading with A.W.Cohen
1 × $6.00 -
×
 How To Trade Like a Pro, Not a Hobby with Jason Bond
1 × $62.00
How To Trade Like a Pro, Not a Hobby with Jason Bond
1 × $62.00 -
×
 Backspreads, Diagonals and Butterflies – Advanced Options Strategies
1 × $6.00
Backspreads, Diagonals and Butterflies – Advanced Options Strategies
1 × $6.00 -
×
 Confessions of a Pit Trader 2003 with Rick Burgess
1 × $6.00
Confessions of a Pit Trader 2003 with Rick Burgess
1 × $6.00 -
×
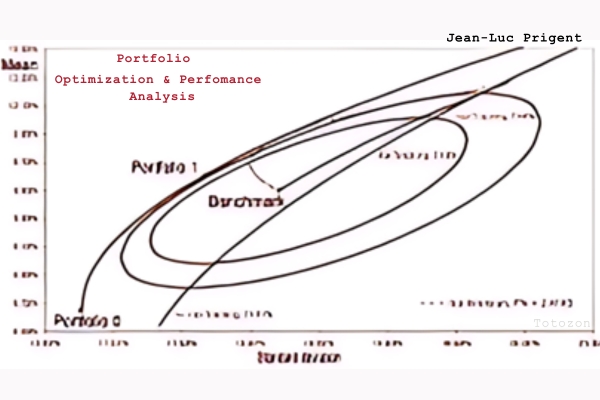 Portfolio Optimization & Perfomance Analysis with Jean-Luc Prigent
1 × $6.00
Portfolio Optimization & Perfomance Analysis with Jean-Luc Prigent
1 × $6.00 -
×
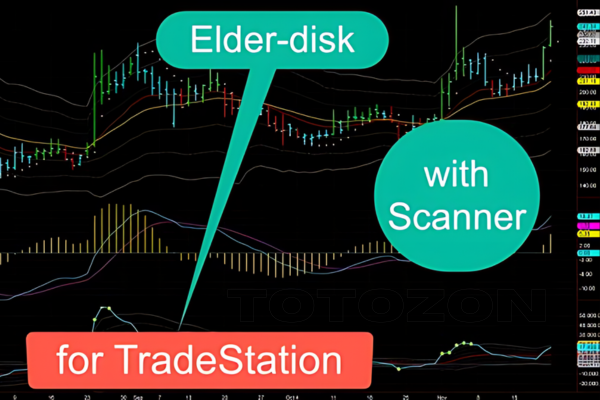 Elder-disk for TradeStation, enhanced with a MACD scanner
1 × $54.00
Elder-disk for TradeStation, enhanced with a MACD scanner
1 × $54.00 -
×
 Freak Forex Technicals with Ken FX Freak
1 × $6.00
Freak Forex Technicals with Ken FX Freak
1 × $6.00 -
×
 Applied Portfolio Management with Catherine Shenoy
1 × $6.00
Applied Portfolio Management with Catherine Shenoy
1 × $6.00 -
×
 Introduction to Fibonacci Time Analysis with Carolyn Boroden
1 × $6.00
Introduction to Fibonacci Time Analysis with Carolyn Boroden
1 × $6.00 -
×
 White Phoenix’s The Smart (Money) Approach to Trading with Jayson Casper
1 × $39.00
White Phoenix’s The Smart (Money) Approach to Trading with Jayson Casper
1 × $39.00 -
×
 Diamonetrics For The Novice & Professional By Charles Cottle
1 × $4.00
Diamonetrics For The Novice & Professional By Charles Cottle
1 × $4.00 -
×
 The Introduction to the Magee System of Technical Analysis CD with John Magee
1 × $6.00
The Introduction to the Magee System of Technical Analysis CD with John Magee
1 × $6.00 -
×
 www Trading System Ezine with Alex Krzhechevsky
1 × $6.00
www Trading System Ezine with Alex Krzhechevsky
1 × $6.00 -
×
 Astro-Cycles and Speculative Markets with L.J.Jensen
1 × $6.00
Astro-Cycles and Speculative Markets with L.J.Jensen
1 × $6.00 -
×
 Harmonic Multi-Patterns with Scan Watchlist for Thinkorswim and Mobile
1 × $6.00
Harmonic Multi-Patterns with Scan Watchlist for Thinkorswim and Mobile
1 × $6.00 -
×
 Monthly Mastermind
1 × $6.00
Monthly Mastermind
1 × $6.00 -
×
 Turtle Soup Course with ICT Trader Romeo
1 × $5.00
Turtle Soup Course with ICT Trader Romeo
1 × $5.00 -
×
 Trading Calendar Spreads with Option Pit
1 × $39.00
Trading Calendar Spreads with Option Pit
1 × $39.00 -
×
 GMB Master Academy
1 × $31.00
GMB Master Academy
1 × $31.00 -
×
 Ambush Trading Method on Wheat & Corn with Marco Mayer
1 × $4.00
Ambush Trading Method on Wheat & Corn with Marco Mayer
1 × $4.00 -
×
 All Weather Butterfly Program - A Deep Dive With Dan Sheridan
1 × $31.00
All Weather Butterfly Program - A Deep Dive With Dan Sheridan
1 × $31.00 -
×
 Increasing Vertical Spread Probabilities With Technical Analysis Class with Doc Severso
1 × $6.00
Increasing Vertical Spread Probabilities With Technical Analysis Class with Doc Severso
1 × $6.00 -
×
 Fundamentals of Forex Trading with Joshua Garrison
1 × $5.00
Fundamentals of Forex Trading with Joshua Garrison
1 × $5.00 -
×
 A Day Trading Guide
1 × $54.00
A Day Trading Guide
1 × $54.00 -
×
 Forex Patterns and Probabilities: Trading Strategies for Trending and Range-Bound Markets with Ed Ponsi
1 × $6.00
Forex Patterns and Probabilities: Trading Strategies for Trending and Range-Bound Markets with Ed Ponsi
1 × $6.00 -
×
 Order flow self-study training program with iMFtracker
1 × $10.00
Order flow self-study training program with iMFtracker
1 × $10.00 -
×
 Professional Trader Training Programme with Jarrat Davis
1 × $39.00
Professional Trader Training Programme with Jarrat Davis
1 × $39.00 -
×
 The Day Trader’s Course with Lewis Borsellino
1 × $6.00
The Day Trader’s Course with Lewis Borsellino
1 × $6.00 -
×
 Intermediate to Advance Trading Strategies
1 × $6.00
Intermediate to Advance Trading Strategies
1 × $6.00 -
×
 Scalp Strategy and Flipping Small Accounts with Opes Trading Group
1 × $5.00
Scalp Strategy and Flipping Small Accounts with Opes Trading Group
1 × $5.00

TTM Slingshot & Value Charts Indicators
$6.00
File Size: Coming soon!
Delivery Time: 1–12 hours
Media Type: Online Course
TTM Slingshot & Value Charts Indicators
Introduction to TTM Slingshot & Value Charts
In the dynamic world of trading, having the right tools can make all the difference. Two such powerful tools are the TTM Slingshot and Value Charts Indicators. These indicators provide traders with crucial insights, helping them navigate market complexities and make informed decisions.
Understanding TTM Slingshot
What is TTM Slingshot?
The TTM Slingshot is an advanced trading indicator developed by John Carter. It combines multiple moving averages to identify potential breakout points in the market. By analyzing the relationship between these moving averages, the TTM Slingshot helps traders spot opportunities for entering or exiting trades.
Key Features of TTM Slingshot
- Multiple Moving Averages: Uses short-term and long-term moving averages.
- Breakout Identification: Detects potential breakout points.
- Versatility: Applicable across various markets and timeframes.
Benefits of Using TTM Slingshot
Enhanced Market Analysis
The TTM Slingshot provides a detailed analysis of market trends, allowing traders to anticipate significant price movements. This indicator’s ability to pinpoint breakout points is invaluable for making timely trading decisions.
Improved Trading Accuracy
By combining multiple moving averages, the TTM Slingshot offers a comprehensive view of the market. This integration reduces noise and enhances the accuracy of predictions, leading to more successful trades.
Setting Up TTM Slingshot
Choosing the Right Platform
To utilize the TTM Slingshot, you’ll need a trading platform that supports custom indicators. Platforms like Thinkorswim and TradeStation are popular choices among traders.
Installing the Indicator
- Download the Indicator: Obtain the TTM Slingshot file compatible with your trading platform.
- Open Your Platform: Launch the trading platform.
- Add the Indicator: Navigate to the ‘Indicators’ section and add the TTM Slingshot file.
- Customize Settings: Adjust the settings to align with your trading strategy.
Understanding Value Charts Indicators
What are Value Charts Indicators?
Value Charts Indicators are tools that measure the relative value of a security based on its price history. These indicators help traders determine whether a security is overvalued, undervalued, or fairly valued, providing a clear picture of potential trading opportunities.
Key Features of Value Charts Indicators
- Relative Value Measurement: Assesses the value of a security.
- Overbought/Oversold Conditions: Identifies extreme market conditions.
- Visual Representation: Displays value levels on a chart for easy interpretation.
Benefits of Using Value Charts Indicators
Identifying Market Extremes
Value Charts Indicators are excellent for spotting overbought and oversold conditions. By identifying these extremes, traders can make strategic decisions about entering or exiting positions.
Enhancing Risk Management
These indicators aid in risk management by providing insights into the relative value of a security. Traders can use this information to set stop-loss levels and protect their investments.
Setting Up Value Charts Indicators
Selecting the Appropriate Platform
Choose a trading platform that supports Value Charts Indicators. Many modern trading platforms, such as NinjaTrader and MetaTrader, offer these indicators.
Installing the Indicator
- Download the Indicator: Obtain the Value Charts Indicator file for your platform.
- Open Your Platform: Start the trading platform.
- Add the Indicator: Go to the ‘Indicators’ section and add the Value Charts file.
- Configure Settings: Customize the settings to fit your trading approach.
How to Use TTM Slingshot & Value Charts Together
Combining Indicators for Better Insights
Using TTM Slingshot and Value Charts Indicators together can enhance your market analysis. While TTM Slingshot identifies breakout points, Value Charts Indicators help assess the relative value of the security, providing a more comprehensive view.
Practical Application
- Entry Points: Use TTM Slingshot to identify breakout points and confirm with Value Charts Indicators to ensure the security is not overvalued.
- Exit Points: Value Charts Indicators can signal overbought conditions, indicating a good time to exit, while TTM Slingshot confirms the end of a trend.
Advanced Strategies with TTM Slingshot & Value Charts
Pairing with Other Indicators
For even more robust analysis, pair TTM Slingshot and Value Charts Indicators with other tools such as RSI (Relative Strength Index) and MACD (Moving Average Convergence Divergence).
Developing a Trading Plan
Create a detailed trading plan that incorporates these indicators. Define your entry and exit points, risk management strategies, and the specific market conditions you’re targeting.
Real-Life Examples
Successful Trade Case Study
Consider a scenario where the TTM Slingshot indicates a breakout, and Value Charts Indicators show the security is undervalued. Entering a trade at this point could lead to significant profits as the price moves to its fair value.
Learning from Mistakes
Analyze trades where the indicators did not predict the expected outcome. Understanding these failures can help refine your strategy and improve future performance.
Conclusion
Maximizing Your Trading Success
The TTM Slingshot and Value Charts Indicators are powerful tools that, when used together, can significantly enhance your trading strategy. By providing insights into market trends and relative value, these indicators help you make more informed decisions.
Taking the Next Step
Start by setting up these indicators on your trading platform. Practice interpreting the signals and integrating them into your trading strategy to see the benefits firsthand.

FAQs
What is the TTM Slingshot indicator?
The TTM Slingshot is a trading tool that uses multiple moving averages to identify breakout points in the market.
How do Value Charts Indicators work?
Value Charts Indicators measure the relative value of a security, helping traders identify overbought and oversold conditions.
Can these indicators be used together?
Yes, combining TTM Slingshot and Value Charts Indicators provides a comprehensive analysis of market trends and security value.
Which platforms support these indicators?
Platforms like Thinkorswim, TradeStation, NinjaTrader, and MetaTrader support TTM Slingshot and Value Charts Indicators.
How do I install these indicators?
Download the respective indicator files, open your trading platform, and add the indicators through the ‘Indicators’ section.
Be the first to review “TTM Slingshot & Value Charts Indicators”
You must be logged in to post a review.
Related products
Original price was: $997.00.$8.00Current price is: $8.00.

Original price was: $1,849.00.$15.00Current price is: $15.00.
Original price was: $310.00.$23.00Current price is: $23.00.
Forex Trading
The Complete Guide to Multiple Time Frame Analysis & Reading Price Action with Aiman Almansoori
Original price was: $1,399.00.$13.00Current price is: $13.00.

Forex Trading
Original price was: $499.00.$15.00Current price is: $15.00.
Original price was: $497.00.$11.00Current price is: $11.00.
Original price was: $299.00.$8.00Current price is: $8.00.
Forex Trading
Original price was: $2,995.00.$31.00Current price is: $31.00.
Forex Trading
Original price was: $797.00.$10.00Current price is: $10.00.
Original price was: $999.00.$5.00Current price is: $5.00.
Original price was: $895.00.$15.00Current price is: $15.00.
Forex Trading
Original price was: $850.00.$23.00Current price is: $23.00.
Forex Trading
Original price was: $799.00.$15.00Current price is: $15.00.
Original price was: $700.00.$39.00Current price is: $39.00.

Original price was: $649.00.$20.00Current price is: $20.00.
Forex Trading
Original price was: $397.00.$31.00Current price is: $31.00.

Original price was: $139.00.$23.00Current price is: $23.00.
Forex Trading
Original price was: $4,997.00.$27.00Current price is: $27.00.
Forex Trading
Original price was: $249.00.$15.00Current price is: $15.00.
Forex Trading
Original price was: $1,898.00.$10.00Current price is: $10.00.

Reviews
There are no reviews yet.