-
×
 Crypto Trading Academy with Cheeky Investor - Aussie Day Trader
1 × $13.00
Crypto Trading Academy with Cheeky Investor - Aussie Day Trader
1 × $13.00 -
×
 Best of the Best: Collars with Amy Meissner & Scott Ruble
1 × $15.00
Best of the Best: Collars with Amy Meissner & Scott Ruble
1 × $15.00 -
×
 The Best Option Trading Course with David Jaffee - Best Stock Strategy
1 × $15.00
The Best Option Trading Course with David Jaffee - Best Stock Strategy
1 × $15.00 -
×
 Butterfly and Condor Workshop with Aeromir
1 × $15.00
Butterfly and Condor Workshop with Aeromir
1 × $15.00 -
×
 The Michanics of Futures Trading - Roy Habben
1 × $6.00
The Michanics of Futures Trading - Roy Habben
1 × $6.00 -
×
 Correct Stage for Average with Stan Weinstein
1 × $6.00
Correct Stage for Average with Stan Weinstein
1 × $6.00 -
×
 TRADING NFX Course with Andrew NFX
1 × $5.00
TRADING NFX Course with Andrew NFX
1 × $5.00 -
×
 Cecil Robles Advent Forex Course & Indicators with Adventforex
1 × $6.00
Cecil Robles Advent Forex Course & Indicators with Adventforex
1 × $6.00 -
×
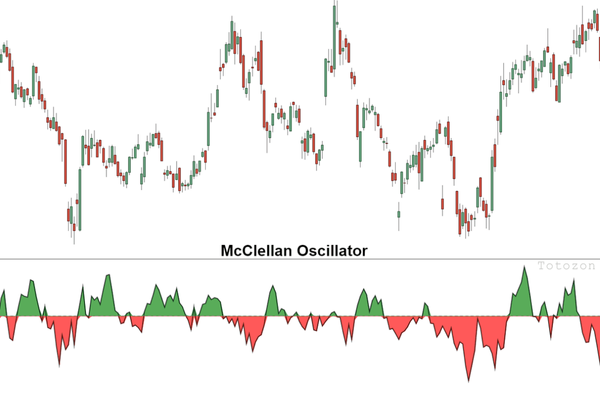 The McClellan Oscillator and Other Tools for with Tom McClellan
1 × $6.00
The McClellan Oscillator and Other Tools for with Tom McClellan
1 × $6.00 -
×
 Basecamptrading - Naked Trading Part 2
1 × $6.00
Basecamptrading - Naked Trading Part 2
1 × $6.00 -
×
 Compound Stock Earnings Advanced Charting (Video 1.19 GB)
1 × $15.00
Compound Stock Earnings Advanced Charting (Video 1.19 GB)
1 × $15.00 -
×
 Trade Execution with Yuri Shramenko
1 × $6.00
Trade Execution with Yuri Shramenko
1 × $6.00 -
×
 Footprint Day Trading Blueprint with Futures Flow
1 × $5.00
Footprint Day Trading Blueprint with Futures Flow
1 × $5.00 -
×
 Essentials in Quantitative Trading QT01 By HangukQuant's
1 × $23.00
Essentials in Quantitative Trading QT01 By HangukQuant's
1 × $23.00 -
×
 5 Week Live Web Seminar (Video & WorkBook ) with Larry Connors
1 × $6.00
5 Week Live Web Seminar (Video & WorkBook ) with Larry Connors
1 × $6.00 -
×
 White Phoenix’s The Smart (Money) Approach to Trading with Jayson Casper
1 × $39.00
White Phoenix’s The Smart (Money) Approach to Trading with Jayson Casper
1 × $39.00 -
×
 The Reducing Risk and Maximizing Returns Blueprint (Atomic Hedge Strategy) with Don Kaufman
1 × $6.00
The Reducing Risk and Maximizing Returns Blueprint (Atomic Hedge Strategy) with Don Kaufman
1 × $6.00 -
×
 The Indices Orderflow Masterclass with The Forex Scalpers
1 × $23.00
The Indices Orderflow Masterclass with The Forex Scalpers
1 × $23.00 -
×
 4 Day Trading Bootcamp
1 × $31.00
4 Day Trading Bootcamp
1 × $31.00 -
×
 Core Strategy Program + Extended Learning Track with Ota Courses
1 × $124.00
Core Strategy Program + Extended Learning Track with Ota Courses
1 × $124.00 -
×
 A Comparison of Twelve Technical Trading Systems with Louis Lukac
1 × $6.00
A Comparison of Twelve Technical Trading Systems with Louis Lukac
1 × $6.00 -
×
 Put Option Strategies for Smarter Trading with Michael Thomsett
1 × $6.00
Put Option Strategies for Smarter Trading with Michael Thomsett
1 × $6.00 -
×
 Stock Detective Investor: Finding Market Gems Online with Kevin Lichtman & Lynn Duke
1 × $6.00
Stock Detective Investor: Finding Market Gems Online with Kevin Lichtman & Lynn Duke
1 × $6.00 -
×
 Better Trading with the Guppy Multiple Moving Average WorkBook with Daryl Guppy
1 × $6.00
Better Trading with the Guppy Multiple Moving Average WorkBook with Daryl Guppy
1 × $6.00 -
×
 High Probability Trading Using Elliott Wave And Fibonacci Analysis withVic Patel - Forex Training Group
1 × $10.00
High Probability Trading Using Elliott Wave And Fibonacci Analysis withVic Patel - Forex Training Group
1 × $10.00 -
×
 Activedaytrader - Elite Earnings Pusuit
1 × $54.00
Activedaytrader - Elite Earnings Pusuit
1 × $54.00 -
×
 Essentials Of Payroll Management & Accounting with Steven M.Bragg
1 × $6.00
Essentials Of Payroll Management & Accounting with Steven M.Bragg
1 × $6.00 -
×
 7 Things You MUST Know about Forex Candlesticks
1 × $4.00
7 Things You MUST Know about Forex Candlesticks
1 × $4.00 -
×
 After Hour Trading Made Easy with Joe Duarte & Roland Burke
1 × $6.00
After Hour Trading Made Easy with Joe Duarte & Roland Burke
1 × $6.00 -
×
 The Complete Guide to Multiple Time Frame Analysis & Reading Price Action with Aiman Almansoori
1 × $13.00
The Complete Guide to Multiple Time Frame Analysis & Reading Price Action with Aiman Almansoori
1 × $13.00 -
×
 Entries & Exits Strategy with The Chart Guys
1 × $6.00
Entries & Exits Strategy with The Chart Guys
1 × $6.00 -
×
 NORMAN HALLETT SIMPLE TRADING PLANS
1 × $31.00
NORMAN HALLETT SIMPLE TRADING PLANS
1 × $31.00 -
×
 Computerized Trading with Mark Jurik
1 × $6.00
Computerized Trading with Mark Jurik
1 × $6.00 -
×
 The Market Matrix
1 × $6.00
The Market Matrix
1 × $6.00 -
×
 Trade Chart Patterns Like The Pros with Suri Duddella
1 × $6.00
Trade Chart Patterns Like The Pros with Suri Duddella
1 × $6.00 -
×
 Options Trading & Ultimate MasterClass With Tyrone Abela - FX Evolution
1 × $54.00
Options Trading & Ultimate MasterClass With Tyrone Abela - FX Evolution
1 × $54.00 -
×
 Home Run Options Trading Course with Dave Aquino - Base Camp Trading
1 × $11.00
Home Run Options Trading Course with Dave Aquino - Base Camp Trading
1 × $11.00 -
×
 The Great Divergence: China, Europe, and the Making of the Modern World Economy with Kenneth Pomeranz
1 × $6.00
The Great Divergence: China, Europe, and the Making of the Modern World Economy with Kenneth Pomeranz
1 × $6.00 -
×
 The Trading Blueprint with Brad Goh - The Trading Geek
1 × $5.00
The Trading Blueprint with Brad Goh - The Trading Geek
1 × $5.00 -
×
 The Holy Grail Forex Strategy - 7 Setups To Conquer The Kingdom with Justin Whitebread-Lanaro - 1 Minute Master
1 × $15.00
The Holy Grail Forex Strategy - 7 Setups To Conquer The Kingdom with Justin Whitebread-Lanaro - 1 Minute Master
1 × $15.00 -
×
 Active Investing courses notes with Alan Hull
1 × $6.00
Active Investing courses notes with Alan Hull
1 × $6.00 -
×
 Fibonacci Mastery Course: Complete Guide to Trading with Fib By Todd Gordon
1 × $62.00
Fibonacci Mastery Course: Complete Guide to Trading with Fib By Todd Gordon
1 × $62.00 -
×
 ePass Platinum
1 × $31.00
ePass Platinum
1 × $31.00 -
×
 Naked Trading Mastery
1 × $39.00
Naked Trading Mastery
1 × $39.00 -
×
 Stealth Trader (Ebook) with Andy Jordan - Trading Educators
1 × $132.00
Stealth Trader (Ebook) with Andy Jordan - Trading Educators
1 × $132.00 -
×
 Day Trading and Swing Trading the Currency Market with Kathy Lien
1 × $6.00
Day Trading and Swing Trading the Currency Market with Kathy Lien
1 × $6.00 -
×
![ACD Method [Video (6 MP4s)] with Mark Fisher](https://www.totozon.com/wp-content/uploads/2024/05/ACD-Method-Video-6-MP4s-with-Mark-Fisher.jpg) ACD Method [Video (6 MP4s)] with Mark Fisher
1 × $6.00
ACD Method [Video (6 MP4s)] with Mark Fisher
1 × $6.00 -
×
 Trade Like a Stock Market Wizard with Mark Minervini
1 × $6.00
Trade Like a Stock Market Wizard with Mark Minervini
1 × $6.00 -
×
 Gann’s Secret with Jeanne Long
1 × $4.00
Gann’s Secret with Jeanne Long
1 × $4.00 -
×
 Stock Cycles with Michael Alexander
1 × $6.00
Stock Cycles with Michael Alexander
1 × $6.00 -
×
 Advanced Trading System 2020
1 × $179.00
Advanced Trading System 2020
1 × $179.00 -
×
 Astro Gann Charting Software Wave59 V 3.6
1 × $6.00
Astro Gann Charting Software Wave59 V 3.6
1 × $6.00 -
×
 The Bond Book (2nd Ed.) with Annette Thau
1 × $6.00
The Bond Book (2nd Ed.) with Annette Thau
1 × $6.00 -
×
 How to avoid the GAP
1 × $6.00
How to avoid the GAP
1 × $6.00 -
×
 Becoming a Disciplined Trader: Techniques for Achieving Peak Trading Performance with Ari Kiev
1 × $6.00
Becoming a Disciplined Trader: Techniques for Achieving Peak Trading Performance with Ari Kiev
1 × $6.00 -
×
 Alpha Quant Program with Lucas Inglese - Quantreo
1 × $15.00
Alpha Quant Program with Lucas Inglese - Quantreo
1 × $15.00 -
×
 Advanced Spread Trading with Guy Bower - MasterClass Trader
1 × $15.00
Advanced Spread Trading with Guy Bower - MasterClass Trader
1 × $15.00 -
×
 Advance Gap Trading with Master Trader
1 × $39.00
Advance Gap Trading with Master Trader
1 × $39.00 -
×
 Advanced Forex Trading Momentum vs Reversals with Indicators Webinar - Mark Whistler
1 × $6.00
Advanced Forex Trading Momentum vs Reversals with Indicators Webinar - Mark Whistler
1 × $6.00 -
×
 What Works in Online Trading with Mark Etzkorn
1 × $6.00
What Works in Online Trading with Mark Etzkorn
1 × $6.00 -
×
 Definitive Guide to Order Execution Class with Don Kaufman
1 × $6.00
Definitive Guide to Order Execution Class with Don Kaufman
1 × $6.00 -
×
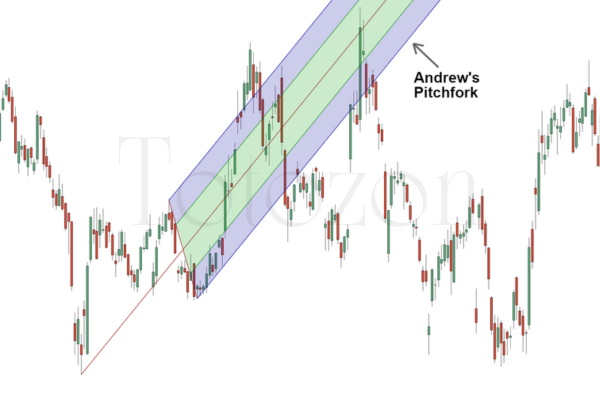 Andrews Pitchfork Basic
1 × $6.00
Andrews Pitchfork Basic
1 × $6.00 -
×
 Compass Trading System with Right Line Trading
1 × $39.00
Compass Trading System with Right Line Trading
1 × $39.00 -
×
 Advanced Risk Reversals and Rolling Thunder with Stratagem Trade
1 × $54.00
Advanced Risk Reversals and Rolling Thunder with Stratagem Trade
1 × $54.00 -
×
 Market Evolution
1 × $6.00
Market Evolution
1 × $6.00 -
×
 Long Term Investing Strategies for Maximizing Returns with Lerone Bleasdille
1 × $5.00
Long Term Investing Strategies for Maximizing Returns with Lerone Bleasdille
1 × $5.00 -
×
 Trade Your Way to Wealth with Bill Kraft
1 × $6.00
Trade Your Way to Wealth with Bill Kraft
1 × $6.00 -
×
 Altcoin Investing Course with Rekt Capital
1 × $5.00
Altcoin Investing Course with Rekt Capital
1 × $5.00 -
×
 A Day In The Life Of A Forex Trader with Vic Noble & Shirley Hudson
1 × $23.00
A Day In The Life Of A Forex Trader with Vic Noble & Shirley Hudson
1 × $23.00 -
×
 3_8’s to Wealth (Audio 84 MB+ WorkBooks) with Darlene Nelson
1 × $6.00
3_8’s to Wealth (Audio 84 MB+ WorkBooks) with Darlene Nelson
1 × $6.00 -
×
 The Tickmaster Indicator with Alphashark
1 × $54.00
The Tickmaster Indicator with Alphashark
1 × $54.00 -
×
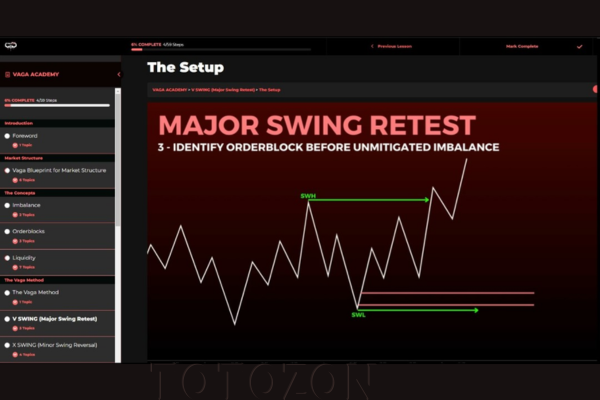 Vaga Academy with VAGAFX
1 × $5.00
Vaga Academy with VAGAFX
1 × $5.00 -
×
 All About Mutual Funds with Bruce Jacobs
1 × $6.00
All About Mutual Funds with Bruce Jacobs
1 × $6.00 -
×
 Advance Courses for Members
1 × $15.00
Advance Courses for Members
1 × $15.00 -
×
 The Orderflow Masterclass with PrimeTrading
1 × $17.00
The Orderflow Masterclass with PrimeTrading
1 × $17.00 -
×
 Derivates Demystified
1 × $6.00
Derivates Demystified
1 × $6.00 -
×
 A Litle Keltner, a Litle Wycoff and of lot of Street Smarts with Linda Raschke
1 × $6.00
A Litle Keltner, a Litle Wycoff and of lot of Street Smarts with Linda Raschke
1 × $6.00 -
×
 You Don't Need No Stinkin' Stockbroker: Taking the Pulse of Your Investment Portfolio with Doug Cappiello & Steve Tanaka
1 × $6.00
You Don't Need No Stinkin' Stockbroker: Taking the Pulse of Your Investment Portfolio with Doug Cappiello & Steve Tanaka
1 × $6.00 -
×
 All About High-Frequency Trading with Michael Durbin
1 × $6.00
All About High-Frequency Trading with Michael Durbin
1 × $6.00 -
×
 Cyclic Analysis. A BreakThrough in Transaction Timing with Cyclitec Services
1 × $6.00
Cyclic Analysis. A BreakThrough in Transaction Timing with Cyclitec Services
1 × $6.00 -
×
 All About Dividend Investing with Don Schreiber & Gary Stroik
1 × $6.00
All About Dividend Investing with Don Schreiber & Gary Stroik
1 × $6.00 -
×
 Trading Calendar Spreads with Option Pit
1 × $39.00
Trading Calendar Spreads with Option Pit
1 × $39.00 -
×
 Trading Short TermSame Day Trades Sep 2023 with Dan Sheridan & Mark Fenton - Sheridan Options Mentoring
1 × $31.00
Trading Short TermSame Day Trades Sep 2023 with Dan Sheridan & Mark Fenton - Sheridan Options Mentoring
1 × $31.00 -
×
 Financial Astrology Course with Brian James Sklenka
1 × $6.00
Financial Astrology Course with Brian James Sklenka
1 × $6.00 -
×
 The Prop Trading Code with Brannigan Barrett - Axia Futures
1 × $23.00
The Prop Trading Code with Brannigan Barrett - Axia Futures
1 × $23.00 -
×
 Beat the Market with Edward O.Thorp
1 × $6.00
Beat the Market with Edward O.Thorp
1 × $6.00 -
×
 Market Energy Trader with Top Trade Tools
1 × $5.00
Market Energy Trader with Top Trade Tools
1 × $5.00 -
×
 ICT Prodigy Trading Course – $650K in Payouts with Alex Solignani
1 × $15.00
ICT Prodigy Trading Course – $650K in Payouts with Alex Solignani
1 × $15.00 -
×
 Volatility and Timing with Jay Kaeppel – The Option Trader’s Guide to Probability
1 × $6.00
Volatility and Timing with Jay Kaeppel – The Option Trader’s Guide to Probability
1 × $6.00 -
×
 WondaFX Signature Strategy with WondaFX
1 × $5.00
WondaFX Signature Strategy with WondaFX
1 × $5.00 -
×
 Game Plan of a Winning Trader with Mike Podwojski & Vic Noble
1 × $6.00
Game Plan of a Winning Trader with Mike Podwojski & Vic Noble
1 × $6.00 -
×
 Affinity Foundation Stocks Course with Affinitytrading
1 × $6.00
Affinity Foundation Stocks Course with Affinitytrading
1 × $6.00 -
×
 6 (The Proper BackGround)
1 × $6.00
6 (The Proper BackGround)
1 × $6.00 -
×
 Trading Triggers - The Secrets to Profitable Trading with John Person
1 × $6.00
Trading Triggers - The Secrets to Profitable Trading with John Person
1 × $6.00 -
×
 Wyckoff Analysis Series. Module 2. Wyckoff Candle Volume Analysis
1 × $6.00
Wyckoff Analysis Series. Module 2. Wyckoff Candle Volume Analysis
1 × $6.00 -
×
 A Plan to make $3k Monthly on $25k with Short Term Trades with Dan Sheridan
1 × $23.00
A Plan to make $3k Monthly on $25k with Short Term Trades with Dan Sheridan
1 × $23.00 -
×
 Ultimate Trading Course with Dodgy's Dungeon
1 × $8.00
Ultimate Trading Course with Dodgy's Dungeon
1 × $8.00

TTM Slingshot & Value Charts Indicators
$6.00
File Size: Coming soon!
Delivery Time: 1–12 hours
Media Type: Online Course
TTM Slingshot & Value Charts Indicators
Introduction to TTM Slingshot & Value Charts
In the dynamic world of trading, having the right tools can make all the difference. Two such powerful tools are the TTM Slingshot and Value Charts Indicators. These indicators provide traders with crucial insights, helping them navigate market complexities and make informed decisions.
Understanding TTM Slingshot
What is TTM Slingshot?
The TTM Slingshot is an advanced trading indicator developed by John Carter. It combines multiple moving averages to identify potential breakout points in the market. By analyzing the relationship between these moving averages, the TTM Slingshot helps traders spot opportunities for entering or exiting trades.
Key Features of TTM Slingshot
- Multiple Moving Averages: Uses short-term and long-term moving averages.
- Breakout Identification: Detects potential breakout points.
- Versatility: Applicable across various markets and timeframes.
Benefits of Using TTM Slingshot
Enhanced Market Analysis
The TTM Slingshot provides a detailed analysis of market trends, allowing traders to anticipate significant price movements. This indicator’s ability to pinpoint breakout points is invaluable for making timely trading decisions.
Improved Trading Accuracy
By combining multiple moving averages, the TTM Slingshot offers a comprehensive view of the market. This integration reduces noise and enhances the accuracy of predictions, leading to more successful trades.
Setting Up TTM Slingshot
Choosing the Right Platform
To utilize the TTM Slingshot, you’ll need a trading platform that supports custom indicators. Platforms like Thinkorswim and TradeStation are popular choices among traders.
Installing the Indicator
- Download the Indicator: Obtain the TTM Slingshot file compatible with your trading platform.
- Open Your Platform: Launch the trading platform.
- Add the Indicator: Navigate to the ‘Indicators’ section and add the TTM Slingshot file.
- Customize Settings: Adjust the settings to align with your trading strategy.
Understanding Value Charts Indicators
What are Value Charts Indicators?
Value Charts Indicators are tools that measure the relative value of a security based on its price history. These indicators help traders determine whether a security is overvalued, undervalued, or fairly valued, providing a clear picture of potential trading opportunities.
Key Features of Value Charts Indicators
- Relative Value Measurement: Assesses the value of a security.
- Overbought/Oversold Conditions: Identifies extreme market conditions.
- Visual Representation: Displays value levels on a chart for easy interpretation.
Benefits of Using Value Charts Indicators
Identifying Market Extremes
Value Charts Indicators are excellent for spotting overbought and oversold conditions. By identifying these extremes, traders can make strategic decisions about entering or exiting positions.
Enhancing Risk Management
These indicators aid in risk management by providing insights into the relative value of a security. Traders can use this information to set stop-loss levels and protect their investments.
Setting Up Value Charts Indicators
Selecting the Appropriate Platform
Choose a trading platform that supports Value Charts Indicators. Many modern trading platforms, such as NinjaTrader and MetaTrader, offer these indicators.
Installing the Indicator
- Download the Indicator: Obtain the Value Charts Indicator file for your platform.
- Open Your Platform: Start the trading platform.
- Add the Indicator: Go to the ‘Indicators’ section and add the Value Charts file.
- Configure Settings: Customize the settings to fit your trading approach.
How to Use TTM Slingshot & Value Charts Together
Combining Indicators for Better Insights
Using TTM Slingshot and Value Charts Indicators together can enhance your market analysis. While TTM Slingshot identifies breakout points, Value Charts Indicators help assess the relative value of the security, providing a more comprehensive view.
Practical Application
- Entry Points: Use TTM Slingshot to identify breakout points and confirm with Value Charts Indicators to ensure the security is not overvalued.
- Exit Points: Value Charts Indicators can signal overbought conditions, indicating a good time to exit, while TTM Slingshot confirms the end of a trend.
Advanced Strategies with TTM Slingshot & Value Charts
Pairing with Other Indicators
For even more robust analysis, pair TTM Slingshot and Value Charts Indicators with other tools such as RSI (Relative Strength Index) and MACD (Moving Average Convergence Divergence).
Developing a Trading Plan
Create a detailed trading plan that incorporates these indicators. Define your entry and exit points, risk management strategies, and the specific market conditions you’re targeting.
Real-Life Examples
Successful Trade Case Study
Consider a scenario where the TTM Slingshot indicates a breakout, and Value Charts Indicators show the security is undervalued. Entering a trade at this point could lead to significant profits as the price moves to its fair value.
Learning from Mistakes
Analyze trades where the indicators did not predict the expected outcome. Understanding these failures can help refine your strategy and improve future performance.
Conclusion
Maximizing Your Trading Success
The TTM Slingshot and Value Charts Indicators are powerful tools that, when used together, can significantly enhance your trading strategy. By providing insights into market trends and relative value, these indicators help you make more informed decisions.
Taking the Next Step
Start by setting up these indicators on your trading platform. Practice interpreting the signals and integrating them into your trading strategy to see the benefits firsthand.

FAQs
What is the TTM Slingshot indicator?
The TTM Slingshot is a trading tool that uses multiple moving averages to identify breakout points in the market.
How do Value Charts Indicators work?
Value Charts Indicators measure the relative value of a security, helping traders identify overbought and oversold conditions.
Can these indicators be used together?
Yes, combining TTM Slingshot and Value Charts Indicators provides a comprehensive analysis of market trends and security value.
Which platforms support these indicators?
Platforms like Thinkorswim, TradeStation, NinjaTrader, and MetaTrader support TTM Slingshot and Value Charts Indicators.
How do I install these indicators?
Download the respective indicator files, open your trading platform, and add the indicators through the ‘Indicators’ section.
Be the first to review “TTM Slingshot & Value Charts Indicators”
You must be logged in to post a review.
Related products
Forex Trading
Original price was: $125.00.$17.00Current price is: $17.00.
Forex Trading
Original price was: $697.00.$5.00Current price is: $5.00.
Forex Trading
Original price was: $500.00.$5.00Current price is: $5.00.

Forex Trading
Original price was: $4,997.00.$27.00Current price is: $27.00.
Original price was: $2,120.00.$15.00Current price is: $15.00.

Original price was: $299.00.$8.00Current price is: $8.00.
Original price was: $799.00.$15.00Current price is: $15.00.

Original price was: $310.00.$23.00Current price is: $23.00.

Original price was: $4,995.00.$15.00Current price is: $15.00.

Original price was: $197.00.$5.00Current price is: $5.00.
Forex Trading
Original price was: $397.00.$31.00Current price is: $31.00.

Original price was: $695.00.$41.00Current price is: $41.00.

Original price was: $997.00.$8.00Current price is: $8.00.
Forex Trading
Original price was: $239.00.$8.00Current price is: $8.00.

Original price was: $139.00.$23.00Current price is: $23.00.
Original price was: $895.00.$15.00Current price is: $15.00.

Forex Trading
Original price was: $2,997.00.$23.00Current price is: $23.00.
Original price was: $450.00.$23.00Current price is: $23.00.

Original price was: $649.00.$20.00Current price is: $20.00.

Forex Trading
Original price was: $2,000.00.$23.00Current price is: $23.00.

Reviews
There are no reviews yet.