-
×
 Deep Dive Butterfly Trading Strategy Class with SJG Trades
1 × $41.00
Deep Dive Butterfly Trading Strategy Class with SJG Trades
1 × $41.00 -
×
 Forex Strategy Master with Russ Horn
1 × $6.00
Forex Strategy Master with Russ Horn
1 × $6.00 -
×
 Duxinator: High Odds Penny Trading Presented with Steven Dux
1 × $6.00
Duxinator: High Odds Penny Trading Presented with Steven Dux
1 × $6.00 -
×
 Advanced Spread Trading with Guy Bower - MasterClass Trader
1 × $15.00
Advanced Spread Trading with Guy Bower - MasterClass Trader
1 × $15.00 -
×
 Forecast 2024 Clarification with Larry Williams
1 × $15.00
Forecast 2024 Clarification with Larry Williams
1 × $15.00 -
×
 The Indices Orderflow Masterclass with The Forex Scalpers
1 × $23.00
The Indices Orderflow Masterclass with The Forex Scalpers
1 × $23.00 -
×
 VXX Made Easy By Option Pit
1 × $62.00
VXX Made Easy By Option Pit
1 × $62.00 -
×
 TradeCraft: Your Path to Peak Performance Trading By Adam Grimes
1 × $15.00
TradeCraft: Your Path to Peak Performance Trading By Adam Grimes
1 × $15.00 -
×
 The Thirty-Second Jewel in PDF with Constance Brown
1 × $8.00
The Thirty-Second Jewel in PDF with Constance Brown
1 × $8.00 -
×
 Video On Demand Pathway with Trade With Profile
1 × $5.00
Video On Demand Pathway with Trade With Profile
1 × $5.00 -
×
 Zanzibar System for the EuroFx with Joe Ross
1 × $4.00
Zanzibar System for the EuroFx with Joe Ross
1 × $4.00 -
×
 Option Trading Camp
1 × $15.00
Option Trading Camp
1 × $15.00 -
×
 How To Read The Market Professionally with TradeSmart
1 × $27.00
How To Read The Market Professionally with TradeSmart
1 × $27.00 -
×
 Trading Volatility - The Ultimate Course with Master Trader
1 × $69.00
Trading Volatility - The Ultimate Course with Master Trader
1 × $69.00 -
×
 Market Structure Masterclass with Braveheart Trading
1 × $5.00
Market Structure Masterclass with Braveheart Trading
1 × $5.00 -
×
 Crypto Trading Academy with Cheeky Investor - Aussie Day Trader
1 × $13.00
Crypto Trading Academy with Cheeky Investor - Aussie Day Trader
1 × $13.00 -
×
 True Momentum System Basic Package with Sam Shames
1 × $13.00
True Momentum System Basic Package with Sam Shames
1 × $13.00 -
×
 Activedaytrader - Bond Trading Bootcamp
1 × $8.00
Activedaytrader - Bond Trading Bootcamp
1 × $8.00 -
×
 Traders Business Plan with Adrienne Laris Toghraie
1 × $6.00
Traders Business Plan with Adrienne Laris Toghraie
1 × $6.00 -
×
 The Trading Blueprint with Brad Goh - The Trading Geek
1 × $5.00
The Trading Blueprint with Brad Goh - The Trading Geek
1 × $5.00 -
×
 Theoptionschool - The 6 Secrets of Options Trading
1 × $6.00
Theoptionschool - The 6 Secrets of Options Trading
1 × $6.00 -
×
 ART Online 4 Weeks Home Study Course with Bennett McDowell
1 × $78.00
ART Online 4 Weeks Home Study Course with Bennett McDowell
1 × $78.00 -
×
 E-mini Weekly Options Income with Peter Titus
1 × $15.00
E-mini Weekly Options Income with Peter Titus
1 × $15.00 -
×
 TradingTheTape - SMTTT
1 × $15.00
TradingTheTape - SMTTT
1 × $15.00 -
×
 Apteros Trading Fall Intensive 2021 - Trading Intensive
1 × $54.00
Apteros Trading Fall Intensive 2021 - Trading Intensive
1 × $54.00 -
×
 8 Successful Iron Condor Methodologies with Dan Sheridan
1 × $23.00
8 Successful Iron Condor Methodologies with Dan Sheridan
1 × $23.00 -
×
 Trading Ist Ein Geschaft (German) (tradingeducators.com)
1 × $6.00
Trading Ist Ein Geschaft (German) (tradingeducators.com)
1 × $6.00 -
×
 Trading Short TermSame Day Trades Sep 2023 with Dan Sheridan & Mark Fenton - Sheridan Options Mentoring
1 × $31.00
Trading Short TermSame Day Trades Sep 2023 with Dan Sheridan & Mark Fenton - Sheridan Options Mentoring
1 × $31.00 -
×
 Carolyn Boroden Package
1 × $15.00
Carolyn Boroden Package
1 × $15.00 -
×
 Weekly Options Boot Camp with Price Headley
1 × $15.00
Weekly Options Boot Camp with Price Headley
1 × $15.00 -
×
 SQX Mentorship with Tip Toe Hippo
1 × $23.00
SQX Mentorship with Tip Toe Hippo
1 × $23.00 -
×
 Wysetrade Forex Masterclass 3.0
1 × $6.00
Wysetrade Forex Masterclass 3.0
1 × $6.00 -
×
 The Ultimate Forex Structure Course
1 × $31.00
The Ultimate Forex Structure Course
1 × $31.00 -
×
 Zen in the Markets with Edward Allen Toppel
1 × $6.00
Zen in the Markets with Edward Allen Toppel
1 × $6.00 -
×
 Momentum Explained
1 × $6.00
Momentum Explained
1 × $6.00 -
×
 Understanding How To Trade Fractals
1 × $15.00
Understanding How To Trade Fractals
1 × $15.00 -
×
 Atlas Edition Course with Apex Paragon Trading
1 × $6.00
Atlas Edition Course with Apex Paragon Trading
1 × $6.00 -
×
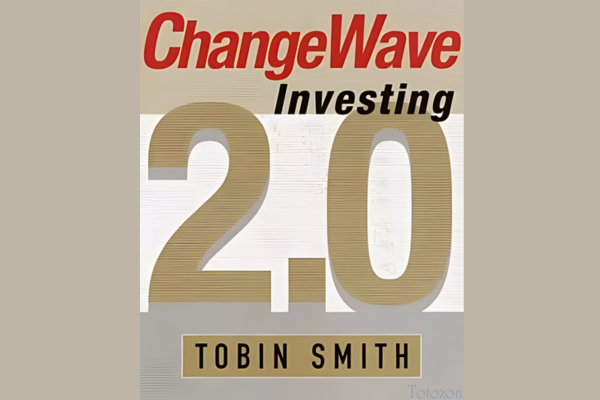 ChangeWave Investing 2.0 with Tobin Smith
1 × $6.00
ChangeWave Investing 2.0 with Tobin Smith
1 × $6.00 -
×
 WickOrTreat Trading Course with WickOrTreat
1 × $6.00
WickOrTreat Trading Course with WickOrTreat
1 × $6.00 -
×
 Bear Market Success Workshop with Base Camp Trading
1 × $15.00
Bear Market Success Workshop with Base Camp Trading
1 × $15.00 -
×
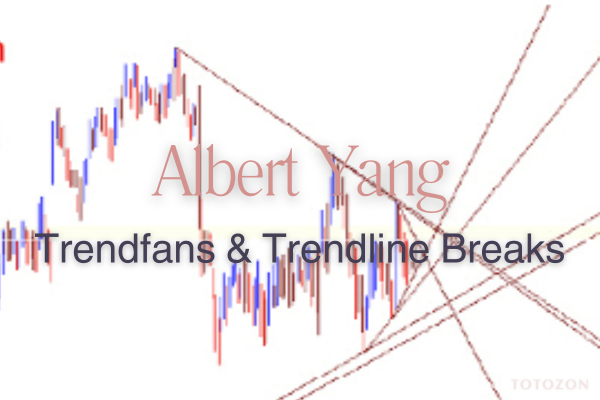 Trendfans & Trendline Breaks with Albert Yang
1 × $6.00
Trendfans & Trendline Breaks with Albert Yang
1 × $6.00 -
×
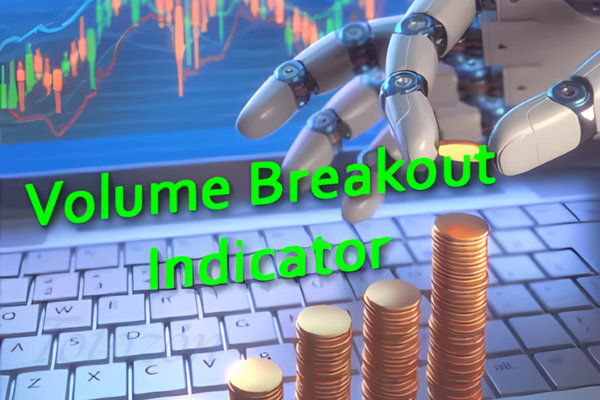 Volume Breakout Indicator
1 × $31.00
Volume Breakout Indicator
1 × $31.00 -
×
 Options Trading & Ultimate MasterClass With Tyrone Abela - FX Evolution
1 × $54.00
Options Trading & Ultimate MasterClass With Tyrone Abela - FX Evolution
1 × $54.00 -
×
 Compass Trading System with Right Line Trading
1 × $39.00
Compass Trading System with Right Line Trading
1 × $39.00 -
×
 Neowave. Inovations that Make Elliott Wave Work Better for You with Glenn Neely
1 × $6.00
Neowave. Inovations that Make Elliott Wave Work Better for You with Glenn Neely
1 × $6.00 -
×
 Charting Made Easy with John J.Murphy
1 × $6.00
Charting Made Easy with John J.Murphy
1 × $6.00 -
×
 Exit Strategies for Stock and Futures with Charles LeBeau
1 × $6.00
Exit Strategies for Stock and Futures with Charles LeBeau
1 × $6.00 -
×
 The Naked Eye: Raw Data Analytics with Edgar Torres - Raw Data Analytics
1 × $8.00
The Naked Eye: Raw Data Analytics with Edgar Torres - Raw Data Analytics
1 × $8.00 -
×
 How I Trade for a Living with Gary Smith
1 × $6.00
How I Trade for a Living with Gary Smith
1 × $6.00 -
×
 Order flow self-study training program with iMFtracker
1 × $10.00
Order flow self-study training program with iMFtracker
1 × $10.00 -
×
 High Probability Trading Using Elliott Wave And Fibonacci Analysis withVic Patel - Forex Training Group
1 × $10.00
High Probability Trading Using Elliott Wave And Fibonacci Analysis withVic Patel - Forex Training Group
1 × $10.00 -
×
 0 DTE Options Trading Workshop with Aeromir Corporation
1 × $15.00
0 DTE Options Trading Workshop with Aeromir Corporation
1 × $15.00 -
×
 eASCTrend Traning CD. Hybrid Trading Method with Ablesys
1 × $6.00
eASCTrend Traning CD. Hybrid Trading Method with Ablesys
1 × $6.00 -
×
 Double Top Trader Trading System with Anthony Gibson
1 × $6.00
Double Top Trader Trading System with Anthony Gibson
1 × $6.00 -
×
 Advanced Daytrading Seminar with Ken Calhoun
1 × $155.00
Advanced Daytrading Seminar with Ken Calhoun
1 × $155.00 -
×
 Trading Mastery Course 2009
1 × $6.00
Trading Mastery Course 2009
1 × $6.00 -
×
 3 Day Live Trading Webinar (Jan 2010)
1 × $6.00
3 Day Live Trading Webinar (Jan 2010)
1 × $6.00 -
×
 Value Based Power Trading
1 × $6.00
Value Based Power Trading
1 × $6.00 -
×
 The Next Great Bull Market with Matthew McCall
1 × $6.00
The Next Great Bull Market with Matthew McCall
1 × $6.00 -
×
 The Complete Guide to Multiple Time Frame Analysis & Reading Price Action with Aiman Almansoori
1 × $13.00
The Complete Guide to Multiple Time Frame Analysis & Reading Price Action with Aiman Almansoori
1 × $13.00 -
×
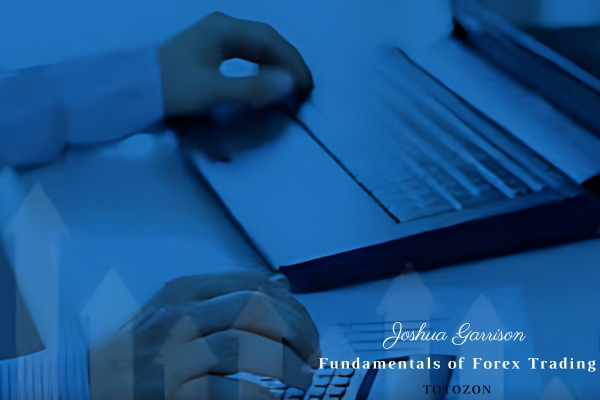 Fundamentals of Forex Trading with Joshua Garrison
1 × $5.00
Fundamentals of Forex Trading with Joshua Garrison
1 × $5.00 -
×
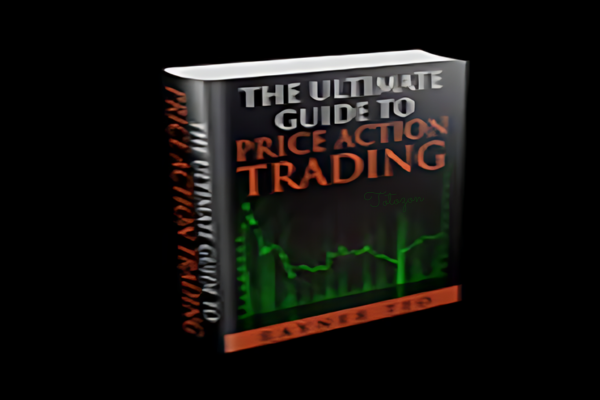 TRADINGWITHRAYNER - PRICE ACTION TRADING INSTITUTE
1 × $23.00
TRADINGWITHRAYNER - PRICE ACTION TRADING INSTITUTE
1 × $23.00 -
×
 AI For Traders with Trading Markets
1 × $31.00
AI For Traders with Trading Markets
1 × $31.00 -
×
 A Mathematician Plays The Stock Market with John Allen Paulos
1 × $6.00
A Mathematician Plays The Stock Market with John Allen Paulos
1 × $6.00 -
×
 Becoming a Disciplined Trader: Techniques for Achieving Peak Trading Performance with Ari Kiev
1 × $6.00
Becoming a Disciplined Trader: Techniques for Achieving Peak Trading Performance with Ari Kiev
1 × $6.00 -
×
 Safety in the Market. Smarter Starter Pack 1st Edition
1 × $6.00
Safety in the Market. Smarter Starter Pack 1st Edition
1 × $6.00 -
×
 Trend Commandments with Michael Covel
1 × $6.00
Trend Commandments with Michael Covel
1 × $6.00 -
×
 Zap Seminar - Ablesys
1 × $6.00
Zap Seminar - Ablesys
1 × $6.00 -
×
 Out of the Pits with Caitlin Zaloom
1 × $6.00
Out of the Pits with Caitlin Zaloom
1 × $6.00 -
×
 The Zone Trader Training Series with Timon Weller
1 × $8.00
The Zone Trader Training Series with Timon Weller
1 × $8.00 -
×
 Come Into My Trading Room: A Complete Guide to Trading with Alexander Elder
1 × $6.00
Come Into My Trading Room: A Complete Guide to Trading with Alexander Elder
1 × $6.00 -
×
 China & the World Trading System with Deborah Cass, Brett Williams & George Barker
1 × $6.00
China & the World Trading System with Deborah Cass, Brett Williams & George Barker
1 × $6.00 -
×
 Advanced Option Trading with Broken Wing Butterflys with Greg Loehr
1 × $9.00
Advanced Option Trading with Broken Wing Butterflys with Greg Loehr
1 × $9.00 -
×
 Building Winning Trading Systems
1 × $6.00
Building Winning Trading Systems
1 × $6.00 -
×
 HYDRA 3 Day Bootcamp
1 × $5.00
HYDRA 3 Day Bootcamp
1 × $5.00 -
×
 The Stock Market Trading Secrets of the Late (1940, scaned)
1 × $6.00
The Stock Market Trading Secrets of the Late (1940, scaned)
1 × $6.00 -
×
 YTC Price Action Trader
1 × $6.00
YTC Price Action Trader
1 × $6.00 -
×
 Pocketing Premium Master Class (Basic) with Henrry Gambell
1 × $31.00
Pocketing Premium Master Class (Basic) with Henrry Gambell
1 × $31.00 -
×
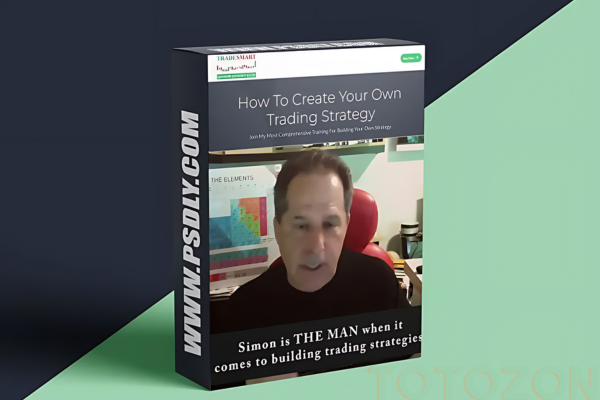 How To Create Your Own Trading Strategy with Simon Klein - Trade Smart
1 × $5.00
How To Create Your Own Trading Strategy with Simon Klein - Trade Smart
1 × $5.00 -
×
 Essentials in Quantitative Trading QT01 By HangukQuant's
1 × $23.00
Essentials in Quantitative Trading QT01 By HangukQuant's
1 × $23.00 -
×
 Volatile Markets Made Easy: Trading Stocks and Options for Increased Profits with Guy Cohen
1 × $6.00
Volatile Markets Made Easy: Trading Stocks and Options for Increased Profits with Guy Cohen
1 × $6.00 -
×
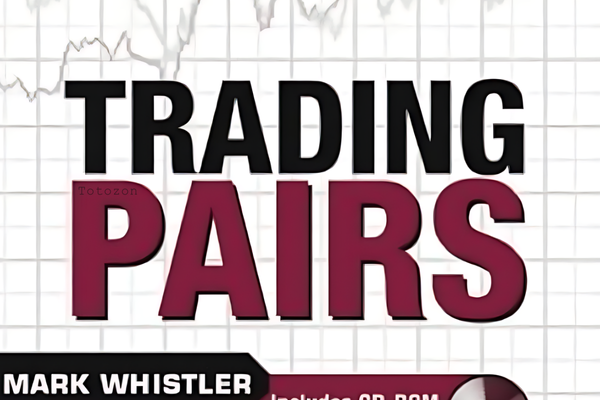 Trading Pairs: Capturing Profits and Hedging Risk with Statistical Arbitrage Strategies - Mark Whistler
1 × $6.00
Trading Pairs: Capturing Profits and Hedging Risk with Statistical Arbitrage Strategies - Mark Whistler
1 × $6.00 -
×
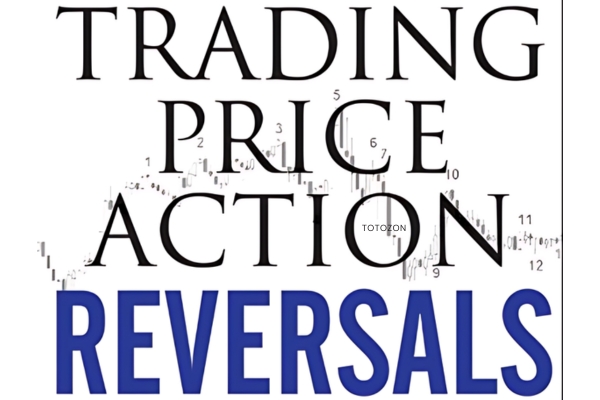 Trading Price Action Reversals (Kindle) with Al Brooks
1 × $6.00
Trading Price Action Reversals (Kindle) with Al Brooks
1 × $6.00 -
×
 Algo Trading Masterclass with Ali Casey - StatOasis
1 × $23.00
Algo Trading Masterclass with Ali Casey - StatOasis
1 × $23.00 -
×
 Artificial Intelligence with Larry Pesavento
1 × $6.00
Artificial Intelligence with Larry Pesavento
1 × $6.00 -
×
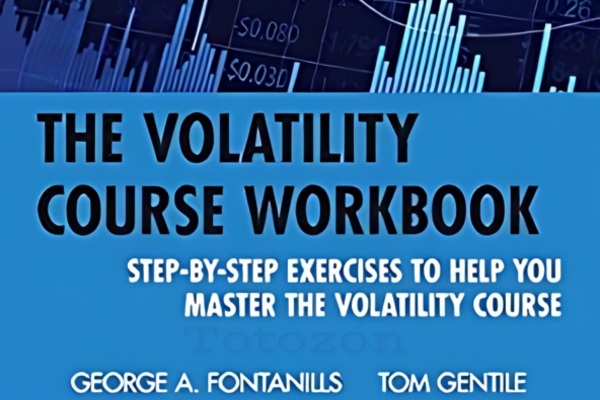 The Volatility Course Workbook: Step-by-Step Exercises to Help You Master The Volatility Course - George Fontanills & Tom Gentile
1 × $6.00
The Volatility Course Workbook: Step-by-Step Exercises to Help You Master The Volatility Course - George Fontanills & Tom Gentile
1 × $6.00 -
×
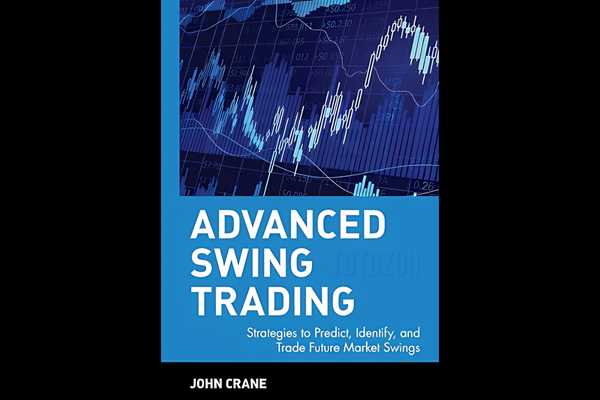 Advanced Swing Trading with John Crane
1 × $6.00
Advanced Swing Trading with John Crane
1 × $6.00 -
×
 The Vest Pocket CFO (3rd Ed) with Jae Shim
1 × $6.00
The Vest Pocket CFO (3rd Ed) with Jae Shim
1 × $6.00 -
×
 Quantamentals - The Next Great Forefront Of Trading and Investing with Trading Markets
1 × $8.00
Quantamentals - The Next Great Forefront Of Trading and Investing with Trading Markets
1 × $8.00 -
×
 Developing a Forex Trading Plan Webinar
1 × $6.00
Developing a Forex Trading Plan Webinar
1 × $6.00 -
×
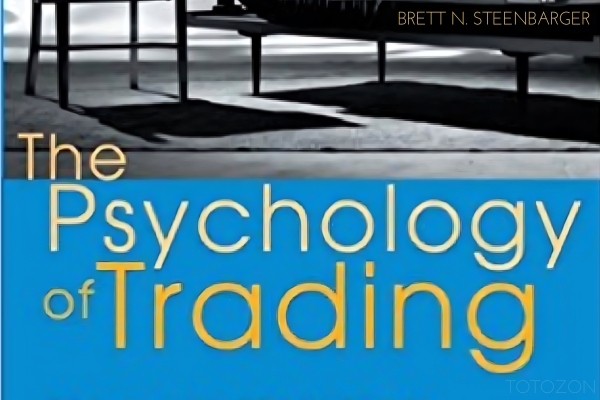 Unsorted Articles about the Psychology of Trading with Brett N.Steenbarger
1 × $6.00
Unsorted Articles about the Psychology of Trading with Brett N.Steenbarger
1 × $6.00 -
×
 Bond Market Course with The Macro Compass
1 × $15.00
Bond Market Course with The Macro Compass
1 × $15.00 -
×
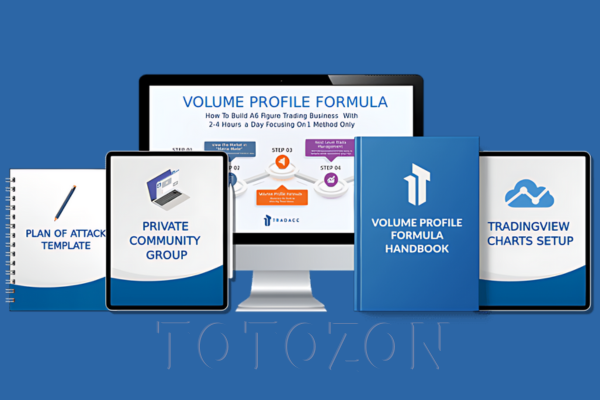 Volume Profile Formula with Aaron Korbs
1 × $5.00
Volume Profile Formula with Aaron Korbs
1 × $5.00 -
×
 Day Trading MasterClass with Tyrone Abela - FX Evolution
1 × $139.00
Day Trading MasterClass with Tyrone Abela - FX Evolution
1 × $139.00 -
×
 The Wizard Training Course with Mitch King
1 × $6.00
The Wizard Training Course with Mitch King
1 × $6.00 -
×
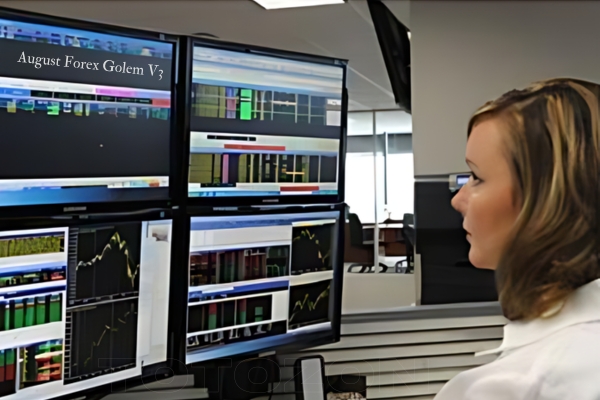 August Forex Golem V3
1 × $6.00
August Forex Golem V3
1 × $6.00 -
×
 Advanced Pattern Trader Course with Trade Empowered
1 × $23.00
Advanced Pattern Trader Course with Trade Empowered
1 × $23.00 -
×
 Home Run Options Trading Course with Dave Aquino - Base Camp Trading
1 × $11.00
Home Run Options Trading Course with Dave Aquino - Base Camp Trading
1 × $11.00 -
×
 Create Your Trade Plan with Yuri Shramenko
1 × $6.00
Create Your Trade Plan with Yuri Shramenko
1 × $6.00 -
×
 Cwesi Forex Trading Bootcamp (Algo Trading)
1 × $13.00
Cwesi Forex Trading Bootcamp (Algo Trading)
1 × $13.00 -
×
 Market Mindfields. Dancing with Gorilla
1 × $6.00
Market Mindfields. Dancing with Gorilla
1 × $6.00 -
×
 ChartEngineers Course
1 × $5.00
ChartEngineers Course
1 × $5.00 -
×
 Zm Capitals Full course + Ebook with Zain Mokhles - ZmCapitals
1 × $31.00
Zm Capitals Full course + Ebook with Zain Mokhles - ZmCapitals
1 × $31.00 -
×
 Asset Allocation for the Individual Investor with CFA Institute
1 × $6.00
Asset Allocation for the Individual Investor with CFA Institute
1 × $6.00 -
×
 XLT - Futures Trading Course
1 × $54.00
XLT - Futures Trading Course
1 × $54.00 -
×
 CFA Level 1 – PassMaster 2004 CD with Stalla
1 × $6.00
CFA Level 1 – PassMaster 2004 CD with Stalla
1 × $6.00 -
×
 WealthFRX Trading Mastery 3.0
1 × $5.00
WealthFRX Trading Mastery 3.0
1 × $5.00 -
×
 Trade What You See How To Profit from Pattern Recognition with Larry Pesavento & Leslie Jouflas
1 × $6.00
Trade What You See How To Profit from Pattern Recognition with Larry Pesavento & Leslie Jouflas
1 × $6.00 -
×
 Order Flow With The Power Of Point Of Control Course and The Imbalance
1 × $6.00
Order Flow With The Power Of Point Of Control Course and The Imbalance
1 × $6.00 -
×
 Ultimate Trading Course with Dodgy's Dungeon
1 × $8.00
Ultimate Trading Course with Dodgy's Dungeon
1 × $8.00

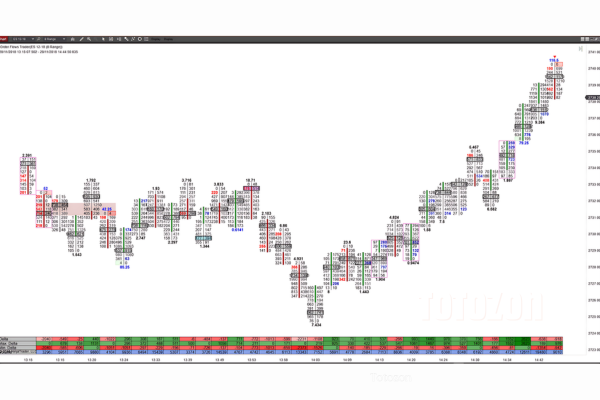
TTM Slingshot & Value Charts Indicators
$6.00
File Size: Coming soon!
Delivery Time: 1–12 hours
Media Type: Online Course
TTM Slingshot & Value Charts Indicators
Introduction to TTM Slingshot & Value Charts
In the dynamic world of trading, having the right tools can make all the difference. Two such powerful tools are the TTM Slingshot and Value Charts Indicators. These indicators provide traders with crucial insights, helping them navigate market complexities and make informed decisions.
Understanding TTM Slingshot
What is TTM Slingshot?
The TTM Slingshot is an advanced trading indicator developed by John Carter. It combines multiple moving averages to identify potential breakout points in the market. By analyzing the relationship between these moving averages, the TTM Slingshot helps traders spot opportunities for entering or exiting trades.
Key Features of TTM Slingshot
- Multiple Moving Averages: Uses short-term and long-term moving averages.
- Breakout Identification: Detects potential breakout points.
- Versatility: Applicable across various markets and timeframes.
Benefits of Using TTM Slingshot
Enhanced Market Analysis
The TTM Slingshot provides a detailed analysis of market trends, allowing traders to anticipate significant price movements. This indicator’s ability to pinpoint breakout points is invaluable for making timely trading decisions.
Improved Trading Accuracy
By combining multiple moving averages, the TTM Slingshot offers a comprehensive view of the market. This integration reduces noise and enhances the accuracy of predictions, leading to more successful trades.
Setting Up TTM Slingshot
Choosing the Right Platform
To utilize the TTM Slingshot, you’ll need a trading platform that supports custom indicators. Platforms like Thinkorswim and TradeStation are popular choices among traders.
Installing the Indicator
- Download the Indicator: Obtain the TTM Slingshot file compatible with your trading platform.
- Open Your Platform: Launch the trading platform.
- Add the Indicator: Navigate to the ‘Indicators’ section and add the TTM Slingshot file.
- Customize Settings: Adjust the settings to align with your trading strategy.
Understanding Value Charts Indicators
What are Value Charts Indicators?
Value Charts Indicators are tools that measure the relative value of a security based on its price history. These indicators help traders determine whether a security is overvalued, undervalued, or fairly valued, providing a clear picture of potential trading opportunities.
Key Features of Value Charts Indicators
- Relative Value Measurement: Assesses the value of a security.
- Overbought/Oversold Conditions: Identifies extreme market conditions.
- Visual Representation: Displays value levels on a chart for easy interpretation.
Benefits of Using Value Charts Indicators
Identifying Market Extremes
Value Charts Indicators are excellent for spotting overbought and oversold conditions. By identifying these extremes, traders can make strategic decisions about entering or exiting positions.
Enhancing Risk Management
These indicators aid in risk management by providing insights into the relative value of a security. Traders can use this information to set stop-loss levels and protect their investments.
Setting Up Value Charts Indicators
Selecting the Appropriate Platform
Choose a trading platform that supports Value Charts Indicators. Many modern trading platforms, such as NinjaTrader and MetaTrader, offer these indicators.
Installing the Indicator
- Download the Indicator: Obtain the Value Charts Indicator file for your platform.
- Open Your Platform: Start the trading platform.
- Add the Indicator: Go to the ‘Indicators’ section and add the Value Charts file.
- Configure Settings: Customize the settings to fit your trading approach.
How to Use TTM Slingshot & Value Charts Together
Combining Indicators for Better Insights
Using TTM Slingshot and Value Charts Indicators together can enhance your market analysis. While TTM Slingshot identifies breakout points, Value Charts Indicators help assess the relative value of the security, providing a more comprehensive view.
Practical Application
- Entry Points: Use TTM Slingshot to identify breakout points and confirm with Value Charts Indicators to ensure the security is not overvalued.
- Exit Points: Value Charts Indicators can signal overbought conditions, indicating a good time to exit, while TTM Slingshot confirms the end of a trend.
Advanced Strategies with TTM Slingshot & Value Charts
Pairing with Other Indicators
For even more robust analysis, pair TTM Slingshot and Value Charts Indicators with other tools such as RSI (Relative Strength Index) and MACD (Moving Average Convergence Divergence).
Developing a Trading Plan
Create a detailed trading plan that incorporates these indicators. Define your entry and exit points, risk management strategies, and the specific market conditions you’re targeting.
Real-Life Examples
Successful Trade Case Study
Consider a scenario where the TTM Slingshot indicates a breakout, and Value Charts Indicators show the security is undervalued. Entering a trade at this point could lead to significant profits as the price moves to its fair value.
Learning from Mistakes
Analyze trades where the indicators did not predict the expected outcome. Understanding these failures can help refine your strategy and improve future performance.
Conclusion
Maximizing Your Trading Success
The TTM Slingshot and Value Charts Indicators are powerful tools that, when used together, can significantly enhance your trading strategy. By providing insights into market trends and relative value, these indicators help you make more informed decisions.
Taking the Next Step
Start by setting up these indicators on your trading platform. Practice interpreting the signals and integrating them into your trading strategy to see the benefits firsthand.

FAQs
What is the TTM Slingshot indicator?
The TTM Slingshot is a trading tool that uses multiple moving averages to identify breakout points in the market.
How do Value Charts Indicators work?
Value Charts Indicators measure the relative value of a security, helping traders identify overbought and oversold conditions.
Can these indicators be used together?
Yes, combining TTM Slingshot and Value Charts Indicators provides a comprehensive analysis of market trends and security value.
Which platforms support these indicators?
Platforms like Thinkorswim, TradeStation, NinjaTrader, and MetaTrader support TTM Slingshot and Value Charts Indicators.
How do I install these indicators?
Download the respective indicator files, open your trading platform, and add the indicators through the ‘Indicators’ section.
Be the first to review “TTM Slingshot & Value Charts Indicators”
You must be logged in to post a review.
Related products

Original price was: $1,849.00.$15.00Current price is: $15.00.
Original price was: $1,800.00.$54.00Current price is: $54.00.
Original price was: $695.00.$41.00Current price is: $41.00.

Original price was: $139.00.$23.00Current price is: $23.00.
Original price was: $497.00.$11.00Current price is: $11.00.
Original price was: $4,995.00.$15.00Current price is: $15.00.
Forex Trading
The Complete Guide to Multiple Time Frame Analysis & Reading Price Action with Aiman Almansoori
Original price was: $1,399.00.$13.00Current price is: $13.00.

Original price was: $1,200.00.$23.00Current price is: $23.00.
Original price was: $895.00.$15.00Current price is: $15.00.
Forex Trading
Original price was: $999.00.$15.00Current price is: $15.00.

Original price was: $999.00.$5.00Current price is: $5.00.
Forex Trading
Original price was: $2,000.00.$23.00Current price is: $23.00.
Forex Trading
Original price was: $239.00.$8.00Current price is: $8.00.

Original price was: $997.00.$13.00Current price is: $13.00.
Forex Trading
Original price was: $397.00.$31.00Current price is: $31.00.
Original price was: $997.00.$8.00Current price is: $8.00.
Forex Trading
Original price was: $797.00.$10.00Current price is: $10.00.

Forex Trading
Original price was: $799.00.$15.00Current price is: $15.00.
Forex Trading
Original price was: $1,098.00.$39.00Current price is: $39.00.

Forex Trading
Original price was: $500.00.$5.00Current price is: $5.00.

Reviews
There are no reviews yet.