-
×
 The Indices Orderflow Masterclass with The Forex Scalpers
1 × $23.00
The Indices Orderflow Masterclass with The Forex Scalpers
1 × $23.00 -
×
 The Complete Guide To Futures & Commodities Trading with Stephen Jennings
1 × $6.00
The Complete Guide To Futures & Commodities Trading with Stephen Jennings
1 × $6.00 -
×
 Pattern Recognition: A Fundamental Introduction to Japanese Candlestick Charting Techniques Class with Jeff Bierman
1 × $6.00
Pattern Recognition: A Fundamental Introduction to Japanese Candlestick Charting Techniques Class with Jeff Bierman
1 × $6.00 -
×
 Essentials Course & Day Trading Strategies with Bear Bull Traders
1 × $13.00
Essentials Course & Day Trading Strategies with Bear Bull Traders
1 × $13.00 -
×
 WondaFX Signature Strategy with WondaFX
1 × $5.00
WondaFX Signature Strategy with WondaFX
1 × $5.00 -
×
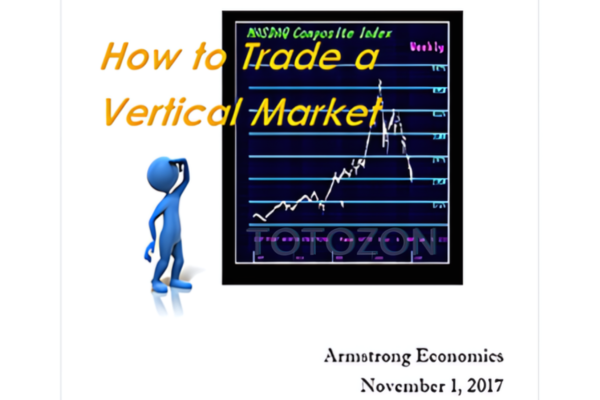 How to Trade a Vertical Market with Armstrong Economics
1 × $155.00
How to Trade a Vertical Market with Armstrong Economics
1 × $155.00 -
×
 Ron Wagner - Creating a Profitable Trading & Investing Plan + Techniques to Perfect Your Intraday GAP
1 × $6.00
Ron Wagner - Creating a Profitable Trading & Investing Plan + Techniques to Perfect Your Intraday GAP
1 × $6.00 -
×
 John Bollinger on Bollinger Bands
1 × $6.00
John Bollinger on Bollinger Bands
1 × $6.00 -
×
 The Naked Eye: Raw Data Analytics with Edgar Torres - Raw Data Analytics
1 × $8.00
The Naked Eye: Raw Data Analytics with Edgar Torres - Raw Data Analytics
1 × $8.00 -
×
 Quantamentals - The Next Great Forefront Of Trading and Investing with Trading Markets
1 × $8.00
Quantamentals - The Next Great Forefront Of Trading and Investing with Trading Markets
1 × $8.00 -
×
 Quantifiable Edges VIX Trading Course with Amibroker Code - Quantifiable Edges
1 × $15.00
Quantifiable Edges VIX Trading Course with Amibroker Code - Quantifiable Edges
1 × $15.00 -
×
 Global Product with John Stark
1 × $6.00
Global Product with John Stark
1 × $6.00 -
×
 Market Structure Matters with Haim Bodek
1 × $62.00
Market Structure Matters with Haim Bodek
1 × $62.00 -
×
 FXJake Webinars with Walter Peters
1 × $6.00
FXJake Webinars with Walter Peters
1 × $6.00 -
×
 Price Action Trading Manual 2010
1 × $6.00
Price Action Trading Manual 2010
1 × $6.00 -
×
 Andy’s EMini Bar – 40 Min System with Joe Ross
1 × $6.00
Andy’s EMini Bar – 40 Min System with Joe Ross
1 × $6.00 -
×
 Investing In KLSE Stocks and Futures With Japanese Candlestick with Fred Tam
1 × $6.00
Investing In KLSE Stocks and Futures With Japanese Candlestick with Fred Tam
1 × $6.00 -
×
 Robotic trading interactive
1 × $31.00
Robotic trading interactive
1 × $31.00 -
×
 The Logical Trader: Applying a Method to the Madness with Mark Fisher
1 × $6.00
The Logical Trader: Applying a Method to the Madness with Mark Fisher
1 × $6.00 -
×
 Tradacc – The Volume Profile Formula + Futures Masterclass and Rapid Setups Pack + S&P 500 Secrets Bundle - Aaron Korbs
1 × $5.00
Tradacc – The Volume Profile Formula + Futures Masterclass and Rapid Setups Pack + S&P 500 Secrets Bundle - Aaron Korbs
1 × $5.00 -
×
 The Stock Index Futures Market with B.Thomas Byme Jr.
1 × $6.00
The Stock Index Futures Market with B.Thomas Byme Jr.
1 × $6.00 -
×
 Sure-thing Options Trading: A Money-Making Guide to the New Listed Stock and Commodity Options Markets - George Angell
1 × $6.00
Sure-thing Options Trading: A Money-Making Guide to the New Listed Stock and Commodity Options Markets - George Angell
1 × $6.00 -
×
 Secret Income with James Altucher
1 × $62.00
Secret Income with James Altucher
1 × $62.00 -
×
 Risk Management with Aswath Damodaran
1 × $6.00
Risk Management with Aswath Damodaran
1 × $6.00 -
×
 Pattern Cycles with Alan Farley
1 × $6.00
Pattern Cycles with Alan Farley
1 × $6.00 -
×
 Short-Term Trading, Long-Term Profits with John Leizman - McGraw-Hill
1 × $6.00
Short-Term Trading, Long-Term Profits with John Leizman - McGraw-Hill
1 × $6.00 -
×
 Heiken Ashi 101
1 × $15.00
Heiken Ashi 101
1 × $15.00 -
×
 Imperial FX Academy
1 × $5.00
Imperial FX Academy
1 × $5.00 -
×
 Bulletproof Butterflies 2.0 2022 (PREMIUM) with Bruce Marshall
1 × $23.00
Bulletproof Butterflies 2.0 2022 (PREMIUM) with Bruce Marshall
1 × $23.00 -
×
 SPIKED COLLARS (Dynamic Hedging)
1 × $15.00
SPIKED COLLARS (Dynamic Hedging)
1 × $15.00 -
×
 Tape Reading & Market Tactics with Humphrey Neill
1 × $6.00
Tape Reading & Market Tactics with Humphrey Neill
1 × $6.00 -
×
 Long-Term Secrets to Short-Term Trading (Ebook) with Larry Williams
1 × $6.00
Long-Term Secrets to Short-Term Trading (Ebook) with Larry Williams
1 × $6.00 -
×
 Secret $100k Meeting with Russell Brunson
1 × $6.00
Secret $100k Meeting with Russell Brunson
1 × $6.00 -
×
 Master The Markets 2.0 with French Trader
1 × $6.00
Master The Markets 2.0 with French Trader
1 × $6.00 -
×
 Deep Dive Butterfly Trading Strategy Class with SJG Trades
1 × $41.00
Deep Dive Butterfly Trading Strategy Class with SJG Trades
1 × $41.00 -
×
 Advanced Spread Trading with Guy Bower - MasterClass Trader
1 × $15.00
Advanced Spread Trading with Guy Bower - MasterClass Trader
1 × $15.00 -
×
 The Best Option Trading Course with David Jaffee - Best Stock Strategy
1 × $15.00
The Best Option Trading Course with David Jaffee - Best Stock Strategy
1 × $15.00 -
×
 Crystal Ball Pack PLUS bonus Live Trade By Pat Mitchell - Trick Trades
1 × $20.00
Crystal Ball Pack PLUS bonus Live Trade By Pat Mitchell - Trick Trades
1 × $20.00 -
×
 The Prop Trading Code with Brannigan Barrett - Axia Futures
1 × $23.00
The Prop Trading Code with Brannigan Barrett - Axia Futures
1 × $23.00 -
×
 Home Run Options Trading Course with Dave Aquino - Base Camp Trading
1 × $11.00
Home Run Options Trading Course with Dave Aquino - Base Camp Trading
1 × $11.00 -
×
 Bond Market Course with The Macro Compass
1 × $15.00
Bond Market Course with The Macro Compass
1 × $15.00 -
×
 Scalp Strategy and Flipping Small Accounts with Opes Trading Group
1 × $5.00
Scalp Strategy and Flipping Small Accounts with Opes Trading Group
1 × $5.00 -
×
 Trading Short TermSame Day Trades Sep 2023 with Dan Sheridan & Mark Fenton - Sheridan Options Mentoring
1 × $31.00
Trading Short TermSame Day Trades Sep 2023 with Dan Sheridan & Mark Fenton - Sheridan Options Mentoring
1 × $31.00

The Illustrated Guide to Technical Analysis Signals and Phrases with Constance Brown
$6.00
File Size: Coming soon!
Delivery Time: 1–12 hours
Media Type: Online Course
Content Proof: Watch Here!
You may check content proof of “The Illustrated Guide to Technical Analysis Signals and Phrases with Constance Brown” below:

The Illustrated Guide to Technical Analysis Signals and Phrases with Constance Brown
Navigating the world of technical analysis can seem like deciphering a foreign language. Thankfully, Constance Brown, a renowned expert in technical analysis, provides a comprehensive guide to understanding these signals and phrases. In this article, we will explore The Illustrated Guide to Technical Analysis Signals and Phrases with Constance Brown and how it can enhance your trading strategy.
Introduction to Technical Analysis
What is Technical Analysis?
Technical analysis involves studying past market data, primarily price and volume, to forecast future price movements. It’s like a weather forecast for traders, providing insights based on patterns and trends.
Why is Technical Analysis Important?
- Informed Decisions: Helps traders make educated guesses about market direction.
- Risk Management: Identifies potential risks and opportunities.
- Versatility: Applicable to various markets, including stocks, forex, and commodities.
About Constance Brown
Who is Constance Brown?
Constance Brown is a distinguished author and trader, known for her expertise in technical analysis. Her work focuses on bringing clarity and practical application to complex concepts.
Her Contribution to Technical Analysis
Brown’s contributions include several books and courses that demystify technical analysis for traders of all levels, making her a trusted name in the industry.
Key Concepts in Technical Analysis
Support and Resistance
- Support Levels: Price points where a downtrend can be expected to pause due to a concentration of demand.
- Resistance Levels: Price points where an uptrend can be expected to pause due to a concentration of supply.
Trend Lines
- Uptrend Line: A line drawn upward to show support levels.
- Downtrend Line: A line drawn downward to show resistance levels.
Chart Patterns
- Head and Shoulders: Indicates a potential reversal in trend.
- Double Tops and Bottoms: Signify reversal points.
- Triangles: Represent continuation or reversal, depending on the pattern type.
Candlestick Patterns
- Doji: Indicates indecision in the market.
- Hammer: Suggests a potential reversal after a downtrend.
- Engulfing Pattern: Shows a strong reversal signal.
Technical Analysis Indicators
Moving Averages
- Simple Moving Average (SMA): Calculates the average of a security’s price over a specific period.
- Exponential Moving Average (EMA): Gives more weight to recent prices, making it more responsive to new information.
Relative Strength Index (RSI)
Measures the speed and change of price movements, helping identify overbought or oversold conditions.
MACD (Moving Average Convergence Divergence)
A trend-following momentum indicator that shows the relationship between two moving averages.
Bollinger Bands
Consist of a middle band (SMA) and two outer bands that represent standard deviations. Useful for identifying overbought and oversold conditions.
Applying Technical Analysis Signals
Interpreting Signals
Understand the context and confirmation of signals before making trading decisions. For example, a candlestick pattern near a support level might indicate a stronger signal.
Combining Indicators
Use multiple indicators to confirm signals and reduce false positives. For instance, combining RSI with MACD can provide more reliable insights.
Backtesting Strategies
Test your strategies using historical data to see how they would have performed. This can help fine-tune your approach and improve accuracy.
Practical Examples of Technical Analysis
Using Support and Resistance
Identify key support and resistance levels on a chart and use them to set entry and exit points.
Reading Candlestick Patterns
Look for patterns like Doji or Hammer in conjunction with support and resistance levels to make informed trading decisions.
Implementing Moving Averages
Use SMA and EMA to identify trends and potential reversal points. For example, when a short-term EMA crosses above a long-term SMA, it might signal a buy opportunity.
Advanced Techniques by Constance Brown
Fibonacci Retracement
Use Fibonacci levels to identify potential reversal points. Brown’s methods emphasize the importance of these levels in forecasting market movements.
Elliott Wave Theory
Understand the principles of wave patterns and how they can predict future price movements. Brown’s interpretations provide practical insights into applying this complex theory.
Risk Management with Technical Analysis
Setting Stop-Loss Orders
Use technical analysis to determine optimal stop-loss levels, minimizing potential losses.
Position Sizing
Adjust your trade size based on technical analysis signals to manage risk effectively.
Diversification
Apply technical analysis across different assets to spread risk and enhance your portfolio.
Conclusion
The Illustrated Guide to Technical Analysis Signals and Phrases with Constance Brown is an invaluable resource for traders looking to deepen their understanding of market dynamics. By mastering the concepts and techniques outlined in this guide, you can enhance your trading strategies and make more informed decisions. Whether you’re a beginner or an experienced trader, this guide provides the tools and knowledge to navigate the markets with confidence.
FAQs
1. What is the primary focus of Constance Brown’s guide?
The guide focuses on explaining technical analysis signals and phrases in an easy-to-understand manner, making it accessible for traders at all levels.
2. Can this guide be useful for beginner traders?
Absolutely. The guide is designed to be user-friendly and provides a solid foundation for those new to technical analysis.
3. How does the guide help in risk management?
By teaching how to identify key support and resistance levels, set stop-loss orders, and use multiple indicators, the guide helps traders manage and mitigate risks effectively.
4. Are there practical examples in the guide?
Yes, the guide includes numerous practical examples and case studies to illustrate the application of technical analysis concepts.
5. Is backtesting important according to Constance Brown?
Yes, Brown emphasizes the importance of backtesting strategies to ensure they are effective and reliable before applying them in real trading scenarios.
Be the first to review “The Illustrated Guide to Technical Analysis Signals and Phrases with Constance Brown”
You must be logged in to post a review.
Related products

Forex Trading
Original price was: $4,997.00.$27.00Current price is: $27.00.

Forex Trading
Original price was: $999.00.$15.00Current price is: $15.00.

Original price was: $1,800.00.$54.00Current price is: $54.00.
Original price was: $695.00.$41.00Current price is: $41.00.
Forex Trading
Quantamentals – The Next Great Forefront Of Trading and Investing with Trading Markets
Original price was: $1,495.00.$8.00Current price is: $8.00.
Original price was: $999.00.$5.00Current price is: $5.00.

Original price was: $799.00.$15.00Current price is: $15.00.
Original price was: $1,849.00.$15.00Current price is: $15.00.

Forex Trading
Original price was: $697.00.$5.00Current price is: $5.00.
Forex Trading
Original price was: $1,898.00.$10.00Current price is: $10.00.
Forex Trading
Original price was: $397.00.$31.00Current price is: $31.00.

Original price was: $700.00.$39.00Current price is: $39.00.
Forex Trading
Original price was: $550.00.$5.00Current price is: $5.00.
Original price was: $895.00.$15.00Current price is: $15.00.

Original price was: $139.00.$23.00Current price is: $23.00.

Original price was: $497.00.$31.00Current price is: $31.00.

Original price was: $197.00.$5.00Current price is: $5.00.

Original price was: $299.00.$8.00Current price is: $8.00.
Original price was: $497.00.$11.00Current price is: $11.00.

Forex Trading
Original price was: $2,000.00.$23.00Current price is: $23.00.

Reviews
There are no reviews yet.