-
×
 Wyckoff 2.0: Structures, Volume Profile and Order Flow (Trading and Investing Course: Advanced Technical Analysis) by Rubén Villahermosa
1 × $5.00
Wyckoff 2.0: Structures, Volume Profile and Order Flow (Trading and Investing Course: Advanced Technical Analysis) by Rubén Villahermosa
1 × $5.00 -
×
 FX Masterclass 2.0 with Uprise Academy
1 × $26.00
FX Masterclass 2.0 with Uprise Academy
1 × $26.00 -
×
 W. D Gann 's Square Of 9 Applied To Modern Markets with Sean Avidar - Hexatrade350
1 × $23.00
W. D Gann 's Square Of 9 Applied To Modern Markets with Sean Avidar - Hexatrade350
1 × $23.00 -
×
 B.O.S.S. SPY Sniper with Pat Mitchell – Trick Trades
1 × $39.00
B.O.S.S. SPY Sniper with Pat Mitchell – Trick Trades
1 × $39.00 -
×
 Crypto Trading Academy with Cheeky Investor - Aussie Day Trader
1 × $13.00
Crypto Trading Academy with Cheeky Investor - Aussie Day Trader
1 × $13.00 -
×
 Essentials in Quantitative Trading QT01 By HangukQuant's
1 × $23.00
Essentials in Quantitative Trading QT01 By HangukQuant's
1 × $23.00 -
×
 White Phoenix’s The Smart (Money) Approach to Trading with Jayson Casper
1 × $39.00
White Phoenix’s The Smart (Money) Approach to Trading with Jayson Casper
1 × $39.00 -
×
 AI For Traders with Trading Markets
1 × $31.00
AI For Traders with Trading Markets
1 × $31.00 -
×
 Jason Bond Dvds for Traders (all 4 programs)
1 × $6.00
Jason Bond Dvds for Traders (all 4 programs)
1 × $6.00 -
×
 Gold XAUUSD Trading Strategy - The Gold Box with The Trading Guide
1 × $5.00
Gold XAUUSD Trading Strategy - The Gold Box with The Trading Guide
1 × $5.00 -
×
 Out of the Pits with Caitlin Zaloom
1 × $6.00
Out of the Pits with Caitlin Zaloom
1 × $6.00 -
×
 Profit Freedom Blueprint with High Performance Trading
1 × $5.00
Profit Freedom Blueprint with High Performance Trading
1 × $5.00 -
×
 Deep Dive Butterfly Trading Strategy Class with SJG Trades
1 × $41.00
Deep Dive Butterfly Trading Strategy Class with SJG Trades
1 × $41.00 -
×
 One Week S&P Workshop II with Linda Raschke
1 × $5.00
One Week S&P Workshop II with Linda Raschke
1 × $5.00 -
×
 $20 – 52k 20 pips a day challange with Rafał Zuchowicz - TopMasterTrader
1 × $5.00
$20 – 52k 20 pips a day challange with Rafał Zuchowicz - TopMasterTrader
1 × $5.00 -
×
 Mastering Debit Spreads with Vince Vora
1 × $15.00
Mastering Debit Spreads with Vince Vora
1 × $15.00 -
×
 Bear Trap Indicator with Markay Latimer
1 × $5.00
Bear Trap Indicator with Markay Latimer
1 × $5.00 -
×
 War Room Psychology Vol. 2 with Pat Mitchell – Trick Trades
1 × $23.00
War Room Psychology Vol. 2 with Pat Mitchell – Trick Trades
1 × $23.00 -
×
 TRADING NFX Course with Andrew NFX
1 × $5.00
TRADING NFX Course with Andrew NFX
1 × $5.00 -
×
 Sovereign Man Confidential
1 × $6.00
Sovereign Man Confidential
1 × $6.00 -
×
 Fibonacci – CCI Workshop Recording Series (2006 & 2008)
1 × $6.00
Fibonacci – CCI Workshop Recording Series (2006 & 2008)
1 × $6.00 -
×
 Home Run Options Trading Course with Dave Aquino - Base Camp Trading
1 × $11.00
Home Run Options Trading Course with Dave Aquino - Base Camp Trading
1 × $11.00 -
×
 How Charts Can Help You in the Stock Market with William Jiller
1 × $6.00
How Charts Can Help You in the Stock Market with William Jiller
1 × $6.00 -
×
 ICT Prodigy Trading Course – $650K in Payouts with Alex Solignani
1 × $15.00
ICT Prodigy Trading Course – $650K in Payouts with Alex Solignani
1 × $15.00 -
×
 Opening Range Success Formula with Geoff Bysshe
1 × $4.00
Opening Range Success Formula with Geoff Bysshe
1 × $4.00 -
×
 The Best Option Trading Course with David Jaffee - Best Stock Strategy
1 × $15.00
The Best Option Trading Course with David Jaffee - Best Stock Strategy
1 × $15.00 -
×
 Bond Market Course with The Macro Compass
1 × $15.00
Bond Market Course with The Macro Compass
1 × $15.00 -
×
 FX Simplified
1 × $5.00
FX Simplified
1 × $5.00 -
×
 The Tickmaster Indicator
1 × $54.00
The Tickmaster Indicator
1 × $54.00 -
×
 Slump Busting Techniques with Linda Raschke
1 × $4.00
Slump Busting Techniques with Linda Raschke
1 × $4.00 -
×
 Investments (6th Ed.)
1 × $6.00
Investments (6th Ed.)
1 × $6.00 -
×
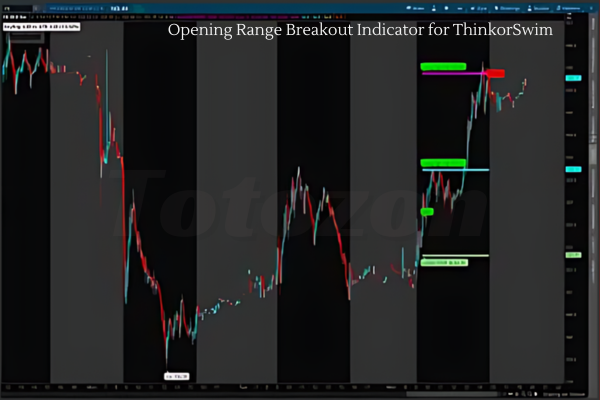 Opening Range Breakout Indicator for ThinkorSwim
1 × $6.00
Opening Range Breakout Indicator for ThinkorSwim
1 × $6.00 -
×
 Module I - Foundation with FX MindShift
1 × $6.00
Module I - Foundation with FX MindShift
1 × $6.00 -
×
 A Seminar On Ocean Theory Home Study Trading Course with Pat Raffalovich
1 × $6.00
A Seminar On Ocean Theory Home Study Trading Course with Pat Raffalovich
1 × $6.00 -
×
 Quantitative Finance & Algorithmic Trading II - Time Series with Holczer Balazs
1 × $4.00
Quantitative Finance & Algorithmic Trading II - Time Series with Holczer Balazs
1 × $4.00 -
×
 Momentum Explained. Vol.1
1 × $6.00
Momentum Explained. Vol.1
1 × $6.00 -
×
 A Plan to make $3k Monthly on $25k with Short Term Trades with Dan Sheridan
1 × $23.00
A Plan to make $3k Monthly on $25k with Short Term Trades with Dan Sheridan
1 × $23.00 -
×
 Mastering High Probability Chart Reading Methods with John Murphy
1 × $6.00
Mastering High Probability Chart Reading Methods with John Murphy
1 × $6.00 -
×
 Options Trading for the Conservative Trader with Michael Thomsett
1 × $6.00
Options Trading for the Conservative Trader with Michael Thomsett
1 × $6.00 -
×
 Letal Forex System with Alex Seeni
1 × $6.00
Letal Forex System with Alex Seeni
1 × $6.00 -
×
 Perfecting Execution and Trade Management Online Masterclass with The Trading Framework
1 × $6.00
Perfecting Execution and Trade Management Online Masterclass with The Trading Framework
1 × $6.00 -
×
 MorningSwing Method with Austin Passamonte
1 × $6.00
MorningSwing Method with Austin Passamonte
1 × $6.00 -
×
 TRADINGWITHRAYNER - PRICE ACTION TRADING INSTITUTE
1 × $23.00
TRADINGWITHRAYNER - PRICE ACTION TRADING INSTITUTE
1 × $23.00 -
×
 How to Trade a Vertical Market
1 × $93.00
How to Trade a Vertical Market
1 × $93.00 -
×
 Chicago Trading Workshop 2017 with Marketdelta
1 × $23.00
Chicago Trading Workshop 2017 with Marketdelta
1 × $23.00 -
×
 Spread Trading
1 × $6.00
Spread Trading
1 × $6.00 -
×
 Mastering The ICO: Spotting Needles In A Haystack with Alphashark
1 × $39.00
Mastering The ICO: Spotting Needles In A Haystack with Alphashark
1 × $39.00 -
×
 Gann’s Scientific Methods Unveiled (Vol I, II)
1 × $6.00
Gann’s Scientific Methods Unveiled (Vol I, II)
1 × $6.00 -
×
 Advanced Spread Trading with Guy Bower - MasterClass Trader
1 × $15.00
Advanced Spread Trading with Guy Bower - MasterClass Trader
1 × $15.00 -
×
 The Indices Orderflow Masterclass with The Forex Scalpers
1 × $23.00
The Indices Orderflow Masterclass with The Forex Scalpers
1 × $23.00 -
×
 The Instagram DM Automation Playbook with Natasha Takahashi
1 × $6.00
The Instagram DM Automation Playbook with Natasha Takahashi
1 × $6.00 -
×
 Foundations of Stock & Options. Home Study Course
1 × $6.00
Foundations of Stock & Options. Home Study Course
1 × $6.00 -
×
 Introduction to Position Sizing Strategies with Van Tharp Institute
1 × $6.00
Introduction to Position Sizing Strategies with Van Tharp Institute
1 × $6.00 -
×
 Using Options to Buy Stocks: Build Wealth with Little Risk and No Capital - Dennis Eisen
1 × $4.00
Using Options to Buy Stocks: Build Wealth with Little Risk and No Capital - Dennis Eisen
1 × $4.00 -
×
 Active Investing courses notes with Alan Hull
1 × $6.00
Active Investing courses notes with Alan Hull
1 × $6.00 -
×
 Quantamentals - The Next Great Forefront Of Trading and Investing with Trading Markets
1 × $8.00
Quantamentals - The Next Great Forefront Of Trading and Investing with Trading Markets
1 × $8.00 -
×
 TCG Educational Course Bundle Entries & Exits + Trading
1 × $23.00
TCG Educational Course Bundle Entries & Exits + Trading
1 × $23.00 -
×
 Ichimoku Cloud Triple Confirmation Indicator and Scan with AlphaShark
1 × $31.00
Ichimoku Cloud Triple Confirmation Indicator and Scan with AlphaShark
1 × $31.00 -
×
 Pivot Day Trader for NinjaTrader
1 × $31.00
Pivot Day Trader for NinjaTrader
1 × $31.00 -
×
 Trading to Win with Ari Kiev
1 × $6.00
Trading to Win with Ari Kiev
1 × $6.00 -
×
 How to Make Money in Deflationary Markets with Gary Shilling
1 × $6.00
How to Make Money in Deflationary Markets with Gary Shilling
1 × $6.00 -
×
 The Trading Blueprint with Brad Goh - The Trading Geek
1 × $5.00
The Trading Blueprint with Brad Goh - The Trading Geek
1 × $5.00 -
×
 Cycle Hunter Books 1-3 with Brian James Sklenka
1 × $6.00
Cycle Hunter Books 1-3 with Brian James Sklenka
1 × $6.00 -
×
 Best of the Best: Collars with Amy Meissner & Scott Ruble
1 × $15.00
Best of the Best: Collars with Amy Meissner & Scott Ruble
1 × $15.00 -
×
 Market Stalkers Level 1 - Swing trading school (2020)
1 × $8.00
Market Stalkers Level 1 - Swing trading school (2020)
1 × $8.00 -
×
 Modern Portfolio Theory and Investment Analysis (7th Edition) with Edwin Elton, Martin Gruber, Stephen Brown & William Goetzmann
1 × $6.00
Modern Portfolio Theory and Investment Analysis (7th Edition) with Edwin Elton, Martin Gruber, Stephen Brown & William Goetzmann
1 × $6.00 -
×
 The A14 Weekly Option Strategy Workshop with Amy Meissner
1 × $23.00
The A14 Weekly Option Strategy Workshop with Amy Meissner
1 × $23.00 -
×
 Level 1 - Japanese Candlesticks Trading Mastery Program with Rohit Musale & Rashmi Musale
1 × $5.00
Level 1 - Japanese Candlesticks Trading Mastery Program with Rohit Musale & Rashmi Musale
1 × $5.00 -
×
 Ultimate Trading Course with Dodgy's Dungeon
1 × $8.00
Ultimate Trading Course with Dodgy's Dungeon
1 × $8.00

Team Candlecharts Trading Strategies with Candle Charts
Original price was: $395.00.$31.00Current price is: $31.00.
File Size: 142.9 MB
Delivery Time: 1–12 hours
Media Type: Online Course
Content Proof: Watch Here!
You may check content proof of “Team Candlecharts Trading Strategies with Candle Charts” below:

Team Candlecharts Trading Strategies By Candle Charts
Introduction to Team Candlecharts
Trading in the financial markets requires a blend of knowledge, skill, and strategy. Team Candlecharts Trading Strategies by Candle Charts is designed to equip traders with the tools and insights needed to navigate these markets successfully. By leveraging the power of candlestick charting techniques, traders can make more informed decisions and enhance their trading performance.
Understanding Candlestick Charting
What Are Candlestick Charts?
Candlestick charts are a type of financial chart used to describe price movements of a security, derivative, or currency. Each candlestick typically shows one day, although time periods can vary.
Components of a Candlestick
- Body: Represents the range between the opening and closing prices.
- Wicks: The lines above and below the body, indicating the high and low prices.
- Color: Indicates whether the closing price was higher (usually green or white) or lower (usually red or black) than the opening price.
Why Use Candlestick Charts?
Visual Appeal
Candlestick charts provide a visual representation of price movements, making it easier to spot trends and patterns.
Historical Significance
The use of candlestick charts dates back to 18th century Japan, where they were used by rice traders to predict future price movements. Their historical reliability makes them a trusted tool in modern trading.
Core Strategies by Team Candlecharts
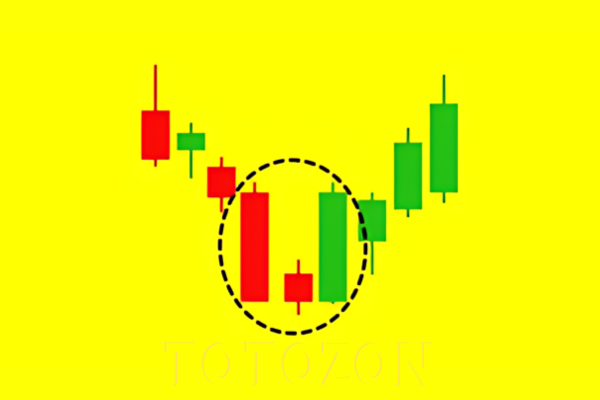
The Power of Reversal Patterns
Engulfing Patterns
- Bullish Engulfing: Indicates a potential reversal in an existing downtrend.
- Bearish Engulfing: Suggests a possible reversal in an existing uptrend.
Doji Patterns
- Gravestone Doji: Signals a possible reversal when found at the top of an uptrend.
- Dragonfly Doji: Indicates potential bullish reversal when found at the bottom of a downtrend.
The Role of Continuation Patterns
Rising Three Methods
A bullish continuation pattern that suggests the uptrend will continue.
Falling Three Methods
A bearish continuation pattern that indicates the downtrend will persist.
Incorporating Technical Indicators
Moving Averages
- Simple Moving Average (SMA): Helps identify the overall trend direction.
- Exponential Moving Average (EMA): Places more weight on recent prices, making it more responsive to new information.
Relative Strength Index (RSI)
Measures the speed and change of price movements, indicating overbought or oversold conditions.
Moving Average Convergence Divergence (MACD)
A trend-following momentum indicator that shows the relationship between two moving averages of a security’s price.
Risk Management in Trading
Importance of Risk Management
Effective risk management is crucial to preserve capital and ensure long-term trading success. Without it, even the best strategies can lead to significant losses.
Risk Management Techniques
- Stop-Loss Orders: Automatically sell a position at a predetermined price to limit losses.
- Position Sizing: Determine the appropriate amount to invest in each trade to manage risk exposure.
- Diversification: Spread investments across various assets to reduce risk.
The Benefits of Team Candlecharts
Expert Guidance
Team Candlecharts provides expert guidance from seasoned traders who have mastered the art of candlestick charting.
Educational Resources
- Webinars and Workshops: Interactive sessions to enhance your understanding of trading strategies.
- Training Videos: Comprehensive video tutorials covering various aspects of trading.
- E-books and Articles: In-depth written materials to support continuous learning.
Community Support
Being part of the Team Candlecharts community offers valuable support and insights from fellow traders. This collaborative environment fosters learning and growth.
Real-World Applications
Success Stories
Numerous traders have benefited from the strategies taught by Team Candlecharts. Here are a few testimonials:
- Alex J.: “Using candlestick patterns, I’ve been able to improve my entry and exit points significantly.”
- Samantha L.: “The strategies taught by Team Candlecharts have transformed my trading approach.”
Case Studies
Detailed case studies demonstrate how traders have applied these strategies to achieve substantial gains in the market.
Getting Started with Team Candlecharts
Enrollment Process
- Visit the Candle Charts Website: Navigate to the official Candle Charts website.
- Select a Program: Choose the trading program that best suits your needs.
- Complete Registration: Fill in the necessary details and complete the registration process.
- Access Materials: Gain immediate access to the educational resources and start learning.
Additional Support
- Customer Service: Contact Candle Charts for any queries or support.
- Online Forums: Engage with other traders to share insights and strategies.
Conclusion
Team Candlecharts Trading Strategies by Candle Charts offers a comprehensive approach to trading using candlestick charting techniques. By understanding and applying these strategies, traders can enhance their decision-making and improve their trading outcomes. Whether you are a beginner or an experienced trader, the resources and community support provided by Team Candlecharts can help you achieve your trading goals.
Frequently Asked Questions
1. What are candlestick charts?
Candlestick charts are a type of financial chart used to describe price movements of a security, derivative, or currency.
2. Why are candlestick charts effective?
Candlestick charts are visually appealing and have a historical significance, making them a reliable tool for predicting price movements.
3. What are some key candlestick patterns?
Key patterns include bullish and bearish engulfing patterns, gravestone and dragonfly doji, and rising and falling three methods.
4. How important is risk management in trading?
Risk management is crucial to preserve capital and ensure long-term success in trading.
5. How can I start learning from Team Candlecharts?
You can start by visiting the Candle Charts website, selecting a program, and completing the registration process.
Be the first to review “Team Candlecharts Trading Strategies with Candle Charts”
You must be logged in to post a review.
Related products

Original price was: $997.00.$8.00Current price is: $8.00.

Forex Trading
Original price was: $125.00.$17.00Current price is: $17.00.
Original price was: $895.00.$15.00Current price is: $15.00.
Original price was: $450.00.$23.00Current price is: $23.00.

Original price was: $649.00.$20.00Current price is: $20.00.
Forex Trading
Original price was: $850.00.$23.00Current price is: $23.00.
Original price was: $1,849.00.$15.00Current price is: $15.00.
Original price was: $700.00.$39.00Current price is: $39.00.
Forex Trading
Original price was: $697.00.$5.00Current price is: $5.00.

Original price was: $999.00.$5.00Current price is: $5.00.

Forex Trading
Original price was: $2,000.00.$23.00Current price is: $23.00.
Original price was: $139.00.$23.00Current price is: $23.00.
Forex Trading
Quantamentals – The Next Great Forefront Of Trading and Investing with Trading Markets
Original price was: $1,495.00.$8.00Current price is: $8.00.
Forex Trading
Original price was: $239.00.$8.00Current price is: $8.00.
Original price was: $310.00.$23.00Current price is: $23.00.

Original price was: $299.00.$8.00Current price is: $8.00.

Original price was: $4,995.00.$15.00Current price is: $15.00.
Forex Trading
Original price was: $499.00.$15.00Current price is: $15.00.

Forex Trading
Original price was: $1,098.00.$39.00Current price is: $39.00.
Original price was: $695.00.$41.00Current price is: $41.00.

Reviews
There are no reviews yet.