-
×
 The Adventures of the Cycle Hunter. The Trader with Craig Bttlc
1 × $6.00
The Adventures of the Cycle Hunter. The Trader with Craig Bttlc
1 × $6.00 -
×
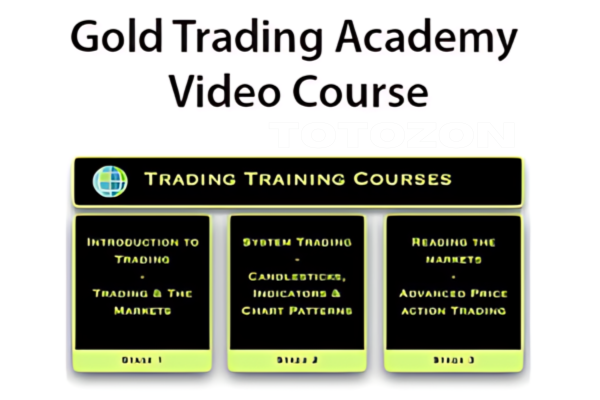 Gold Trading Academy Video Course
1 × $23.00
Gold Trading Academy Video Course
1 × $23.00 -
×
 Trading For A Living Course with Yvan Byeajee - Trading Composure
1 × $6.00
Trading For A Living Course with Yvan Byeajee - Trading Composure
1 × $6.00 -
×
 How to Trade Forex & Cryptocurrency with Bitraged
1 × $5.00
How to Trade Forex & Cryptocurrency with Bitraged
1 × $5.00 -
×
 How to Find the Most Profitable Stocks with Mubarak Shah
1 × $6.00
How to Find the Most Profitable Stocks with Mubarak Shah
1 × $6.00 -
×
 Consistently Profitable Trader with Pollinate Trading
1 × $13.00
Consistently Profitable Trader with Pollinate Trading
1 × $13.00 -
×
 Systems Mastery Course with Chris Dover - Pollinate Trading
1 × $5.00
Systems Mastery Course with Chris Dover - Pollinate Trading
1 × $5.00 -
×
 Strategy, Value and Risk - The Real Options Approach with Jamie Rogers
1 × $6.00
Strategy, Value and Risk - The Real Options Approach with Jamie Rogers
1 × $6.00 -
×
 Mastering Candlestick Charts II with Greg Capra
1 × $6.00
Mastering Candlestick Charts II with Greg Capra
1 × $6.00 -
×
 Options Trading. The Hidden Reality Course with Charles Cottle
1 × $6.00
Options Trading. The Hidden Reality Course with Charles Cottle
1 × $6.00 -
×
 Practical Approach to Trend Following By Rajandran R
1 × $15.00
Practical Approach to Trend Following By Rajandran R
1 × $15.00 -
×
 DFX Scalping Strategy Course with Disciplined FX
1 × $23.00
DFX Scalping Strategy Course with Disciplined FX
1 × $23.00 -
×
 The Complete Guide to Multiple Time Frame Analysis & Reading Price Action with Aiman Almansoori
1 × $13.00
The Complete Guide to Multiple Time Frame Analysis & Reading Price Action with Aiman Almansoori
1 × $13.00 -
×
 Essentials Course & Day Trading Strategies with Bear Bull Traders
1 × $13.00
Essentials Course & Day Trading Strategies with Bear Bull Traders
1 × $13.00 -
×
 Supply and Demand Video Course with JamesFXS
1 × $13.00
Supply and Demand Video Course with JamesFXS
1 × $13.00 -
×
 Contrarian Investment Strategies: The Next Generation with David Dreman
1 × $4.00
Contrarian Investment Strategies: The Next Generation with David Dreman
1 × $4.00 -
×
 Edz Currency Trading Package with EDZ Trading Academy
1 × $5.00
Edz Currency Trading Package with EDZ Trading Academy
1 × $5.00 -
×
 The A14 Weekly Option Strategy Workshop with Amy Meissner
1 × $23.00
The A14 Weekly Option Strategy Workshop with Amy Meissner
1 × $23.00 -
×
 Profiletraders - Market Profile Day Trading
1 × $15.00
Profiletraders - Market Profile Day Trading
1 × $15.00 -
×
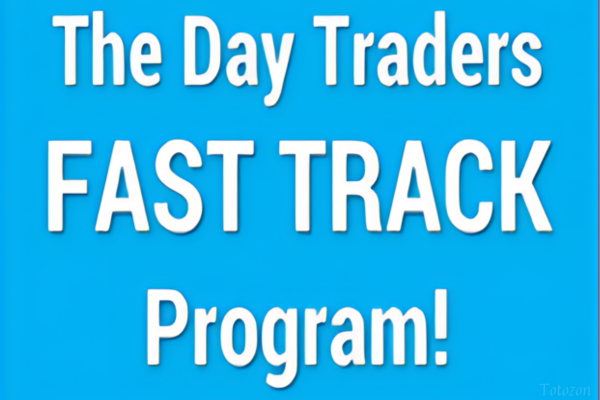 The Day Traders Fast Track Program
1 × $23.00
The Day Traders Fast Track Program
1 × $23.00 -
×
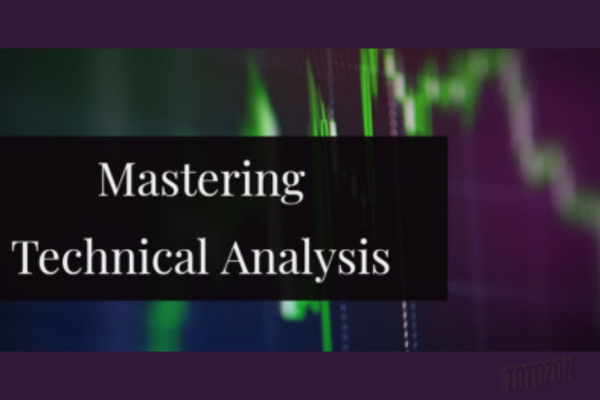 Mastering Technical Analysis with Investi Share
1 × $23.00
Mastering Technical Analysis with Investi Share
1 × $23.00 -
×
 Principles of Artificial Neural Networks (2nd Ed.) with Daniel Graupe
1 × $6.00
Principles of Artificial Neural Networks (2nd Ed.) with Daniel Graupe
1 × $6.00 -
×
 How To Write High Converting Copy with Tej Dosa
1 × $6.00
How To Write High Converting Copy with Tej Dosa
1 × $6.00 -
×
 Dynamic Time Cycles with Peter Eliades
1 × $6.00
Dynamic Time Cycles with Peter Eliades
1 × $6.00 -
×
 How to Buy Stocks Before They Skyrocket
1 × $6.00
How to Buy Stocks Before They Skyrocket
1 × $6.00 -
×
 Technical Analysis & Options Strategies with K.H.Shaleen
1 × $6.00
Technical Analysis & Options Strategies with K.H.Shaleen
1 × $6.00 -
×
 Advanced Strategies for Option Trading Success with James Bittman
1 × $6.00
Advanced Strategies for Option Trading Success with James Bittman
1 × $6.00 -
×
 Drewize Banks Course
1 × $5.00
Drewize Banks Course
1 × $5.00 -
×
 Ezaih Academy 2024 Mentorship with Ezaih
1 × $54.00
Ezaih Academy 2024 Mentorship with Ezaih
1 × $54.00 -
×
 Learn how to trade Volatility 75 Index Technical Analysis with Patrick Muke
1 × $6.00
Learn how to trade Volatility 75 Index Technical Analysis with Patrick Muke
1 × $6.00 -
×
 Swing Trading Futures & Commodities with the COT
1 × $93.00
Swing Trading Futures & Commodities with the COT
1 × $93.00 -
×
 Learn Investing & Trading with Danny Devan
1 × $23.00
Learn Investing & Trading with Danny Devan
1 × $23.00 -
×
 Quantitative Trading and Money Management, Revised Edition (5th Edition) with Fred Gehm
1 × $6.00
Quantitative Trading and Money Management, Revised Edition (5th Edition) with Fred Gehm
1 × $6.00 -
×
 The Geography of Money with Benjamin J.Cohen
1 × $6.00
The Geography of Money with Benjamin J.Cohen
1 × $6.00 -
×
 Best of the Best: Collars with Amy Meissner & Scott Ruble
1 × $15.00
Best of the Best: Collars with Amy Meissner & Scott Ruble
1 × $15.00 -
×
 The Instagram DM Automation Playbook with Natasha Takahashi
1 × $6.00
The Instagram DM Automation Playbook with Natasha Takahashi
1 × $6.00 -
×
 Lazy Emini Trader Master Class Course - David Frost
1 × $10.00
Lazy Emini Trader Master Class Course - David Frost
1 × $10.00 -
×
 High Probability Trading Using Elliott Wave And Fibonacci Analysis withVic Patel - Forex Training Group
1 × $10.00
High Probability Trading Using Elliott Wave And Fibonacci Analysis withVic Patel - Forex Training Group
1 × $10.00 -
×
 European Members - March 2023 with Stockbee
1 × $5.00
European Members - March 2023 with Stockbee
1 × $5.00 -
×
 Geometric Angles Applied To Modern Markets with Sean Avidar
1 × $39.00
Geometric Angles Applied To Modern Markets with Sean Avidar
1 × $39.00 -
×
 The Internet Trading Course with Alpesh Patel
1 × $6.00
The Internet Trading Course with Alpesh Patel
1 × $6.00 -
×
 Equity Research and Valuation Techniques with Kemp Dolliver
1 × $6.00
Equity Research and Valuation Techniques with Kemp Dolliver
1 × $6.00 -
×
 George Bayer Squarring the Circle for Excel
1 × $6.00
George Bayer Squarring the Circle for Excel
1 × $6.00 -
×
 Futures 101: An Introduction to Futures Contracts Class with Don Kaufman
1 × $6.00
Futures 101: An Introduction to Futures Contracts Class with Don Kaufman
1 × $6.00 -
×
 Seasonal Stock Market Trends: The Definitive Guide to Calendar‐Based Stock Market Trading with Jay Kaeppel
1 × $6.00
Seasonal Stock Market Trends: The Definitive Guide to Calendar‐Based Stock Market Trading with Jay Kaeppel
1 × $6.00 -
×
 An Ultimate Guide to Successful Investing with Trading Tuitions
1 × $23.00
An Ultimate Guide to Successful Investing with Trading Tuitions
1 × $23.00 -
×
 Commodities for Dummies with Amine Bouchentouf
1 × $6.00
Commodities for Dummies with Amine Bouchentouf
1 × $6.00 -
×
 The Crypto Code with Joel Peterson - Adam Short
1 × $15.00
The Crypto Code with Joel Peterson - Adam Short
1 × $15.00 -
×
 White Phoenix’s The Smart (Money) Approach to Trading with Jayson Casper
1 × $39.00
White Phoenix’s The Smart (Money) Approach to Trading with Jayson Casper
1 × $39.00

3 Swing Trading Examples, With Charts, Instructions, And Definitions To Get You Started by Alan Farley
$6.00
File Size: Cooming soon!
Delivery Time: 1–12 hours
Media Type: Online Course
Content Proof: Watch Here!
You may check content proof of “3 Swing Trading Examples, With Charts, Instructions, And Definitions To Get You Started by Alan Farley” below:

3 Swing Trading Examples, With Charts, Instructions, And Definitions To Get You Started by Alan Farley
Introduction
Swing trading is a popular strategy for capturing short- to medium-term gains in the stock market. Alan Farley, a seasoned trading expert, provides insightful examples that can help beginners and experienced traders alike. This article will walk you through three swing trading examples with charts, detailed instructions, and key definitions to get you started on your trading journey.
What is Swing Trading?
Definition
Swing trading involves holding positions for several days to weeks, aiming to profit from price swings. This strategy capitalizes on short-term trends and market volatility.
Why Choose Swing Trading?
Swing trading offers flexibility and requires less time commitment compared to day trading, making it suitable for individuals with other commitments.
Key Terms in Swing Trading
1. Entry Point
The price at which a trader buys a stock, initiating the trade.
2. Exit Point
The price at which a trader sells a stock, concluding the trade.
3. Stop-Loss Order
An order placed to sell a stock when it reaches a certain price, limiting potential losses.
4. Resistance Level
A price level at which a stock tends to stop rising, encountering selling pressure.
5. Support Level
A price level at which a stock tends to stop falling, encountering buying interest.
Swing Trading Example 1: Moving Average Crossover
Step-by-Step Instructions
1. Identify the Moving Averages
Use a 50-day simple moving average (SMA) and a 200-day SMA. These averages help identify the overall trend.
2. Look for a Crossover
A bullish signal occurs when the 50-day SMA crosses above the 200-day SMA, indicating a potential uptrend.
3. Enter the Trade
Buy the stock when the crossover is confirmed.
4. Set a Stop-Loss Order
Place a stop-loss order below a recent support level to manage risk.
5. Determine the Exit Point
Sell the stock when the 50-day SMA crosses below the 200-day SMA, indicating a potential downtrend.
Chart Example
Swing Trading Example 2: RSI Overbought/Oversold
Step-by-Step Instructions
1. Set Up the RSI Indicator
Use the Relative Strength Index (RSI) with a 14-day period. RSI measures the speed and change of price movements.
2. Identify Overbought/Oversold Conditions
RSI values above 70 indicate overbought conditions, while values below 30 indicate oversold conditions.
3. Enter the Trade
- Buy Signal: When RSI moves below 30 and then rises back above it, indicating the stock is recovering from oversold conditions.
- Sell Signal: When RSI moves above 70 and then falls back below it, indicating the stock is retreating from overbought conditions.
4. Set a Stop-Loss Order
Place a stop-loss order below the recent low for a buy signal or above the recent high for a sell signal.
5. Determine the Exit Point
Exit the trade when RSI returns to neutral levels (typically around 50) or if a stop-loss is triggered.
Chart Example
Swing Trading Example 3: Cup and Handle Pattern
Step-by-Step Instructions
1. Identify the Pattern
Look for a “cup” shape on the price chart, followed by a small consolidation forming the “handle.”
2. Confirm the Pattern
The cup should be U-shaped and not too deep, with the handle forming near the cup’s high point.
3. Enter the Trade
Buy the stock when the price breaks out above the handle’s resistance level.
4. Set a Stop-Loss Order
Place a stop-loss order below the bottom of the handle to manage risk.
5. Determine the Exit Point
Sell the stock at a predetermined profit target, often calculated as the height of the cup added to the breakout point.
Chart Example
Conclusion
Swing trading can be a highly effective strategy for capturing gains in the stock market. By following Alan Farley’s examples and using the right technical tools, you can enhance your trading skills and increase your chances of success. Remember, consistency and risk management are key to profitable trading.
FAQs
1. What is the best time frame for swing trading?
Swing trading typically involves holding positions for several days to weeks, so daily and weekly charts are most useful.
2. How much capital do I need to start swing trading?
The amount of capital needed can vary, but starting with at least $5,000 to $10,000 is recommended to allow for diversification and risk management.
3. Can swing trading be automated?
Yes, many traders use automated trading systems and algorithms to execute swing trades based on predefined criteria.
4. How do I choose the right stocks for swing trading?
Look for stocks with high liquidity, clear trends, and significant price swings. Screen for technical indicators that align with your strategy.
5. Is swing trading suitable for beginners?
Swing trading can be suitable for beginners, especially those who take the time to learn and practice basic trading principles and risk management.
Be the first to review “3 Swing Trading Examples, With Charts, Instructions, And Definitions To Get You Started by Alan Farley”
You must be logged in to post a review.
Related products
Forex Trading
Original price was: $1,898.00.$10.00Current price is: $10.00.

Forex Trading
Quantamentals – The Next Great Forefront Of Trading and Investing with Trading Markets
Original price was: $1,495.00.$8.00Current price is: $8.00.

Forex Trading
Original price was: $2,000.00.$23.00Current price is: $23.00.
Forex Trading
Original price was: $797.00.$10.00Current price is: $10.00.

Forex Trading
Original price was: $2,995.00.$31.00Current price is: $31.00.
Original price was: $310.00.$23.00Current price is: $23.00.

Original price was: $197.00.$5.00Current price is: $5.00.

Original price was: $497.00.$11.00Current price is: $11.00.

Original price was: $2,120.00.$15.00Current price is: $15.00.

Forex Trading
Original price was: $999.00.$15.00Current price is: $15.00.

Forex Trading
Original price was: $550.00.$5.00Current price is: $5.00.

Forex Trading
Original price was: $397.00.$31.00Current price is: $31.00.

Original price was: $497.00.$31.00Current price is: $31.00.

Original price was: $997.00.$13.00Current price is: $13.00.

Original price was: $1,849.00.$15.00Current price is: $15.00.

Forex Trading
Original price was: $850.00.$23.00Current price is: $23.00.

Forex Trading
Original price was: $500.00.$5.00Current price is: $5.00.

Original price was: $139.00.$23.00Current price is: $23.00.
Original price was: $799.00.$15.00Current price is: $15.00.
Forex Trading
The Complete Guide to Multiple Time Frame Analysis & Reading Price Action with Aiman Almansoori
Original price was: $1,399.00.$13.00Current price is: $13.00.

Reviews
There are no reviews yet.