-
×
 Trading as a Business with Alexander Elder
1 × $6.00
Trading as a Business with Alexander Elder
1 × $6.00 -
×
 Traders Secret Success Package. Symmetry Wave Trading with Michael Gur Dillon
1 × $6.00
Traders Secret Success Package. Symmetry Wave Trading with Michael Gur Dillon
1 × $6.00 -
×
 Technical Analysis 101: A Comprehensive Guide to Becoming a Better Trader Class with Jeff Bierman
1 × $6.00
Technical Analysis 101: A Comprehensive Guide to Becoming a Better Trader Class with Jeff Bierman
1 × $6.00 -
×
 How to Call the Top in a Stock (To the Penny!) and Earn 9-11% Annualized Cash Yields Doing It with Dan Ferris
1 × $6.00
How to Call the Top in a Stock (To the Penny!) and Earn 9-11% Annualized Cash Yields Doing It with Dan Ferris
1 × $6.00 -
×
 Create Your Own ETF Hedge Fund: A Do-It-Yourself ETF Strategy for Private Wealth Management with David Fry
1 × $6.00
Create Your Own ETF Hedge Fund: A Do-It-Yourself ETF Strategy for Private Wealth Management with David Fry
1 × $6.00 -
×
 Sacredscience - W.F.Whitehead – Occultism Simplified
1 × $6.00
Sacredscience - W.F.Whitehead – Occultism Simplified
1 × $6.00 -
×
 Dynamic Time Cycles with Peter Eliades
1 × $6.00
Dynamic Time Cycles with Peter Eliades
1 × $6.00 -
×
 FasTrack Premium with Note Conference
1 × $78.00
FasTrack Premium with Note Conference
1 × $78.00 -
×
 The Trading Blueprint with Brad Goh - The Trading Geek
1 × $5.00
The Trading Blueprint with Brad Goh - The Trading Geek
1 × $5.00 -
×
 Ron Wagner – Creating a Profitable Trading & Investing Plan. 6 Key Components with Pristine
1 × $4.00
Ron Wagner – Creating a Profitable Trading & Investing Plan. 6 Key Components with Pristine
1 × $4.00 -
×
 Relationship of the StockMarket Fluctuations to the Lunarcycle with Frank J.Guarino
1 × $6.00
Relationship of the StockMarket Fluctuations to the Lunarcycle with Frank J.Guarino
1 × $6.00 -
×
 Secrets of An Electronic Futures Trader with Larry Levin
1 × $6.00
Secrets of An Electronic Futures Trader with Larry Levin
1 × $6.00 -
×
 Futures Trading Secrets Home Study with Bill McCready
1 × $6.00
Futures Trading Secrets Home Study with Bill McCready
1 × $6.00 -
×
 Power Index Method for Profitable Futures Trading with Harold Goldberg
1 × $6.00
Power Index Method for Profitable Futures Trading with Harold Goldberg
1 × $6.00 -
×
 A Game Plan for Investing in the 21st Century with Thomas J.Dorsey
1 × $6.00
A Game Plan for Investing in the 21st Century with Thomas J.Dorsey
1 × $6.00 -
×
 Cecil Robles Advent Forex Course & Indicators with Adventforex
1 × $6.00
Cecil Robles Advent Forex Course & Indicators with Adventforex
1 × $6.00 -
×
 Tharp Think Essentials Video Workshop with Van Tharp
1 × $5.00
Tharp Think Essentials Video Workshop with Van Tharp
1 × $5.00 -
×
 The Aime Workshop with Clay Marafiote
1 × $6.00
The Aime Workshop with Clay Marafiote
1 × $6.00 -
×
 Quant Edge with T3 Live
1 × $6.00
Quant Edge with T3 Live
1 × $6.00 -
×
 Studies in Stock Speculation (Volume I & II) with H.J.Wolf
1 × $6.00
Studies in Stock Speculation (Volume I & II) with H.J.Wolf
1 × $6.00 -
×
 Edz Currency Trading Package with EDZ Trading Academy
1 × $5.00
Edz Currency Trading Package with EDZ Trading Academy
1 × $5.00 -
×
 Electronic Day Traders' Secrets: Learn From the Best of the Best DayTraders with Burton Friedfertig
1 × $6.00
Electronic Day Traders' Secrets: Learn From the Best of the Best DayTraders with Burton Friedfertig
1 × $6.00 -
×
 Five Trading Trends of 2005 with Dan Denning
1 × $6.00
Five Trading Trends of 2005 with Dan Denning
1 × $6.00 -
×
 Managing By The Greeks (6 Classes) Sept 2010 [9 Videos(mp4) 11 docs(pdf)] by Dan Sheridan
1 × $6.00
Managing By The Greeks (6 Classes) Sept 2010 [9 Videos(mp4) 11 docs(pdf)] by Dan Sheridan
1 × $6.00 -
×
 Rounded Bottom Breakout Multimedia Course
1 × $31.00
Rounded Bottom Breakout Multimedia Course
1 × $31.00 -
×
 After Hour Trading Made Easy with Joe Duarte & Roland Burke
1 × $6.00
After Hour Trading Made Easy with Joe Duarte & Roland Burke
1 × $6.00 -
×
 Geometry of Markets I with Bruce Gilmore
1 × $6.00
Geometry of Markets I with Bruce Gilmore
1 × $6.00 -
×
 Gann Course (Video & Audio 1.1 GB)
1 × $6.00
Gann Course (Video & Audio 1.1 GB)
1 × $6.00 -
×
 Quantitative Trading and Money Management, Revised Edition (5th Edition) with Fred Gehm
1 × $6.00
Quantitative Trading and Money Management, Revised Edition (5th Edition) with Fred Gehm
1 × $6.00 -
×
 Trading Masterclass POTM + PFTM + PTMI with Anton Kreil
1 × $6.00
Trading Masterclass POTM + PFTM + PTMI with Anton Kreil
1 × $6.00 -
×
 Developing the Psychological Trader’s Edge with Robin Dayne
1 × $6.00
Developing the Psychological Trader’s Edge with Robin Dayne
1 × $6.00 -
×
 The Hedge Bundle - SpotGamma Academy with Imran Lakha
1 × $8.00
The Hedge Bundle - SpotGamma Academy with Imran Lakha
1 × $8.00 -
×
 Pristine - Oliver Velez – Swing Trading Tactics 2001
1 × $6.00
Pristine - Oliver Velez – Swing Trading Tactics 2001
1 × $6.00 -
×
 Profit Before Work System with John Piper
1 × $6.00
Profit Before Work System with John Piper
1 × $6.00 -
×
 Hedge Fund Market Wizards: How Winning Traders Win with Jack Schwager
1 × $6.00
Hedge Fund Market Wizards: How Winning Traders Win with Jack Schwager
1 × $6.00 -
×
 Contrarian Investing with Anthony M.Gallea, William Patalon
1 × $6.00
Contrarian Investing with Anthony M.Gallea, William Patalon
1 × $6.00 -
×
 Selling Options For A Living Class with Don Kaufman
1 × $6.00
Selling Options For A Living Class with Don Kaufman
1 × $6.00 -
×
 Stock Market–Swing Trading Strategies for Wall Street with Bill Wermin
1 × $6.00
Stock Market–Swing Trading Strategies for Wall Street with Bill Wermin
1 × $6.00 -
×
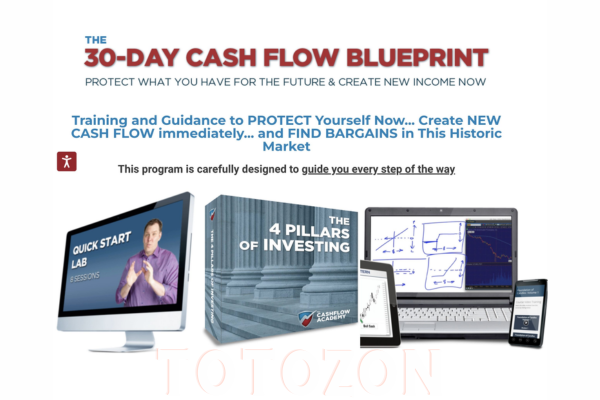 The 30-Day Cash Flow Blueprint with Andy Tanner
1 × $31.00
The 30-Day Cash Flow Blueprint with Andy Tanner
1 × $31.00 -
×
 LT Pulse and LT Trend/Ultra
1 × $23.00
LT Pulse and LT Trend/Ultra
1 × $23.00 -
×
 Alternative Beta Strategies & Hedge Fund Replication with Lars Jaeger & Jeffrey Pease
1 × $6.00
Alternative Beta Strategies & Hedge Fund Replication with Lars Jaeger & Jeffrey Pease
1 × $6.00 -
×
 Get to know the VIX Index (aka The Fear Index)
1 × $15.00
Get to know the VIX Index (aka The Fear Index)
1 × $15.00 -
×
 Bird Watch in Lion Country 2010 Ed with Dirk Du Toit
1 × $6.00
Bird Watch in Lion Country 2010 Ed with Dirk Du Toit
1 × $6.00 -
×
 A Seminar On Ocean Theory Home Study Trading Course with Pat Raffalovich
1 × $6.00
A Seminar On Ocean Theory Home Study Trading Course with Pat Raffalovich
1 × $6.00 -
×
 The Orderflow Masterclass with PrimeTrading
1 × $17.00
The Orderflow Masterclass with PrimeTrading
1 × $17.00 -
×
 Peak Capital Trading Bootcamp with Andrew Aziz
1 × $5.00
Peak Capital Trading Bootcamp with Andrew Aziz
1 × $5.00 -
×
 Get 95% Win Rate With The Triple Candy Method - Eden
1 × $5.00
Get 95% Win Rate With The Triple Candy Method - Eden
1 × $5.00 -
×
 Master Fibonacci, Symmetry & Consistent Profitable Trading with Day Trading Zones
1 × $23.00
Master Fibonacci, Symmetry & Consistent Profitable Trading with Day Trading Zones
1 × $23.00 -
×
 The Orderflows Trade Opportunities Encyclopedia with Michael Valtos
1 × $8.00
The Orderflows Trade Opportunities Encyclopedia with Michael Valtos
1 × $8.00

3 Swing Trading Examples, With Charts, Instructions, And Definitions To Get You Started by Alan Farley
$6.00
File Size: Cooming soon!
Delivery Time: 1–12 hours
Media Type: Online Course
Content Proof: Watch Here!
You may check content proof of “3 Swing Trading Examples, With Charts, Instructions, And Definitions To Get You Started by Alan Farley” below:

3 Swing Trading Examples, With Charts, Instructions, And Definitions To Get You Started by Alan Farley
Introduction
Swing trading is a popular strategy for capturing short- to medium-term gains in the stock market. Alan Farley, a seasoned trading expert, provides insightful examples that can help beginners and experienced traders alike. This article will walk you through three swing trading examples with charts, detailed instructions, and key definitions to get you started on your trading journey.
What is Swing Trading?
Definition
Swing trading involves holding positions for several days to weeks, aiming to profit from price swings. This strategy capitalizes on short-term trends and market volatility.
Why Choose Swing Trading?
Swing trading offers flexibility and requires less time commitment compared to day trading, making it suitable for individuals with other commitments.
Key Terms in Swing Trading
1. Entry Point
The price at which a trader buys a stock, initiating the trade.
2. Exit Point
The price at which a trader sells a stock, concluding the trade.
3. Stop-Loss Order
An order placed to sell a stock when it reaches a certain price, limiting potential losses.
4. Resistance Level
A price level at which a stock tends to stop rising, encountering selling pressure.
5. Support Level
A price level at which a stock tends to stop falling, encountering buying interest.
Swing Trading Example 1: Moving Average Crossover
Step-by-Step Instructions
1. Identify the Moving Averages
Use a 50-day simple moving average (SMA) and a 200-day SMA. These averages help identify the overall trend.
2. Look for a Crossover
A bullish signal occurs when the 50-day SMA crosses above the 200-day SMA, indicating a potential uptrend.
3. Enter the Trade
Buy the stock when the crossover is confirmed.
4. Set a Stop-Loss Order
Place a stop-loss order below a recent support level to manage risk.
5. Determine the Exit Point
Sell the stock when the 50-day SMA crosses below the 200-day SMA, indicating a potential downtrend.
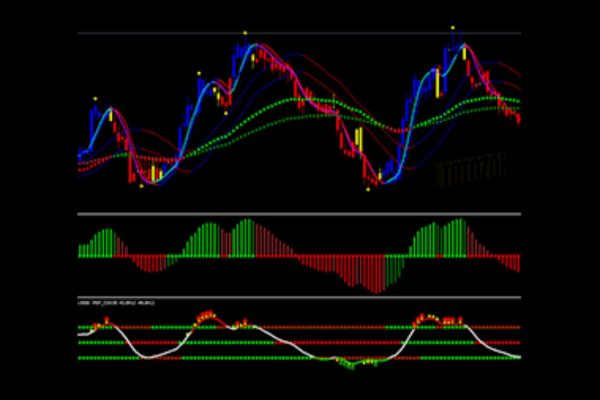
Chart Example
Swing Trading Example 2: RSI Overbought/Oversold
Step-by-Step Instructions
1. Set Up the RSI Indicator
Use the Relative Strength Index (RSI) with a 14-day period. RSI measures the speed and change of price movements.
2. Identify Overbought/Oversold Conditions
RSI values above 70 indicate overbought conditions, while values below 30 indicate oversold conditions.
3. Enter the Trade
- Buy Signal: When RSI moves below 30 and then rises back above it, indicating the stock is recovering from oversold conditions.
- Sell Signal: When RSI moves above 70 and then falls back below it, indicating the stock is retreating from overbought conditions.
4. Set a Stop-Loss Order
Place a stop-loss order below the recent low for a buy signal or above the recent high for a sell signal.
5. Determine the Exit Point
Exit the trade when RSI returns to neutral levels (typically around 50) or if a stop-loss is triggered.
Chart Example
Swing Trading Example 3: Cup and Handle Pattern
Step-by-Step Instructions
1. Identify the Pattern
Look for a “cup” shape on the price chart, followed by a small consolidation forming the “handle.”
2. Confirm the Pattern
The cup should be U-shaped and not too deep, with the handle forming near the cup’s high point.
3. Enter the Trade
Buy the stock when the price breaks out above the handle’s resistance level.
4. Set a Stop-Loss Order
Place a stop-loss order below the bottom of the handle to manage risk.
5. Determine the Exit Point
Sell the stock at a predetermined profit target, often calculated as the height of the cup added to the breakout point.
Chart Example
Conclusion
Swing trading can be a highly effective strategy for capturing gains in the stock market. By following Alan Farley’s examples and using the right technical tools, you can enhance your trading skills and increase your chances of success. Remember, consistency and risk management are key to profitable trading.
FAQs
1. What is the best time frame for swing trading?
Swing trading typically involves holding positions for several days to weeks, so daily and weekly charts are most useful.
2. How much capital do I need to start swing trading?
The amount of capital needed can vary, but starting with at least $5,000 to $10,000 is recommended to allow for diversification and risk management.
3. Can swing trading be automated?
Yes, many traders use automated trading systems and algorithms to execute swing trades based on predefined criteria.
4. How do I choose the right stocks for swing trading?
Look for stocks with high liquidity, clear trends, and significant price swings. Screen for technical indicators that align with your strategy.
5. Is swing trading suitable for beginners?
Swing trading can be suitable for beginners, especially those who take the time to learn and practice basic trading principles and risk management.
Be the first to review “3 Swing Trading Examples, With Charts, Instructions, And Definitions To Get You Started by Alan Farley”
You must be logged in to post a review.
Related products

Forex Trading
Original price was: $999.00.$15.00Current price is: $15.00.

Forex Trading
Original price was: $239.00.$8.00Current price is: $8.00.

Original price was: $310.00.$23.00Current price is: $23.00.

Original price was: $895.00.$15.00Current price is: $15.00.

Forex Trading
Original price was: $2,000.00.$23.00Current price is: $23.00.

Original price was: $799.00.$15.00Current price is: $15.00.

Forex Trading
Original price was: $2,995.00.$31.00Current price is: $31.00.

Original price was: $700.00.$39.00Current price is: $39.00.
Original price was: $299.00.$8.00Current price is: $8.00.

Forex Trading
Original price was: $4,997.00.$27.00Current price is: $27.00.

Forex Trading
Original price was: $249.00.$15.00Current price is: $15.00.
Forex Trading
Original price was: $1,898.00.$10.00Current price is: $10.00.

Forex Trading
Original price was: $850.00.$23.00Current price is: $23.00.

Original price was: $997.00.$13.00Current price is: $13.00.

Forex Trading
Original price was: $2,997.00.$23.00Current price is: $23.00.

Original price was: $139.00.$23.00Current price is: $23.00.
Forex Trading
Original price was: $125.00.$17.00Current price is: $17.00.

Original price was: $1,800.00.$54.00Current price is: $54.00.

Forex Trading
Original price was: $500.00.$5.00Current price is: $5.00.

Forex Trading
Original price was: $1,098.00.$39.00Current price is: $39.00.

Reviews
There are no reviews yet.