-
×
 Level 2 Trading Warfare
1 × $6.00
Level 2 Trading Warfare
1 × $6.00 -
×
 Sovereign Man Price Value International 2016
1 × $15.00
Sovereign Man Price Value International 2016
1 × $15.00 -
×
 Sea Lanes & Pipelines with Bernard D.Cole
1 × $6.00
Sea Lanes & Pipelines with Bernard D.Cole
1 × $6.00 -
×
 Price Action Room - The Scalper’s Boot Camp
1 × $15.00
Price Action Room - The Scalper’s Boot Camp
1 × $15.00 -
×
 0 DTE Options Trading Workshop with Aeromir Corporation
1 × $15.00
0 DTE Options Trading Workshop with Aeromir Corporation
1 × $15.00 -
×
 High Probability Trading Using Elliott Wave And Fibonacci Analysis withVic Patel - Forex Training Group
1 × $10.00
High Probability Trading Using Elliott Wave And Fibonacci Analysis withVic Patel - Forex Training Group
1 × $10.00 -
×
 E75 Forex System with James de Wet
1 × $6.00
E75 Forex System with James de Wet
1 × $6.00 -
×
 Climate Behaviour with Feibel Trading
1 × $6.00
Climate Behaviour with Feibel Trading
1 × $6.00 -
×
 The Complete Guide to Market Breadth Indicators: How to Analyze and Evaluate market Direction and Strength - Greg Morris
1 × $6.00
The Complete Guide to Market Breadth Indicators: How to Analyze and Evaluate market Direction and Strength - Greg Morris
1 × $6.00 -
×
 Synthetic and Structured Assets: A Practical Guide to Investment and Risk with Erik Banks
1 × $6.00
Synthetic and Structured Assets: A Practical Guide to Investment and Risk with Erik Banks
1 × $6.00 -
×
 Day Trading Insight with Al Brooks
1 × $10.00
Day Trading Insight with Al Brooks
1 × $10.00 -
×
 Create Your Own Hedge Fund with Mark Wolfinger
1 × $6.00
Create Your Own Hedge Fund with Mark Wolfinger
1 × $6.00 -
×
 Picking the Best Stocks & Strategies for every Option Trade with James Bittman
1 × $6.00
Picking the Best Stocks & Strategies for every Option Trade with James Bittman
1 × $6.00 -
×
 Examination Book Morning Section (1999)
1 × $6.00
Examination Book Morning Section (1999)
1 × $6.00 -
×
 Pentagonal Time Cycle Theory
1 × $6.00
Pentagonal Time Cycle Theory
1 × $6.00 -
×
 SE ELITE COURSE with SE TRADINGX
1 × $5.00
SE ELITE COURSE with SE TRADINGX
1 × $5.00 -
×
 Forex Master Method Evolution with Russ Horn
1 × $6.00
Forex Master Method Evolution with Russ Horn
1 × $6.00 -
×
 Pricing of Bond Options with Detlef Repplinger
1 × $6.00
Pricing of Bond Options with Detlef Repplinger
1 × $6.00 -
×
 Building Winning Trading Systems
1 × $6.00
Building Winning Trading Systems
1 × $6.00 -
×
 Strategy, Value and Risk - The Real Options Approach with Jamie Rogers
1 × $6.00
Strategy, Value and Risk - The Real Options Approach with Jamie Rogers
1 × $6.00 -
×
 Lifespan Investing with Clifford Pistolese
1 × $6.00
Lifespan Investing with Clifford Pistolese
1 × $6.00 -
×
 LEAPS Trading Strategies- Powerful Techniques for Options Trading Success - Marty Kearney
1 × $6.00
LEAPS Trading Strategies- Powerful Techniques for Options Trading Success - Marty Kearney
1 × $6.00 -
×
 Street-Smart Chart Reading – Volume 1 – The Rudiments with Donald G.Worden
1 × $6.00
Street-Smart Chart Reading – Volume 1 – The Rudiments with Donald G.Worden
1 × $6.00 -
×
 Daryl Guppy Tutorials In Technical Analysis (2000-2001-2003-2004)
1 × $6.00
Daryl Guppy Tutorials In Technical Analysis (2000-2001-2003-2004)
1 × $6.00 -
×
 Build A Solid Foundation For Trading Options with Corey Halliday
1 × $6.00
Build A Solid Foundation For Trading Options with Corey Halliday
1 × $6.00 -
×
 Lessons 1-30 & Tradestation Code with Charles Drummond
1 × $6.00
Lessons 1-30 & Tradestation Code with Charles Drummond
1 × $6.00 -
×
 Trading With an Edge with Bruce Gilmore
1 × $6.00
Trading With an Edge with Bruce Gilmore
1 × $6.00 -
×
 Get 95% Win Rate With The Triple Candy Method - Eden
1 × $5.00
Get 95% Win Rate With The Triple Candy Method - Eden
1 × $5.00 -
×
 The HV7 Option Trading System with Amy Meissner – Aeromir
1 × $8.00
The HV7 Option Trading System with Amy Meissner – Aeromir
1 × $8.00 -
×
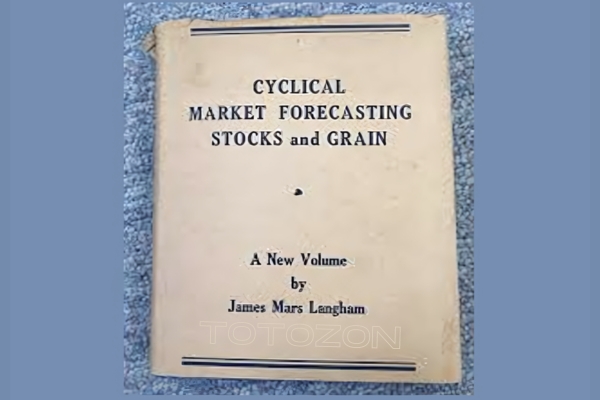 Market Forecasting. Stocks and Grain
1 × $6.00
Market Forecasting. Stocks and Grain
1 × $6.00 -
×
 Forex Trading Systems Elearning Course - Busted Breakout System with Van Tharp
1 × $6.00
Forex Trading Systems Elearning Course - Busted Breakout System with Van Tharp
1 × $6.00 -
×
 Lee Gettess’s Package
1 × $6.00
Lee Gettess’s Package
1 × $6.00 -
×
 Matrix Spread Options Trading Course with Base Camp Trading
1 × $31.00
Matrix Spread Options Trading Course with Base Camp Trading
1 × $31.00 -
×
 The Complete Guide to Multiple Time Frame Analysis & Reading Price Action with Aiman Almansoori
1 × $13.00
The Complete Guide to Multiple Time Frame Analysis & Reading Price Action with Aiman Almansoori
1 × $13.00 -
×
 Ultimate Trading Course with Dodgy's Dungeon
1 × $8.00
Ultimate Trading Course with Dodgy's Dungeon
1 × $8.00 -
×
 Advanced Spread Trading with Guy Bower - MasterClass Trader
1 × $15.00
Advanced Spread Trading with Guy Bower - MasterClass Trader
1 × $15.00

3 Swing Trading Examples, With Charts, Instructions, And Definitions To Get You Started by Alan Farley
$6.00
File Size: Cooming soon!
Delivery Time: 1–12 hours
Media Type: Online Course
Content Proof: Watch Here!
You may check content proof of “3 Swing Trading Examples, With Charts, Instructions, And Definitions To Get You Started by Alan Farley” below:

3 Swing Trading Examples, With Charts, Instructions, And Definitions To Get You Started by Alan Farley
Introduction
Swing trading is a popular strategy for capturing short- to medium-term gains in the stock market. Alan Farley, a seasoned trading expert, provides insightful examples that can help beginners and experienced traders alike. This article will walk you through three swing trading examples with charts, detailed instructions, and key definitions to get you started on your trading journey.
What is Swing Trading?
Definition
Swing trading involves holding positions for several days to weeks, aiming to profit from price swings. This strategy capitalizes on short-term trends and market volatility.
Why Choose Swing Trading?
Swing trading offers flexibility and requires less time commitment compared to day trading, making it suitable for individuals with other commitments.
Key Terms in Swing Trading
1. Entry Point
The price at which a trader buys a stock, initiating the trade.
2. Exit Point
The price at which a trader sells a stock, concluding the trade.
3. Stop-Loss Order
An order placed to sell a stock when it reaches a certain price, limiting potential losses.
4. Resistance Level
A price level at which a stock tends to stop rising, encountering selling pressure.
5. Support Level
A price level at which a stock tends to stop falling, encountering buying interest.
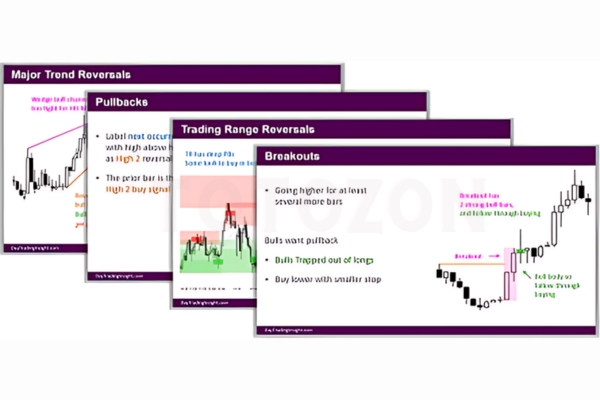
Swing Trading Example 1: Moving Average Crossover
Step-by-Step Instructions
1. Identify the Moving Averages
Use a 50-day simple moving average (SMA) and a 200-day SMA. These averages help identify the overall trend.
2. Look for a Crossover
A bullish signal occurs when the 50-day SMA crosses above the 200-day SMA, indicating a potential uptrend.
3. Enter the Trade
Buy the stock when the crossover is confirmed.
4. Set a Stop-Loss Order
Place a stop-loss order below a recent support level to manage risk.
5. Determine the Exit Point
Sell the stock when the 50-day SMA crosses below the 200-day SMA, indicating a potential downtrend.
Chart Example
Swing Trading Example 2: RSI Overbought/Oversold
Step-by-Step Instructions
1. Set Up the RSI Indicator
Use the Relative Strength Index (RSI) with a 14-day period. RSI measures the speed and change of price movements.
2. Identify Overbought/Oversold Conditions
RSI values above 70 indicate overbought conditions, while values below 30 indicate oversold conditions.
3. Enter the Trade
- Buy Signal: When RSI moves below 30 and then rises back above it, indicating the stock is recovering from oversold conditions.
- Sell Signal: When RSI moves above 70 and then falls back below it, indicating the stock is retreating from overbought conditions.
4. Set a Stop-Loss Order
Place a stop-loss order below the recent low for a buy signal or above the recent high for a sell signal.
5. Determine the Exit Point
Exit the trade when RSI returns to neutral levels (typically around 50) or if a stop-loss is triggered.
Chart Example
Swing Trading Example 3: Cup and Handle Pattern
Step-by-Step Instructions
1. Identify the Pattern
Look for a “cup” shape on the price chart, followed by a small consolidation forming the “handle.”
2. Confirm the Pattern
The cup should be U-shaped and not too deep, with the handle forming near the cup’s high point.
3. Enter the Trade
Buy the stock when the price breaks out above the handle’s resistance level.
4. Set a Stop-Loss Order
Place a stop-loss order below the bottom of the handle to manage risk.
5. Determine the Exit Point
Sell the stock at a predetermined profit target, often calculated as the height of the cup added to the breakout point.
Chart Example
Conclusion
Swing trading can be a highly effective strategy for capturing gains in the stock market. By following Alan Farley’s examples and using the right technical tools, you can enhance your trading skills and increase your chances of success. Remember, consistency and risk management are key to profitable trading.
FAQs
1. What is the best time frame for swing trading?
Swing trading typically involves holding positions for several days to weeks, so daily and weekly charts are most useful.
2. How much capital do I need to start swing trading?
The amount of capital needed can vary, but starting with at least $5,000 to $10,000 is recommended to allow for diversification and risk management.
3. Can swing trading be automated?
Yes, many traders use automated trading systems and algorithms to execute swing trades based on predefined criteria.
4. How do I choose the right stocks for swing trading?
Look for stocks with high liquidity, clear trends, and significant price swings. Screen for technical indicators that align with your strategy.
5. Is swing trading suitable for beginners?
Swing trading can be suitable for beginners, especially those who take the time to learn and practice basic trading principles and risk management.
Be the first to review “3 Swing Trading Examples, With Charts, Instructions, And Definitions To Get You Started by Alan Farley”
You must be logged in to post a review.
Related products

Forex Trading
Original price was: $125.00.$17.00Current price is: $17.00.
Forex Trading
Original price was: $239.00.$8.00Current price is: $8.00.

Original price was: $450.00.$23.00Current price is: $23.00.

Original price was: $197.00.$5.00Current price is: $5.00.

Original price was: $1,800.00.$54.00Current price is: $54.00.

Original price was: $310.00.$23.00Current price is: $23.00.

Forex Trading
Original price was: $2,997.00.$23.00Current price is: $23.00.
Original price was: $497.00.$31.00Current price is: $31.00.

Original price was: $649.00.$20.00Current price is: $20.00.

Original price was: $299.00.$8.00Current price is: $8.00.

Original price was: $695.00.$41.00Current price is: $41.00.
Forex Trading
Original price was: $999.00.$15.00Current price is: $15.00.
Forex Trading
The Complete Guide to Multiple Time Frame Analysis & Reading Price Action with Aiman Almansoori
Original price was: $1,399.00.$13.00Current price is: $13.00.

Forex Trading
Original price was: $799.00.$15.00Current price is: $15.00.

Original price was: $139.00.$23.00Current price is: $23.00.
Original price was: $895.00.$15.00Current price is: $15.00.

Forex Trading
Original price was: $249.00.$15.00Current price is: $15.00.

Forex Trading
Original price was: $2,000.00.$23.00Current price is: $23.00.

Original price was: $700.00.$39.00Current price is: $39.00.
Forex Trading
Original price was: $1,898.00.$10.00Current price is: $10.00.

Reviews
There are no reviews yet.