-
×
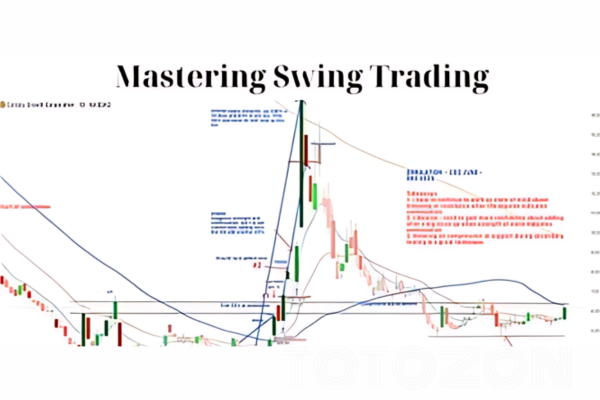 MASTERING SWING TRADING May 2024 with Roman Bogomazov
1 × $194.00
MASTERING SWING TRADING May 2024 with Roman Bogomazov
1 × $194.00 -
×
 The Complete Guide to Multiple Time Frame Analysis & Reading Price Action with Aiman Almansoori
1 × $13.00
The Complete Guide to Multiple Time Frame Analysis & Reading Price Action with Aiman Almansoori
1 × $13.00 -
×
 TheVWAP with Zach Hurwitz
1 × $5.00
TheVWAP with Zach Hurwitz
1 × $5.00 -
×
 FX Masterclass 2.0 with Uprise Academy
1 × $26.00
FX Masterclass 2.0 with Uprise Academy
1 × $26.00 -
×
 TickScalper Trading System
1 × $23.00
TickScalper Trading System
1 × $23.00 -
×
 Freedom Trading Course with Financial Freedom Trading
1 × $15.00
Freedom Trading Course with Financial Freedom Trading
1 × $15.00 -
×
 The Inner Circle Seminar
1 × $15.00
The Inner Circle Seminar
1 × $15.00 -
×
 Trend Forecasting with Technical Analysis with Louis Mendelsohn & John Murphy
1 × $6.00
Trend Forecasting with Technical Analysis with Louis Mendelsohn & John Murphy
1 × $6.00 -
×
 Conquering Stock Market Hype with Allan Campbell
1 × $6.00
Conquering Stock Market Hype with Allan Campbell
1 × $6.00 -
×
 Surplus Trader Secrets Masterclass Coaching Program
1 × $6.00
Surplus Trader Secrets Masterclass Coaching Program
1 × $6.00 -
×
 How to Overlay Technical Indicators with Keith Raphael
1 × $6.00
How to Overlay Technical Indicators with Keith Raphael
1 × $6.00 -
×
 SQX Mentorship with Tip Toe Hippo
1 × $23.00
SQX Mentorship with Tip Toe Hippo
1 × $23.00 -
×
 DynaRange® (PREMIUM)
1 × $78.00
DynaRange® (PREMIUM)
1 × $78.00 -
×
 ICT Prodigy Trading Course – $650K in Payouts with Alex Solignani
1 × $15.00
ICT Prodigy Trading Course – $650K in Payouts with Alex Solignani
1 × $15.00 -
×
 The Advanced Technical Analysis Trading Course (New 2019)
1 × $6.00
The Advanced Technical Analysis Trading Course (New 2019)
1 × $6.00 -
×
 Forexmentor – LiveConnect
1 × $23.00
Forexmentor – LiveConnect
1 × $23.00 -
×
 Options Education FULL Course 30+ Hours with Macrohedged
1 × $23.00
Options Education FULL Course 30+ Hours with Macrohedged
1 × $23.00 -
×
 Main Online Course with FestX
1 × $5.00
Main Online Course with FestX
1 × $5.00 -
×
 ITPM Professional Trading Masterclass (PTM) V2.0 with Anton Kreil
1 × $6.00
ITPM Professional Trading Masterclass (PTM) V2.0 with Anton Kreil
1 × $6.00 -
×
 Valuation of Internet & Technology Stocks with Brian Kettell
1 × $6.00
Valuation of Internet & Technology Stocks with Brian Kettell
1 × $6.00 -
×
 ASFX Advanced Divergence Training Course & VIP Chat
1 × $39.00
ASFX Advanced Divergence Training Course & VIP Chat
1 × $39.00 -
×
 The Whale Order with The Forex Scalpers
1 × $5.00
The Whale Order with The Forex Scalpers
1 × $5.00 -
×
 Elite Day Trading Bundle (Series 4) with The Swag Academy
1 × $101.00
Elite Day Trading Bundle (Series 4) with The Swag Academy
1 × $101.00 -
×
 Smart Money with Chart Engineers
1 × $7.00
Smart Money with Chart Engineers
1 × $7.00 -
×
 Ultimate Trading Course with Dodgy's Dungeon
1 × $8.00
Ultimate Trading Course with Dodgy's Dungeon
1 × $8.00 -
×
 Zen in the Markets with Edward Allen Toppel
1 × $6.00
Zen in the Markets with Edward Allen Toppel
1 × $6.00 -
×
 BookMap Advanced v6.1
1 × $6.00
BookMap Advanced v6.1
1 × $6.00 -
×
 Learning How to Successfully Trade the E-mini & S&P 500 Markets
1 × $6.00
Learning How to Successfully Trade the E-mini & S&P 500 Markets
1 × $6.00 -
×
 A- Z Educational Trading Course with InvestiTrade
1 × $39.00
A- Z Educational Trading Course with InvestiTrade
1 × $39.00 -
×
 Power Charting - Robert’s Indicator Webinar
1 × $6.00
Power Charting - Robert’s Indicator Webinar
1 × $6.00 -
×
 Quantitative Finance & Algorithmic Trading II - Time Series with Holczer Balazs
1 × $4.00
Quantitative Finance & Algorithmic Trading II - Time Series with Holczer Balazs
1 × $4.00 -
×
 Sector Rotation & Market Timing with Frank Barbera
1 × $6.00
Sector Rotation & Market Timing with Frank Barbera
1 × $6.00 -
×
 Trading Short TermSame Day Trades Sep 2023 with Dan Sheridan & Mark Fenton - Sheridan Options Mentoring
1 × $31.00
Trading Short TermSame Day Trades Sep 2023 with Dan Sheridan & Mark Fenton - Sheridan Options Mentoring
1 × $31.00 -
×
 Forex Trading using Intermarket Analysis with Louis Mendelsohn
1 × $6.00
Forex Trading using Intermarket Analysis with Louis Mendelsohn
1 × $6.00 -
×
 Read The Market RTM Master Trader Course + Journals
1 × $5.00
Read The Market RTM Master Trader Course + Journals
1 × $5.00 -
×
 TLM Virtual Trading Summit 2021 with TradeLikeMike
1 × $6.00
TLM Virtual Trading Summit 2021 with TradeLikeMike
1 × $6.00 -
×
 The Decision-Making Process and Forward with Peter Steidlmayer
1 × $4.00
The Decision-Making Process and Forward with Peter Steidlmayer
1 × $4.00 -
×
 Bond Market Course with The Macro Compass
1 × $15.00
Bond Market Course with The Macro Compass
1 × $15.00 -
×
 Forex Power Strategy Course with Jason Steele
1 × $6.00
Forex Power Strategy Course with Jason Steele
1 × $6.00 -
×
 IncomeMAX Spreads and Straddles with Hari Swaminathan
1 × $15.00
IncomeMAX Spreads and Straddles with Hari Swaminathan
1 × $15.00 -
×
 How To Day-Trade Micro Eminis with Dr. Stoxx
1 × $5.00
How To Day-Trade Micro Eminis with Dr. Stoxx
1 × $5.00 -
×
 Butterfly and Condor Workshop with Aeromir
1 × $15.00
Butterfly and Condor Workshop with Aeromir
1 × $15.00

Stock Trader`s Almanac 2012 with Jeffrey Hirsch & Yale Hirsch
$6.00
File Size: Coming soon!
Delivery Time: 1–12 hours
Media Type: Online Course
Content Proof: Watch Here!
You may check content proof of “Stock Trader`s Almanac 2012 with Jeffrey Hirsch & Yale Hirsch” below:

Stock Trader’s Almanac 2012 with Jeffrey Hirsch & Yale Hirsch
Introduction
In the ever-evolving world of stock trading, staying ahead of market trends and making informed decisions is crucial. The “Stock Trader’s Almanac 2012” by Jeffrey Hirsch and Yale Hirsch serves as an invaluable resource for traders and investors alike. This comprehensive guide combines historical data, market analysis, and strategic insights to help you navigate the complexities of the stock market with confidence.
The Legacy of the Stock Trader’s Almanac
Origins of the Almanac
The Stock Trader’s Almanac was first published by Yale Hirsch in 1967. It quickly became a trusted resource for market analysis and historical trends.
Evolution Over Time
Jeffrey Hirsch, Yale’s son, took over the mantle in the late 1990s, continuing the legacy with updated editions that reflect current market conditions.
The 2012 Edition
The 2012 edition of the Almanac is particularly notable for its insights and strategies tailored to the post-2008 financial landscape.
Key Features of the Almanac
Historical Market Data
- Monthly and Daily Data: Detailed historical data for each month and day.
- Seasonal Trends: Analysis of seasonal patterns and their impact on market performance.
Market Analysis
- Technical Indicators: Tools and indicators for technical analysis.
- Fundamental Analysis: Insights into economic indicators and their influence on the market.
Trading Strategies
- Best Six Months Strategy: A strategy focusing on the best six months of the year for stock trading.
- Santa Claus Rally: Analysis of the year-end rally phenomenon.
The Best Six Months Strategy
Understanding the Strategy
The Best Six Months Strategy suggests that the market performs best between November and April.
Historical Performance
Historical data shows that this period tends to yield higher returns compared to the rest of the year.
Implementing the Strategy
- Buy in November: Invest in the market in November.
- Sell in April: Exit positions in April to avoid the traditionally weaker months.
The Santa Claus Rally
What is the Santa Claus Rally?
The Santa Claus Rally refers to the tendency for the stock market to rise in the last week of December and the first two trading days of January.
Historical Analysis
Historical data supports the existence of this rally, with positive returns in most years.
How to Capitalize on the Rally
- Timing: Enter the market in late December.
- Exit: Consider exiting positions after the first two trading days of January.
Utilizing Technical Indicators
Moving Averages
- Simple Moving Average (SMA): Averages the closing prices over a specified period.
- Exponential Moving Average (EMA): Gives more weight to recent prices for a more responsive indicator.
Relative Strength Index (RSI)
- Overbought/Oversold Conditions: Identifies potential reversal points by measuring the speed and change of price movements.
MACD (Moving Average Convergence Divergence)
- Trend Following: Indicates bullish or bearish trends by comparing short-term and long-term moving averages.
Fundamental Analysis Insights
Economic Indicators
- GDP Growth: A key indicator of economic health.
- Unemployment Rate: Impacts consumer spending and economic stability.
Corporate Earnings
- Earnings Reports: Quarterly earnings reports provide insights into a company’s financial health.
- Earnings Per Share (EPS): Measures a company’s profitability on a per-share basis.
Seasonal Patterns and Trends
January Effect
The January Effect refers to the tendency for small-cap stocks to outperform in January.
Sell in May and Go Away
This adage suggests that the market tends to underperform from May to October.
Holiday Effect
The market often experiences positive returns on trading days preceding a holiday.
Risk Management Strategies
Stop-Loss Orders
Implementing stop-loss orders can help limit potential losses by automatically selling a security when it reaches a predetermined price.
Diversification
Diversify your portfolio to spread risk across various asset classes and sectors.
Hedging
Use options and other derivative instruments to hedge against potential market downturns.
Conclusion
The “Stock Trader’s Almanac 2012” by Jeffrey Hirsch and Yale Hirsch remains an essential tool for traders and investors looking to make informed decisions. By leveraging historical data, market analysis, and strategic insights, you can enhance your trading performance and achieve your financial goals. Stay ahead of the market trends, and let the Almanac guide you through the complexities of stock trading.

FAQs
What is the main focus of the “Stock Trader’s Almanac 2012”?
The main focus is on providing historical market data, seasonal trends, and strategic insights to aid traders and investors in making informed decisions.
How can the Best Six Months Strategy benefit traders?
The Best Six Months Strategy can help traders capitalize on the historically strong performance of the market from November to April.
What is the Santa Claus Rally?
The Santa Claus Rally refers to the tendency for the stock market to rise during the last week of December and the first two trading days of January.
How important are technical indicators in trading?
Technical indicators are crucial for analyzing market trends, identifying potential entry and exit points, and making informed trading decisions.
Why is risk management important in trading?
Risk management is essential to protect your investment capital and minimize potential losses in the volatile stock market.
Be the first to review “Stock Trader`s Almanac 2012 with Jeffrey Hirsch & Yale Hirsch”
You must be logged in to post a review.
Related products

Original price was: $649.00.$20.00Current price is: $20.00.
Forex Trading
Original price was: $499.00.$15.00Current price is: $15.00.

Original price was: $197.00.$5.00Current price is: $5.00.

Original price was: $299.00.$8.00Current price is: $8.00.

Original price was: $997.00.$13.00Current price is: $13.00.

Original price was: $139.00.$23.00Current price is: $23.00.

Original price was: $999.00.$5.00Current price is: $5.00.

Forex Trading
Original price was: $550.00.$5.00Current price is: $5.00.

Forex Trading
Original price was: $2,995.00.$31.00Current price is: $31.00.

Forex Trading
Original price was: $850.00.$23.00Current price is: $23.00.
Forex Trading
Original price was: $239.00.$8.00Current price is: $8.00.

Original price was: $695.00.$41.00Current price is: $41.00.

Original price was: $450.00.$23.00Current price is: $23.00.

Forex Trading
Quantamentals – The Next Great Forefront Of Trading and Investing with Trading Markets
Original price was: $1,495.00.$8.00Current price is: $8.00.
Forex Trading
Original price was: $397.00.$31.00Current price is: $31.00.

Forex Trading
Original price was: $697.00.$5.00Current price is: $5.00.
Forex Trading
Original price was: $799.00.$15.00Current price is: $15.00.

Forex Trading
Original price was: $500.00.$5.00Current price is: $5.00.

Original price was: $997.00.$8.00Current price is: $8.00.

Original price was: $1,800.00.$54.00Current price is: $54.00.
Reviews
There are no reviews yet.