-
×
 Intermarket Analysis with John Murphy
1 × $6.00
Intermarket Analysis with John Murphy
1 × $6.00 -
×
 Special Webinars Module 2 with Trader Dante
1 × $6.00
Special Webinars Module 2 with Trader Dante
1 × $6.00 -
×
 Advanced Spread Trading with Guy Bower - MasterClass Trader
1 × $15.00
Advanced Spread Trading with Guy Bower - MasterClass Trader
1 × $15.00 -
×
 $20 – 52k 20 pips a day challange with Rafał Zuchowicz - TopMasterTrader
1 × $5.00
$20 – 52k 20 pips a day challange with Rafał Zuchowicz - TopMasterTrader
1 × $5.00 -
×
 Trading to Win with Ari Kiev
1 × $6.00
Trading to Win with Ari Kiev
1 × $6.00 -
×
 Artificial Intelligence with Larry Pesavento
1 × $6.00
Artificial Intelligence with Larry Pesavento
1 × $6.00 -
×
 Quantamentals - The Next Great Forefront Of Trading and Investing with Trading Markets
1 × $8.00
Quantamentals - The Next Great Forefront Of Trading and Investing with Trading Markets
1 × $8.00 -
×
 Gann’s Scientific Methods Unveiled (Vol I, II)
1 × $6.00
Gann’s Scientific Methods Unveiled (Vol I, II)
1 × $6.00 -
×
 Three Tricks, Two Traps, One Truth Real Help for Traders and Investors with D.R.Barton
1 × $6.00
Three Tricks, Two Traps, One Truth Real Help for Traders and Investors with D.R.Barton
1 × $6.00 -
×
 The Oil Money (open code) (Nov 2013)
1 × $6.00
The Oil Money (open code) (Nov 2013)
1 × $6.00 -
×
 Using Fundamental Analysis with Andrew Baxter
1 × $6.00
Using Fundamental Analysis with Andrew Baxter
1 × $6.00 -
×
 Tradeonix Trading System
1 × $31.00
Tradeonix Trading System
1 × $31.00 -
×
 Recover Your Losses & Double Your Account Size with Tokyo The Trader - PLFCrypto
1 × $6.00
Recover Your Losses & Double Your Account Size with Tokyo The Trader - PLFCrypto
1 × $6.00 -
×
 Theo Trade - 128 Course Bundle
1 × $93.00
Theo Trade - 128 Course Bundle
1 × $93.00 -
×
 Stock Options Mastery with Jeremy Lefebvre
1 × $23.00
Stock Options Mastery with Jeremy Lefebvre
1 × $23.00 -
×
 Wall Street Training
1 × $6.00
Wall Street Training
1 × $6.00 -
×
 Deep Dive Butterfly Trading Strategy Class with SJG Trades
1 × $41.00
Deep Dive Butterfly Trading Strategy Class with SJG Trades
1 × $41.00 -
×
 Tomorrow's Gold: Asia's Age of Discovery with Marc Faber
1 × $6.00
Tomorrow's Gold: Asia's Age of Discovery with Marc Faber
1 × $6.00 -
×
 NetPicks - Universal Market Trader Course
1 × $6.00
NetPicks - Universal Market Trader Course
1 × $6.00 -
×
 Back to the Basics
1 × $6.00
Back to the Basics
1 × $6.00 -
×
 AI For Traders with Trading Markets
1 × $31.00
AI For Traders with Trading Markets
1 × $31.00 -
×
 The Best of the Professional Traders Journal: Options Trading and Volatility Trading with Larry Connors
1 × $6.00
The Best of the Professional Traders Journal: Options Trading and Volatility Trading with Larry Connors
1 × $6.00 -
×
 MTI - Basics UTP
1 × $6.00
MTI - Basics UTP
1 × $6.00 -
×
 CalendarMAX with Hari Swaminathan
1 × $15.00
CalendarMAX with Hari Swaminathan
1 × $15.00 -
×
 The Big Volatility Short - The Best Trade On Wall Street
1 × $15.00
The Big Volatility Short - The Best Trade On Wall Street
1 × $15.00 -
×
 BearProof Investing with Kenneth Little
1 × $6.00
BearProof Investing with Kenneth Little
1 × $6.00 -
×
 Into The Abbys with Black Rabbit
1 × $18.00
Into The Abbys with Black Rabbit
1 × $18.00 -
×
 White Phoenix’s The Smart (Money) Approach to Trading with Jayson Casper
1 × $39.00
White Phoenix’s The Smart (Money) Approach to Trading with Jayson Casper
1 × $39.00 -
×
 Winning Chart Patterns For NASDAQ Traders Version 2 - 1 DVD with Ken Calhoun
1 × $6.00
Winning Chart Patterns For NASDAQ Traders Version 2 - 1 DVD with Ken Calhoun
1 × $6.00 -
×
 Understanding Equity & Trusts with Alastair Hudson
1 × $6.00
Understanding Equity & Trusts with Alastair Hudson
1 × $6.00 -
×
 Home Run Options Trading Course with Dave Aquino - Base Camp Trading
1 × $11.00
Home Run Options Trading Course with Dave Aquino - Base Camp Trading
1 × $11.00 -
×
 Markets 101 Complete Course with Joseph Wang - Central Banking 101
1 × $13.00
Markets 101 Complete Course with Joseph Wang - Central Banking 101
1 × $13.00 -
×
 Code 1 with Oil Trading Academy
1 × $31.00
Code 1 with Oil Trading Academy
1 × $31.00 -
×
 Ultimate Day Trading Program with Maroun4x
1 × $5.00
Ultimate Day Trading Program with Maroun4x
1 × $5.00 -
×
 The Triad Formula System with Jason Fielder
1 × $6.00
The Triad Formula System with Jason Fielder
1 × $6.00 -
×
 Month 01 to 08 2018
1 × $62.00
Month 01 to 08 2018
1 × $62.00 -
×
 Van Tharp Courses Collection
1 × $41.00
Van Tharp Courses Collection
1 × $41.00 -
×
 With All Odds Forex System I & II with Barry Thornton
1 × $6.00
With All Odds Forex System I & II with Barry Thornton
1 × $6.00 -
×
 All About Market Timing with Leslie N.Masonson
1 × $6.00
All About Market Timing with Leslie N.Masonson
1 × $6.00 -
×
 Strees Relief for Traders Workshop with Adrienne Laris Toghraie
1 × $6.00
Strees Relief for Traders Workshop with Adrienne Laris Toghraie
1 × $6.00 -
×
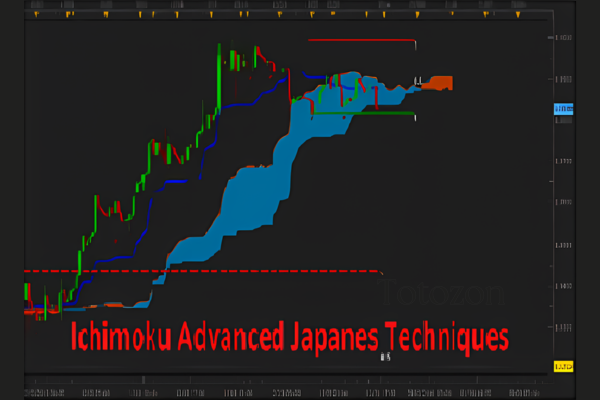 FX At One Glance - Ichimoku Advanced Japanese Techniques
1 × $15.00
FX At One Glance - Ichimoku Advanced Japanese Techniques
1 × $15.00 -
×
 Protecting your Retirement Account in a Correction with Dan Sheridan - Sheridan Options Mentoring
1 × $31.00
Protecting your Retirement Account in a Correction with Dan Sheridan - Sheridan Options Mentoring
1 × $31.00 -
×
 Opportunity Investing with Gerald Appel
1 × $6.00
Opportunity Investing with Gerald Appel
1 × $6.00 -
×
 Trading Indicators for the 21th Century
1 × $15.00
Trading Indicators for the 21th Century
1 × $15.00 -
×
 Market Science Volumes I & II Square of Twelve & Market Dynamics with Bradley Cowan
1 × $4.00
Market Science Volumes I & II Square of Twelve & Market Dynamics with Bradley Cowan
1 × $4.00 -
×
 Options, Futures & Other Derivatives . Solutions Manual
1 × $6.00
Options, Futures & Other Derivatives . Solutions Manual
1 × $6.00 -
×
 Unlocking Success in ICT 2022 Mentorship: The Smart Money Guide to The Full ICT Day Trading Model by LumiTraders & Darya Filipenka
1 × $5.00
Unlocking Success in ICT 2022 Mentorship: The Smart Money Guide to The Full ICT Day Trading Model by LumiTraders & Darya Filipenka
1 × $5.00 -
×
 W. D Gann 's Square Of 9 Applied To Modern Markets with Sean Avidar - Hexatrade350
1 × $23.00
W. D Gann 's Square Of 9 Applied To Modern Markets with Sean Avidar - Hexatrade350
1 × $23.00

Stock Trader`s Almanac 2012 with Jeffrey Hirsch & Yale Hirsch
$6.00
File Size: Coming soon!
Delivery Time: 1–12 hours
Media Type: Online Course
Content Proof: Watch Here!
You may check content proof of “Stock Trader`s Almanac 2012 with Jeffrey Hirsch & Yale Hirsch” below:

Stock Trader’s Almanac 2012 with Jeffrey Hirsch & Yale Hirsch
Introduction
In the ever-evolving world of stock trading, staying ahead of market trends and making informed decisions is crucial. The “Stock Trader’s Almanac 2012” by Jeffrey Hirsch and Yale Hirsch serves as an invaluable resource for traders and investors alike. This comprehensive guide combines historical data, market analysis, and strategic insights to help you navigate the complexities of the stock market with confidence.
The Legacy of the Stock Trader’s Almanac
Origins of the Almanac
The Stock Trader’s Almanac was first published by Yale Hirsch in 1967. It quickly became a trusted resource for market analysis and historical trends.
Evolution Over Time
Jeffrey Hirsch, Yale’s son, took over the mantle in the late 1990s, continuing the legacy with updated editions that reflect current market conditions.
The 2012 Edition
The 2012 edition of the Almanac is particularly notable for its insights and strategies tailored to the post-2008 financial landscape.
Key Features of the Almanac
Historical Market Data
- Monthly and Daily Data: Detailed historical data for each month and day.
- Seasonal Trends: Analysis of seasonal patterns and their impact on market performance.
Market Analysis
- Technical Indicators: Tools and indicators for technical analysis.
- Fundamental Analysis: Insights into economic indicators and their influence on the market.
Trading Strategies
- Best Six Months Strategy: A strategy focusing on the best six months of the year for stock trading.
- Santa Claus Rally: Analysis of the year-end rally phenomenon.
The Best Six Months Strategy
Understanding the Strategy
The Best Six Months Strategy suggests that the market performs best between November and April.
Historical Performance
Historical data shows that this period tends to yield higher returns compared to the rest of the year.
Implementing the Strategy
- Buy in November: Invest in the market in November.
- Sell in April: Exit positions in April to avoid the traditionally weaker months.
The Santa Claus Rally
What is the Santa Claus Rally?
The Santa Claus Rally refers to the tendency for the stock market to rise in the last week of December and the first two trading days of January.
Historical Analysis
Historical data supports the existence of this rally, with positive returns in most years.
How to Capitalize on the Rally
- Timing: Enter the market in late December.
- Exit: Consider exiting positions after the first two trading days of January.
Utilizing Technical Indicators
Moving Averages
- Simple Moving Average (SMA): Averages the closing prices over a specified period.
- Exponential Moving Average (EMA): Gives more weight to recent prices for a more responsive indicator.
Relative Strength Index (RSI)
- Overbought/Oversold Conditions: Identifies potential reversal points by measuring the speed and change of price movements.
MACD (Moving Average Convergence Divergence)
- Trend Following: Indicates bullish or bearish trends by comparing short-term and long-term moving averages.
Fundamental Analysis Insights
Economic Indicators
- GDP Growth: A key indicator of economic health.
- Unemployment Rate: Impacts consumer spending and economic stability.
Corporate Earnings
- Earnings Reports: Quarterly earnings reports provide insights into a company’s financial health.
- Earnings Per Share (EPS): Measures a company’s profitability on a per-share basis.
Seasonal Patterns and Trends
January Effect
The January Effect refers to the tendency for small-cap stocks to outperform in January.
Sell in May and Go Away
This adage suggests that the market tends to underperform from May to October.
Holiday Effect
The market often experiences positive returns on trading days preceding a holiday.
Risk Management Strategies
Stop-Loss Orders
Implementing stop-loss orders can help limit potential losses by automatically selling a security when it reaches a predetermined price.
Diversification
Diversify your portfolio to spread risk across various asset classes and sectors.
Hedging
Use options and other derivative instruments to hedge against potential market downturns.
Conclusion
The “Stock Trader’s Almanac 2012” by Jeffrey Hirsch and Yale Hirsch remains an essential tool for traders and investors looking to make informed decisions. By leveraging historical data, market analysis, and strategic insights, you can enhance your trading performance and achieve your financial goals. Stay ahead of the market trends, and let the Almanac guide you through the complexities of stock trading.

FAQs
What is the main focus of the “Stock Trader’s Almanac 2012”?
The main focus is on providing historical market data, seasonal trends, and strategic insights to aid traders and investors in making informed decisions.
How can the Best Six Months Strategy benefit traders?
The Best Six Months Strategy can help traders capitalize on the historically strong performance of the market from November to April.
What is the Santa Claus Rally?
The Santa Claus Rally refers to the tendency for the stock market to rise during the last week of December and the first two trading days of January.
How important are technical indicators in trading?
Technical indicators are crucial for analyzing market trends, identifying potential entry and exit points, and making informed trading decisions.
Why is risk management important in trading?
Risk management is essential to protect your investment capital and minimize potential losses in the volatile stock market.
Be the first to review “Stock Trader`s Almanac 2012 with Jeffrey Hirsch & Yale Hirsch”
You must be logged in to post a review.
Related products

Forex Trading
Original price was: $2,997.00.$23.00Current price is: $23.00.
Original price was: $700.00.$39.00Current price is: $39.00.

Forex Trading
Original price was: $397.00.$31.00Current price is: $31.00.

Original price was: $1,200.00.$23.00Current price is: $23.00.
Forex Trading
Original price was: $2,995.00.$31.00Current price is: $31.00.

Original price was: $799.00.$15.00Current price is: $15.00.

Original price was: $997.00.$13.00Current price is: $13.00.

Forex Trading
The Complete Guide to Multiple Time Frame Analysis & Reading Price Action with Aiman Almansoori
Original price was: $1,399.00.$13.00Current price is: $13.00.

Original price was: $1,849.00.$15.00Current price is: $15.00.

Forex Trading
Original price was: $239.00.$8.00Current price is: $8.00.

Forex Trading
Original price was: $500.00.$5.00Current price is: $5.00.

Original price was: $4,995.00.$15.00Current price is: $15.00.

Forex Trading
Original price was: $125.00.$17.00Current price is: $17.00.
Forex Trading
Original price was: $1,898.00.$10.00Current price is: $10.00.
Original price was: $197.00.$5.00Current price is: $5.00.

Forex Trading
Original price was: $850.00.$23.00Current price is: $23.00.

Forex Trading
Original price was: $249.00.$15.00Current price is: $15.00.

Forex Trading
Original price was: $550.00.$5.00Current price is: $5.00.

Forex Trading
Original price was: $2,000.00.$23.00Current price is: $23.00.

Original price was: $310.00.$23.00Current price is: $23.00.
Reviews
There are no reviews yet.