-
×
 The Volume Traders 2.0 with Sebastian - The Volume Traders
1 × $5.00
The Volume Traders 2.0 with Sebastian - The Volume Traders
1 × $5.00 -
×
 Market Profile E-Course with Charles Gough - Pirate Traders
1 × $17.00
Market Profile E-Course with Charles Gough - Pirate Traders
1 × $17.00 -
×
 The Orderflows Trade Opportunities Encyclopedia with Michael Valtos
1 × $8.00
The Orderflows Trade Opportunities Encyclopedia with Michael Valtos
1 × $8.00 -
×
 The Guerrilla Online Video Course with Guerrilla Trading
1 × $5.00
The Guerrilla Online Video Course with Guerrilla Trading
1 × $5.00 -
×
 Using EasyLanguage 2000 with Arthur G.Putt, William Brower
1 × $4.00
Using EasyLanguage 2000 with Arthur G.Putt, William Brower
1 × $4.00 -
×
 The Ultimate Trading Guide & Code with George Pruitt, John R.Hill
1 × $6.00
The Ultimate Trading Guide & Code with George Pruitt, John R.Hill
1 × $6.00 -
×
 Total Fibonacci Trading with TradeSmart University
1 × $31.00
Total Fibonacci Trading with TradeSmart University
1 × $31.00 -
×
 Introduction to Candlestick (Article) with Arthur A.Hill
1 × $6.00
Introduction to Candlestick (Article) with Arthur A.Hill
1 × $6.00 -
×
 Stock Patterns for DayTrading. Home Study Course
1 × $6.00
Stock Patterns for DayTrading. Home Study Course
1 × $6.00 -
×
 Trading Short TermSame Day Trades Sep 2023 with Dan Sheridan & Mark Fenton - Sheridan Options Mentoring
1 × $31.00
Trading Short TermSame Day Trades Sep 2023 with Dan Sheridan & Mark Fenton - Sheridan Options Mentoring
1 × $31.00 -
×
 The Ed Ponsi Forex Playbook: Strategies and Trade Set-Ups with Ed Ponsi
1 × $6.00
The Ed Ponsi Forex Playbook: Strategies and Trade Set-Ups with Ed Ponsi
1 × $6.00 -
×
 Nasdaq Trading Strategies Book with French Trader
1 × $6.00
Nasdaq Trading Strategies Book with French Trader
1 × $6.00 -
×
 NFTMastermind with Charting Wizards
1 × $5.00
NFTMastermind with Charting Wizards
1 × $5.00 -
×
 TLM Virtual Trading Summit 2021 with TradeLikeMike
1 × $6.00
TLM Virtual Trading Summit 2021 with TradeLikeMike
1 × $6.00 -
×
 Top Ultimate Breakout with Top Trade Tools
1 × $6.00
Top Ultimate Breakout with Top Trade Tools
1 × $6.00 -
×
 The NDX100 Momo Stock Portfolio Trading System with Backtest Wizard
1 × $6.00
The NDX100 Momo Stock Portfolio Trading System with Backtest Wizard
1 × $6.00 -
×
 Learn to Trade Course with Mike Aston
1 × $6.00
Learn to Trade Course with Mike Aston
1 × $6.00 -
×
 Wallstreet Trappin with Wallstreet Trapper
1 × $31.00
Wallstreet Trappin with Wallstreet Trapper
1 × $31.00 -
×
 With LIVE Examples of Forex Trading
1 × $6.00
With LIVE Examples of Forex Trading
1 × $6.00 -
×
 Market Internals & Intraday Timing Webinar
1 × $6.00
Market Internals & Intraday Timing Webinar
1 × $6.00 -
×
 Advanced Spread Trading with Guy Bower - MasterClass Trader
1 × $15.00
Advanced Spread Trading with Guy Bower - MasterClass Trader
1 × $15.00 -
×
 Nico FX Journal (SMC)
1 × $5.00
Nico FX Journal (SMC)
1 × $5.00 -
×
 Intra-Day Trading Techniques CD with Greg Capra
1 × $6.00
Intra-Day Trading Techniques CD with Greg Capra
1 × $6.00 -
×
 Price Action Forex Trading Strategies Training Course & Members Videos with Nial Fuller
1 × $28.00
Price Action Forex Trading Strategies Training Course & Members Videos with Nial Fuller
1 × $28.00 -
×
 Gann’s Secret with Jeanne Long
1 × $4.00
Gann’s Secret with Jeanne Long
1 × $4.00 -
×
 Austin Passamonte Package ( Discount 25 % )
1 × $15.00
Austin Passamonte Package ( Discount 25 % )
1 × $15.00 -
×
 The Options Handbook with Bernie Schaeffer
1 × $6.00
The Options Handbook with Bernie Schaeffer
1 × $6.00 -
×
 Trade on the Fly
1 × $6.00
Trade on the Fly
1 × $6.00 -
×
 Advanced Elliott Wave Analysis : Complex Patterns, Intermarket Relationships, and Global Cash Flow Analysis
1 × $6.00
Advanced Elliott Wave Analysis : Complex Patterns, Intermarket Relationships, and Global Cash Flow Analysis
1 × $6.00 -
×
![Trading The Elliott Wave Indicator (2003) [1 MP4] by Robert Prechter image](https://www.totozon.com/wp-content/uploads/2024/05/Trading-The-Elliott-Wave-Indicator-2003-1-MP4-by-Robert-Prechter-image.png) Trading The Elliott Wave Indicator (2003) [1 MP4] - Robert Prechter
1 × $6.00
Trading The Elliott Wave Indicator (2003) [1 MP4] - Robert Prechter
1 × $6.00 -
×
 Option Hydra - June 2020 Edition - Basics By Rajandran R
1 × $23.00
Option Hydra - June 2020 Edition - Basics By Rajandran R
1 × $23.00 -
×
 Dynamic Trading Multimedia E-Learning Workshop - 6 CD with Robert Miner
1 × $39.00
Dynamic Trading Multimedia E-Learning Workshop - 6 CD with Robert Miner
1 × $39.00 -
×
 Bitcoin - Trading – Watch me manage my own account
1 × $8.00
Bitcoin - Trading – Watch me manage my own account
1 × $8.00 -
×
 The Complete Guide to Multiple Time Frame Analysis & Reading Price Action with Aiman Almansoori
1 × $13.00
The Complete Guide to Multiple Time Frame Analysis & Reading Price Action with Aiman Almansoori
1 × $13.00 -
×
 The MMXM Trader’s 2nd Course: My Personal Approach
1 × $17.00
The MMXM Trader’s 2nd Course: My Personal Approach
1 × $17.00 -
×
 Patterns of Speculation with Bertrand M.Roehner
1 × $6.00
Patterns of Speculation with Bertrand M.Roehner
1 × $6.00 -
×
 Ultimate Trading Course with Dodgy's Dungeon
1 × $8.00
Ultimate Trading Course with Dodgy's Dungeon
1 × $8.00 -
×
 Mesa & Trading Market Cycles (1st Edition) with John Ehlers & Perry Kaufman
1 × $6.00
Mesa & Trading Market Cycles (1st Edition) with John Ehlers & Perry Kaufman
1 × $6.00 -
×
 White Phoenix’s The Smart (Money) Approach to Trading with Jayson Casper
1 × $39.00
White Phoenix’s The Smart (Money) Approach to Trading with Jayson Casper
1 × $39.00 -
×
 Supreme Ecom Blueprint - Updated 2020
1 × $31.00
Supreme Ecom Blueprint - Updated 2020
1 × $31.00 -
×
 Insider Signal Exclusive Forex Course with Andy X
1 × $7.00
Insider Signal Exclusive Forex Course with Andy X
1 × $7.00 -
×
 Main Online Course with FestX
1 × $5.00
Main Online Course with FestX
1 × $5.00 -
×
 After Hour Trading Made Easy with Joe Duarte & Roland Burke
1 × $6.00
After Hour Trading Made Easy with Joe Duarte & Roland Burke
1 × $6.00 -
×
 FX At One Glance - Ichimoku First Glance Video Course
1 × $23.00
FX At One Glance - Ichimoku First Glance Video Course
1 × $23.00 -
×
 Ultimate Candlestick Bootcamp & B2 Reversal Indicator & Scanner with Steady Trader Secrets
1 × $23.00
Ultimate Candlestick Bootcamp & B2 Reversal Indicator & Scanner with Steady Trader Secrets
1 × $23.00 -
×
 The AIC-22 Workshop with Amy Meissner - Aeromir
1 × $41.00
The AIC-22 Workshop with Amy Meissner - Aeromir
1 × $41.00 -
×
 TTM Directional Day Filter System for TS
1 × $6.00
TTM Directional Day Filter System for TS
1 × $6.00 -
×
 Crypto Trading Academy with Cheeky Investor - Aussie Day Trader
1 × $13.00
Crypto Trading Academy with Cheeky Investor - Aussie Day Trader
1 × $13.00 -
×
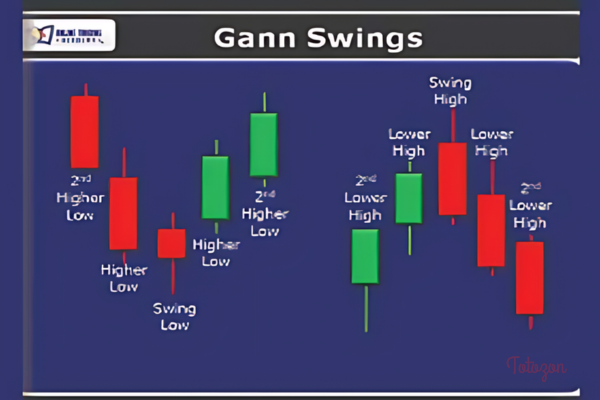 Terry Ashman’s Gann Swings Swing Trading Course (HotTrader Tutorial)
1 × $6.00
Terry Ashman’s Gann Swings Swing Trading Course (HotTrader Tutorial)
1 × $6.00 -
×
 Intermediate Stock Course
1 × $54.00
Intermediate Stock Course
1 × $54.00 -
×
 Strategies for Profiting with Japanese Candlestick Charts
1 × $6.00
Strategies for Profiting with Japanese Candlestick Charts
1 × $6.00 -
×
 Stock Split Secrets (2nd Ed.)
1 × $6.00
Stock Split Secrets (2nd Ed.)
1 × $6.00 -
×
 Cybernetic Analysis for Stocks & Futures with John Ehlers
1 × $6.00
Cybernetic Analysis for Stocks & Futures with John Ehlers
1 × $6.00 -
×
 Integrated Pitchfork Analysis (Volume 1,2,3)
1 × $6.00
Integrated Pitchfork Analysis (Volume 1,2,3)
1 × $6.00 -
×
 Trading The Curran 3-Line Break Method A Professional Strategy For Daytrading The Eminis By Chris Curran
1 × $4.00
Trading The Curran 3-Line Break Method A Professional Strategy For Daytrading The Eminis By Chris Curran
1 × $4.00 -
×
 Evolution Forex Trading
1 × $31.00
Evolution Forex Trading
1 × $31.00 -
×
 Thetimefactor - TRADING WITH PRICE
1 × $15.00
Thetimefactor - TRADING WITH PRICE
1 × $15.00 -
×
 Trading Indicators for the 21th Century
1 × $15.00
Trading Indicators for the 21th Century
1 × $15.00 -
×
 TTM Indicators Package for eSignal
1 × $6.00
TTM Indicators Package for eSignal
1 × $6.00 -
×
 Trend Following: How Great Traders Make Millions in Up or Down Markets with Michael Covel
1 × $6.00
Trend Following: How Great Traders Make Millions in Up or Down Markets with Michael Covel
1 × $6.00 -
×
 The Stock Investor's Pocket Calculator with Michael Thomsett
1 × $6.00
The Stock Investor's Pocket Calculator with Michael Thomsett
1 × $6.00 -
×
 AI For Traders with Trading Markets
1 × $31.00
AI For Traders with Trading Markets
1 × $31.00

Stock Trader`s Almanac 2012 with Jeffrey Hirsch & Yale Hirsch
$6.00
File Size: Coming soon!
Delivery Time: 1–12 hours
Media Type: Online Course
Content Proof: Watch Here!
You may check content proof of “Stock Trader`s Almanac 2012 with Jeffrey Hirsch & Yale Hirsch” below:

Stock Trader’s Almanac 2012 with Jeffrey Hirsch & Yale Hirsch
Introduction
In the ever-evolving world of stock trading, staying ahead of market trends and making informed decisions is crucial. The “Stock Trader’s Almanac 2012” by Jeffrey Hirsch and Yale Hirsch serves as an invaluable resource for traders and investors alike. This comprehensive guide combines historical data, market analysis, and strategic insights to help you navigate the complexities of the stock market with confidence.
The Legacy of the Stock Trader’s Almanac
Origins of the Almanac
The Stock Trader’s Almanac was first published by Yale Hirsch in 1967. It quickly became a trusted resource for market analysis and historical trends.
Evolution Over Time
Jeffrey Hirsch, Yale’s son, took over the mantle in the late 1990s, continuing the legacy with updated editions that reflect current market conditions.
The 2012 Edition
The 2012 edition of the Almanac is particularly notable for its insights and strategies tailored to the post-2008 financial landscape.
Key Features of the Almanac
Historical Market Data
- Monthly and Daily Data: Detailed historical data for each month and day.
- Seasonal Trends: Analysis of seasonal patterns and their impact on market performance.
Market Analysis
- Technical Indicators: Tools and indicators for technical analysis.
- Fundamental Analysis: Insights into economic indicators and their influence on the market.
Trading Strategies
- Best Six Months Strategy: A strategy focusing on the best six months of the year for stock trading.
- Santa Claus Rally: Analysis of the year-end rally phenomenon.
The Best Six Months Strategy
Understanding the Strategy
The Best Six Months Strategy suggests that the market performs best between November and April.
Historical Performance
Historical data shows that this period tends to yield higher returns compared to the rest of the year.
Implementing the Strategy
- Buy in November: Invest in the market in November.
- Sell in April: Exit positions in April to avoid the traditionally weaker months.
The Santa Claus Rally
What is the Santa Claus Rally?
The Santa Claus Rally refers to the tendency for the stock market to rise in the last week of December and the first two trading days of January.
Historical Analysis
Historical data supports the existence of this rally, with positive returns in most years.
How to Capitalize on the Rally
- Timing: Enter the market in late December.
- Exit: Consider exiting positions after the first two trading days of January.
Utilizing Technical Indicators
Moving Averages
- Simple Moving Average (SMA): Averages the closing prices over a specified period.
- Exponential Moving Average (EMA): Gives more weight to recent prices for a more responsive indicator.
Relative Strength Index (RSI)
- Overbought/Oversold Conditions: Identifies potential reversal points by measuring the speed and change of price movements.
MACD (Moving Average Convergence Divergence)
- Trend Following: Indicates bullish or bearish trends by comparing short-term and long-term moving averages.
Fundamental Analysis Insights
Economic Indicators
- GDP Growth: A key indicator of economic health.
- Unemployment Rate: Impacts consumer spending and economic stability.
Corporate Earnings
- Earnings Reports: Quarterly earnings reports provide insights into a company’s financial health.
- Earnings Per Share (EPS): Measures a company’s profitability on a per-share basis.
Seasonal Patterns and Trends
January Effect
The January Effect refers to the tendency for small-cap stocks to outperform in January.
Sell in May and Go Away
This adage suggests that the market tends to underperform from May to October.
Holiday Effect
The market often experiences positive returns on trading days preceding a holiday.
Risk Management Strategies
Stop-Loss Orders
Implementing stop-loss orders can help limit potential losses by automatically selling a security when it reaches a predetermined price.
Diversification
Diversify your portfolio to spread risk across various asset classes and sectors.
Hedging
Use options and other derivative instruments to hedge against potential market downturns.
Conclusion
The “Stock Trader’s Almanac 2012” by Jeffrey Hirsch and Yale Hirsch remains an essential tool for traders and investors looking to make informed decisions. By leveraging historical data, market analysis, and strategic insights, you can enhance your trading performance and achieve your financial goals. Stay ahead of the market trends, and let the Almanac guide you through the complexities of stock trading.

FAQs
What is the main focus of the “Stock Trader’s Almanac 2012”?
The main focus is on providing historical market data, seasonal trends, and strategic insights to aid traders and investors in making informed decisions.
How can the Best Six Months Strategy benefit traders?
The Best Six Months Strategy can help traders capitalize on the historically strong performance of the market from November to April.
What is the Santa Claus Rally?
The Santa Claus Rally refers to the tendency for the stock market to rise during the last week of December and the first two trading days of January.
How important are technical indicators in trading?
Technical indicators are crucial for analyzing market trends, identifying potential entry and exit points, and making informed trading decisions.
Why is risk management important in trading?
Risk management is essential to protect your investment capital and minimize potential losses in the volatile stock market.
Be the first to review “Stock Trader`s Almanac 2012 with Jeffrey Hirsch & Yale Hirsch”
You must be logged in to post a review.
Related products

Forex Trading
Original price was: $499.00.$15.00Current price is: $15.00.

Original price was: $1,800.00.$54.00Current price is: $54.00.
Original price was: $299.00.$8.00Current price is: $8.00.
Forex Trading
Original price was: $1,898.00.$10.00Current price is: $10.00.

Original price was: $997.00.$13.00Current price is: $13.00.

Original price was: $497.00.$31.00Current price is: $31.00.

Forex Trading
Original price was: $999.00.$15.00Current price is: $15.00.

Forex Trading
Original price was: $550.00.$5.00Current price is: $5.00.

Original price was: $1,200.00.$23.00Current price is: $23.00.
Original price was: $700.00.$39.00Current price is: $39.00.

Forex Trading
Original price was: $2,000.00.$23.00Current price is: $23.00.

Original price was: $139.00.$23.00Current price is: $23.00.

Original price was: $2,120.00.$15.00Current price is: $15.00.
Forex Trading
The Complete Guide to Multiple Time Frame Analysis & Reading Price Action with Aiman Almansoori
Original price was: $1,399.00.$13.00Current price is: $13.00.
Forex Trading
Original price was: $2,995.00.$31.00Current price is: $31.00.

Forex Trading
Original price was: $125.00.$17.00Current price is: $17.00.

Original price was: $450.00.$23.00Current price is: $23.00.

Forex Trading
Original price was: $2,997.00.$23.00Current price is: $23.00.

Original price was: $4,995.00.$15.00Current price is: $15.00.

Forex Trading
Original price was: $249.00.$15.00Current price is: $15.00.
Reviews
There are no reviews yet.