-
×
 Hit and Run Trading Updated Version with Jeff Cooper
1 × $6.00
Hit and Run Trading Updated Version with Jeff Cooper
1 × $6.00 -
×
 Forex Secrets Exposed
1 × $15.00
Forex Secrets Exposed
1 × $15.00 -
×
 Four Steps to Trading Economic Indicators
1 × $6.00
Four Steps to Trading Economic Indicators
1 × $6.00 -
×
 Linda Raschke Short Term Trading Strategies with David Vomund
1 × $6.00
Linda Raschke Short Term Trading Strategies with David Vomund
1 × $6.00 -
×
 Trident. A Trading Strategy with Charles L.Lindsay
1 × $6.00
Trident. A Trading Strategy with Charles L.Lindsay
1 × $6.00 -
×
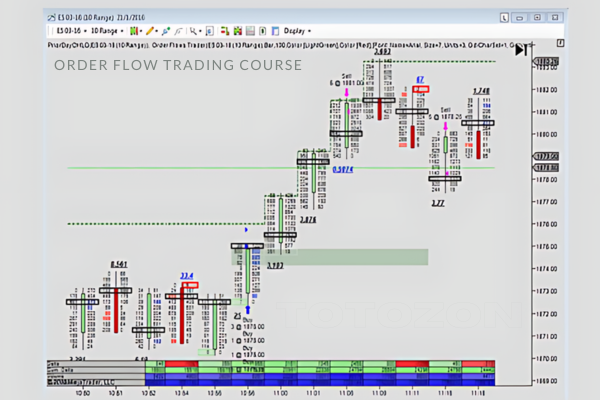 Order Flow Trading Course with Orderflows
1 × $23.00
Order Flow Trading Course with Orderflows
1 × $23.00 -
×
 Options Mastery 32 DVDs
1 × $6.00
Options Mastery 32 DVDs
1 × $6.00 -
×
 Naked Put Selling Acquiring Blue Chip Stocks and Creating Cash Flow with Lee Lowell
1 × $6.00
Naked Put Selling Acquiring Blue Chip Stocks and Creating Cash Flow with Lee Lowell
1 × $6.00 -
×
 Inside the Mind of Trader Stewie - Art of Trading
1 × $23.00
Inside the Mind of Trader Stewie - Art of Trading
1 × $23.00 -
×
 Unlearn and Relearn with Market Fluidity
1 × $6.00
Unlearn and Relearn with Market Fluidity
1 × $6.00 -
×
 0 DTE Options Trading Workshop with Aeromir Corporation
1 × $15.00
0 DTE Options Trading Workshop with Aeromir Corporation
1 × $15.00 -
×
 Matrix Spread Options Trading Course with Base Camp Trading
1 × $31.00
Matrix Spread Options Trading Course with Base Camp Trading
1 × $31.00 -
×
 Deep Dive Butterfly Trading Strategy Class with SJG Trades
1 × $41.00
Deep Dive Butterfly Trading Strategy Class with SJG Trades
1 × $41.00 -
×
 Wave Trading
1 × $23.00
Wave Trading
1 × $23.00 -
×
 Forecast 2024 Clarification with Larry Williams
1 × $15.00
Forecast 2024 Clarification with Larry Williams
1 × $15.00 -
×
 BWT Precision 7.0.2.3 (bluewavetrading.com)
1 × $31.00
BWT Precision 7.0.2.3 (bluewavetrading.com)
1 × $31.00 -
×
 Ichimoku Cloud Trading Course with FollowMeTrades
1 × $15.00
Ichimoku Cloud Trading Course with FollowMeTrades
1 × $15.00 -
×
 Trading Analysis Crash Course
1 × $23.00
Trading Analysis Crash Course
1 × $23.00 -
×
 OTC Oracle Course - PENNY WHALE with Simple Trade
1 × $31.00
OTC Oracle Course - PENNY WHALE with Simple Trade
1 × $31.00 -
×
 Mql4 Bundle: Basics, Scripts, Indicators, Experts with Jim Hodges
1 × $15.00
Mql4 Bundle: Basics, Scripts, Indicators, Experts with Jim Hodges
1 × $15.00 -
×
 The Complete Day Trading Course (New 2020)
1 × $6.00
The Complete Day Trading Course (New 2020)
1 × $6.00 -
×
 MLT Divergence Indicator with Major League Trading
1 × $23.00
MLT Divergence Indicator with Major League Trading
1 × $23.00 -
×
 Wall Street Stories with Edwin Lefevre
1 × $6.00
Wall Street Stories with Edwin Lefevre
1 × $6.00 -
×
 Best of the Best: Collars with Amy Meissner & Scott Ruble
1 × $15.00
Best of the Best: Collars with Amy Meissner & Scott Ruble
1 × $15.00 -
×
 Wave Trader Software 2004 with Bryce Gilmore
1 × $6.00
Wave Trader Software 2004 with Bryce Gilmore
1 × $6.00 -
×
 Stock Patterns for DayTrading I & II with Barry Rudd
1 × $6.00
Stock Patterns for DayTrading I & II with Barry Rudd
1 × $6.00 -
×
 Daytraders Bulletin – Recurrent Structures for Profit with Charles Holt
1 × $6.00
Daytraders Bulletin – Recurrent Structures for Profit with Charles Holt
1 × $6.00 -
×
 E-mini Weekly Options Income with Peter Titus
1 × $15.00
E-mini Weekly Options Income with Peter Titus
1 × $15.00 -
×
 Emini Day Trading Boot Camp - Base Camp Trading
1 × $6.00
Emini Day Trading Boot Camp - Base Camp Trading
1 × $6.00 -
×
 Creating & Using a Trading Plan with Paul Lange
1 × $8.00
Creating & Using a Trading Plan with Paul Lange
1 × $8.00 -
×
 Setups, Entries, and Stops with Rob Hoffman - Become A Better Trader
1 × $6.00
Setups, Entries, and Stops with Rob Hoffman - Become A Better Trader
1 × $6.00 -
×
 Tandem Trader - The Ultimate Day Trading Course with Nathan Michaud - Investors Underground
1 × $54.00
Tandem Trader - The Ultimate Day Trading Course with Nathan Michaud - Investors Underground
1 × $54.00 -
×
 Management Consultancy & Banking in a Era of Globalization
1 × $6.00
Management Consultancy & Banking in a Era of Globalization
1 × $6.00 -
×
 Bear Market Investing Strategies with Harry Schultz
1 × $6.00
Bear Market Investing Strategies with Harry Schultz
1 × $6.00 -
×
 Foundation Options - Time Decay, Implied Volatility, Greeks
1 × $6.00
Foundation Options - Time Decay, Implied Volatility, Greeks
1 × $6.00 -
×
 Trading Earnings Using Measured-Move Targets with AlphaShark
1 × $23.00
Trading Earnings Using Measured-Move Targets with AlphaShark
1 × $23.00 -
×
 Using the Techniques of Andrews & Babson
1 × $6.00
Using the Techniques of Andrews & Babson
1 × $6.00 -
×
 Ultimate Trading Course with Dodgy's Dungeon
1 × $8.00
Ultimate Trading Course with Dodgy's Dungeon
1 × $8.00

Stock Trader`s Almanac 2012 with Jeffrey Hirsch & Yale Hirsch
$6.00
File Size: Coming soon!
Delivery Time: 1–12 hours
Media Type: Online Course
Content Proof: Watch Here!
You may check content proof of “Stock Trader`s Almanac 2012 with Jeffrey Hirsch & Yale Hirsch” below:

Stock Trader’s Almanac 2012 with Jeffrey Hirsch & Yale Hirsch
Introduction
In the ever-evolving world of stock trading, staying ahead of market trends and making informed decisions is crucial. The “Stock Trader’s Almanac 2012” by Jeffrey Hirsch and Yale Hirsch serves as an invaluable resource for traders and investors alike. This comprehensive guide combines historical data, market analysis, and strategic insights to help you navigate the complexities of the stock market with confidence.
The Legacy of the Stock Trader’s Almanac
Origins of the Almanac
The Stock Trader’s Almanac was first published by Yale Hirsch in 1967. It quickly became a trusted resource for market analysis and historical trends.
Evolution Over Time
Jeffrey Hirsch, Yale’s son, took over the mantle in the late 1990s, continuing the legacy with updated editions that reflect current market conditions.
The 2012 Edition
The 2012 edition of the Almanac is particularly notable for its insights and strategies tailored to the post-2008 financial landscape.
Key Features of the Almanac
Historical Market Data
- Monthly and Daily Data: Detailed historical data for each month and day.
- Seasonal Trends: Analysis of seasonal patterns and their impact on market performance.
Market Analysis
- Technical Indicators: Tools and indicators for technical analysis.
- Fundamental Analysis: Insights into economic indicators and their influence on the market.
Trading Strategies
- Best Six Months Strategy: A strategy focusing on the best six months of the year for stock trading.
- Santa Claus Rally: Analysis of the year-end rally phenomenon.
The Best Six Months Strategy
Understanding the Strategy
The Best Six Months Strategy suggests that the market performs best between November and April.
Historical Performance
Historical data shows that this period tends to yield higher returns compared to the rest of the year.
Implementing the Strategy
- Buy in November: Invest in the market in November.
- Sell in April: Exit positions in April to avoid the traditionally weaker months.
The Santa Claus Rally
What is the Santa Claus Rally?
The Santa Claus Rally refers to the tendency for the stock market to rise in the last week of December and the first two trading days of January.
Historical Analysis
Historical data supports the existence of this rally, with positive returns in most years.
How to Capitalize on the Rally
- Timing: Enter the market in late December.
- Exit: Consider exiting positions after the first two trading days of January.
Utilizing Technical Indicators
Moving Averages
- Simple Moving Average (SMA): Averages the closing prices over a specified period.
- Exponential Moving Average (EMA): Gives more weight to recent prices for a more responsive indicator.
Relative Strength Index (RSI)
- Overbought/Oversold Conditions: Identifies potential reversal points by measuring the speed and change of price movements.
MACD (Moving Average Convergence Divergence)
- Trend Following: Indicates bullish or bearish trends by comparing short-term and long-term moving averages.
Fundamental Analysis Insights
Economic Indicators
- GDP Growth: A key indicator of economic health.
- Unemployment Rate: Impacts consumer spending and economic stability.
Corporate Earnings
- Earnings Reports: Quarterly earnings reports provide insights into a company’s financial health.
- Earnings Per Share (EPS): Measures a company’s profitability on a per-share basis.
Seasonal Patterns and Trends
January Effect
The January Effect refers to the tendency for small-cap stocks to outperform in January.
Sell in May and Go Away
This adage suggests that the market tends to underperform from May to October.
Holiday Effect
The market often experiences positive returns on trading days preceding a holiday.
Risk Management Strategies
Stop-Loss Orders
Implementing stop-loss orders can help limit potential losses by automatically selling a security when it reaches a predetermined price.
Diversification
Diversify your portfolio to spread risk across various asset classes and sectors.
Hedging
Use options and other derivative instruments to hedge against potential market downturns.
Conclusion
The “Stock Trader’s Almanac 2012” by Jeffrey Hirsch and Yale Hirsch remains an essential tool for traders and investors looking to make informed decisions. By leveraging historical data, market analysis, and strategic insights, you can enhance your trading performance and achieve your financial goals. Stay ahead of the market trends, and let the Almanac guide you through the complexities of stock trading.

FAQs
What is the main focus of the “Stock Trader’s Almanac 2012”?
The main focus is on providing historical market data, seasonal trends, and strategic insights to aid traders and investors in making informed decisions.
How can the Best Six Months Strategy benefit traders?
The Best Six Months Strategy can help traders capitalize on the historically strong performance of the market from November to April.
What is the Santa Claus Rally?
The Santa Claus Rally refers to the tendency for the stock market to rise during the last week of December and the first two trading days of January.
How important are technical indicators in trading?
Technical indicators are crucial for analyzing market trends, identifying potential entry and exit points, and making informed trading decisions.
Why is risk management important in trading?
Risk management is essential to protect your investment capital and minimize potential losses in the volatile stock market.
Be the first to review “Stock Trader`s Almanac 2012 with Jeffrey Hirsch & Yale Hirsch”
You must be logged in to post a review.
Related products

Original price was: $197.00.$5.00Current price is: $5.00.

Forex Trading
Original price was: $397.00.$31.00Current price is: $31.00.

Forex Trading
Original price was: $850.00.$23.00Current price is: $23.00.

Forex Trading
Original price was: $550.00.$5.00Current price is: $5.00.
Forex Trading
Original price was: $249.00.$15.00Current price is: $15.00.
Forex Trading
Original price was: $1,898.00.$10.00Current price is: $10.00.

Forex Trading
Original price was: $697.00.$5.00Current price is: $5.00.

Forex Trading
Original price was: $799.00.$15.00Current price is: $15.00.

Forex Trading
Original price was: $1,098.00.$39.00Current price is: $39.00.
Original price was: $497.00.$31.00Current price is: $31.00.
Forex Trading
Original price was: $999.00.$15.00Current price is: $15.00.
Original price was: $799.00.$15.00Current price is: $15.00.

Original price was: $1,200.00.$23.00Current price is: $23.00.

Forex Trading
Original price was: $2,000.00.$23.00Current price is: $23.00.

Original price was: $895.00.$15.00Current price is: $15.00.

Original price was: $139.00.$23.00Current price is: $23.00.

Original price was: $497.00.$11.00Current price is: $11.00.

Original price was: $450.00.$23.00Current price is: $23.00.

Forex Trading
The Complete Guide to Multiple Time Frame Analysis & Reading Price Action with Aiman Almansoori
Original price was: $1,399.00.$13.00Current price is: $13.00.

Original price was: $299.00.$8.00Current price is: $8.00.
Reviews
There are no reviews yet.