-
×
 Affinity Foundation Stocks Course with Affinitytrading
1 × $6.00
Affinity Foundation Stocks Course with Affinitytrading
1 × $6.00 -
×
 Real-Time Course with Rich Swannell
1 × $6.00
Real-Time Course with Rich Swannell
1 × $6.00 -
×
 The Hedge Fund Edge. Maximum Profit, Minimum Risk. Global Trading Trend Strategies - Mark Boucher
1 × $6.00
The Hedge Fund Edge. Maximum Profit, Minimum Risk. Global Trading Trend Strategies - Mark Boucher
1 × $6.00 -
×
 Scalp Strategy and Flipping Small Accounts with Opes Trading Group
1 × $5.00
Scalp Strategy and Flipping Small Accounts with Opes Trading Group
1 × $5.00 -
×
 Evolution Markets (Full Main Course)
1 × $5.00
Evolution Markets (Full Main Course)
1 × $5.00 -
×
 0 DTE Options Trading Workshop with Aeromir Corporation
1 × $15.00
0 DTE Options Trading Workshop with Aeromir Corporation
1 × $15.00 -
×
 SQX Mentorship with Tip Toe Hippo
1 × $23.00
SQX Mentorship with Tip Toe Hippo
1 × $23.00 -
×
 Trading Short TermSame Day Trades Sep 2023 with Dan Sheridan & Mark Fenton - Sheridan Options Mentoring
1 × $31.00
Trading Short TermSame Day Trades Sep 2023 with Dan Sheridan & Mark Fenton - Sheridan Options Mentoring
1 × $31.00 -
×
 The Orderflow Masterclass with PrimeTrading
1 × $17.00
The Orderflow Masterclass with PrimeTrading
1 × $17.00 -
×
 Ichimoku Traders Academy with Tyler Espitia
1 × $31.00
Ichimoku Traders Academy with Tyler Espitia
1 × $31.00 -
×
 The Naked Eye: Raw Data Analytics with Edgar Torres - Raw Data Analytics
1 × $8.00
The Naked Eye: Raw Data Analytics with Edgar Torres - Raw Data Analytics
1 × $8.00 -
×
 FX Masterclass 2.0 with Uprise Academy
1 × $26.00
FX Masterclass 2.0 with Uprise Academy
1 × $26.00 -
×
 Trading High-Momentum Stocks with Landry Persistent Pullbacks
1 × $15.00
Trading High-Momentum Stocks with Landry Persistent Pullbacks
1 × $15.00 -
×
 Algo Trading Masterclass with Ali Casey - StatOasis
1 × $23.00
Algo Trading Masterclass with Ali Casey - StatOasis
1 × $23.00 -
×
 Price Action Trading with Bill Eykyn
1 × $6.00
Price Action Trading with Bill Eykyn
1 × $6.00 -
×
 ICT Prodigy Trading Course – $650K in Payouts with Alex Solignani
1 × $15.00
ICT Prodigy Trading Course – $650K in Payouts with Alex Solignani
1 × $15.00 -
×
 Best of the Best: Collars with Amy Meissner & Scott Ruble
1 × $15.00
Best of the Best: Collars with Amy Meissner & Scott Ruble
1 × $15.00 -
×
 Order flow self-study training program with iMFtracker
1 × $10.00
Order flow self-study training program with iMFtracker
1 × $10.00 -
×
 The Best Option Trading Course with David Jaffee - Best Stock Strategy
1 × $15.00
The Best Option Trading Course with David Jaffee - Best Stock Strategy
1 × $15.00 -
×
 Options Trading & Ultimate MasterClass With Tyrone Abela - FX Evolution
1 × $54.00
Options Trading & Ultimate MasterClass With Tyrone Abela - FX Evolution
1 × $54.00 -
×
 Compass Trading System with Right Line Trading
1 × $39.00
Compass Trading System with Right Line Trading
1 × $39.00 -
×
 Option Screening. Finding Profitable Trades with Lawrence Gavanagh
1 × $6.00
Option Screening. Finding Profitable Trades with Lawrence Gavanagh
1 × $6.00 -
×
 Bond Market Course with The Macro Compass
1 × $15.00
Bond Market Course with The Macro Compass
1 × $15.00 -
×
 TRADING NFX Course with Andrew NFX
1 × $5.00
TRADING NFX Course with Andrew NFX
1 × $5.00 -
×
 Forex Strategy Master
1 × $31.00
Forex Strategy Master
1 × $31.00 -
×
 Traders Forge with Ryan Litchfield
1 × $6.00
Traders Forge with Ryan Litchfield
1 × $6.00 -
×
 The Orderflows Trade Opportunities Encyclopedia with Michael Valtos
1 × $8.00
The Orderflows Trade Opportunities Encyclopedia with Michael Valtos
1 × $8.00 -
×
 WondaFX Signature Strategy with WondaFX
1 × $5.00
WondaFX Signature Strategy with WondaFX
1 × $5.00 -
×
 Essentials in Quantitative Trading QT01 By HangukQuant's
1 × $23.00
Essentials in Quantitative Trading QT01 By HangukQuant's
1 × $23.00 -
×
 The Poor Man’s Gamma Scalp
1 × $54.00
The Poor Man’s Gamma Scalp
1 × $54.00 -
×
 How to Create & Manage a Mutal Fund or ETF with Melinda Gerber
1 × $6.00
How to Create & Manage a Mutal Fund or ETF with Melinda Gerber
1 × $6.00 -
×
 TradeCraft: Your Path to Peak Performance Trading By Adam Grimes
1 × $15.00
TradeCraft: Your Path to Peak Performance Trading By Adam Grimes
1 × $15.00 -
×
 Insiders guide to Trading Weekly Options with John Carter
1 × $54.00
Insiders guide to Trading Weekly Options with John Carter
1 × $54.00 -
×
 Generate Weekly Income by Trend-Trading Stocks Intraday Class with Corey Rosenbloom
1 × $6.00
Generate Weekly Income by Trend-Trading Stocks Intraday Class with Corey Rosenbloom
1 × $6.00 -
×
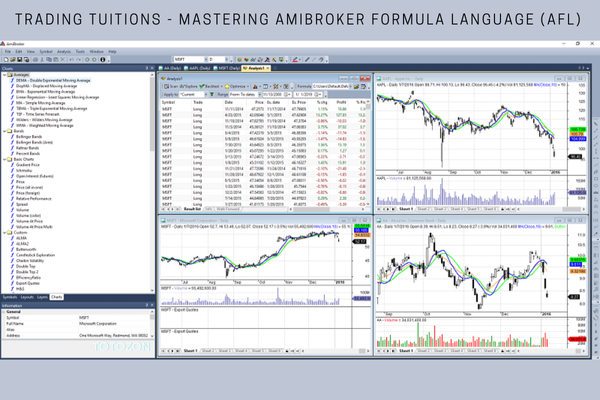 Trading Tuitions - Mastering Amibroker Formula Language (AFL)
1 × $15.00
Trading Tuitions - Mastering Amibroker Formula Language (AFL)
1 × $15.00 -
×
 Deep Dive Butterfly Trading Strategy Class with SJG Trades
1 × $41.00
Deep Dive Butterfly Trading Strategy Class with SJG Trades
1 × $41.00 -
×
 Advanced Spread Trading with Guy Bower - MasterClass Trader
1 × $15.00
Advanced Spread Trading with Guy Bower - MasterClass Trader
1 × $15.00 -
×
 Big Fish Shark Bite Strategy
1 × $15.00
Big Fish Shark Bite Strategy
1 × $15.00 -
×
 Currency Trading Seminar with Peter Bain
1 × $6.00
Currency Trading Seminar with Peter Bain
1 × $6.00 -
×
 30 Days to Market Mastery: A Step-by-Step Guide to Profitable Trading with Jack Bernstein
1 × $6.00
30 Days to Market Mastery: A Step-by-Step Guide to Profitable Trading with Jack Bernstein
1 × $6.00 -
×
 Market Profile Training with Futexlive
1 × $23.00
Market Profile Training with Futexlive
1 × $23.00 -
×
 Butterfly and Condor Workshop with Aeromir
1 × $15.00
Butterfly and Condor Workshop with Aeromir
1 × $15.00 -
×
 Edges For Ledges 2 with Trader Dante
1 × $5.00
Edges For Ledges 2 with Trader Dante
1 × $5.00 -
×
 Ultimate Trading Course with Dodgy's Dungeon
1 × $8.00
Ultimate Trading Course with Dodgy's Dungeon
1 × $8.00 -
×
 W. D Gann 's Square Of 9 Applied To Modern Markets with Sean Avidar - Hexatrade350
1 × $23.00
W. D Gann 's Square Of 9 Applied To Modern Markets with Sean Avidar - Hexatrade350
1 × $23.00 -
×
 How to Make 1 Million Per Year Like Larry Williams with Larry Williams
1 × $6.00
How to Make 1 Million Per Year Like Larry Williams with Larry Williams
1 × $6.00 -
×
 The Trading Blueprint with Brad Goh - The Trading Geek
1 × $5.00
The Trading Blueprint with Brad Goh - The Trading Geek
1 × $5.00 -
×
 Quantamentals - The Next Great Forefront Of Trading and Investing with Trading Markets
1 × $8.00
Quantamentals - The Next Great Forefront Of Trading and Investing with Trading Markets
1 × $8.00 -
×
 The A14 Weekly Option Strategy Workshop with Amy Meissner
1 × $23.00
The A14 Weekly Option Strategy Workshop with Amy Meissner
1 × $23.00 -
×
 The Complete Guide to Multiple Time Frame Analysis & Reading Price Action with Aiman Almansoori
1 × $13.00
The Complete Guide to Multiple Time Frame Analysis & Reading Price Action with Aiman Almansoori
1 × $13.00 -
×
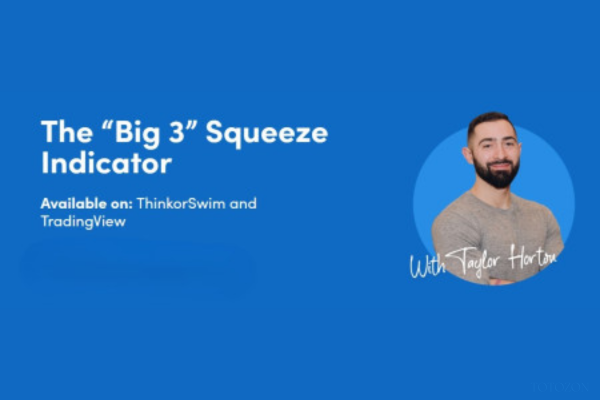 The Big 3 Squeeze Indicator TOS 2024 with Taylor Horton
1 × $69.00
The Big 3 Squeeze Indicator TOS 2024 with Taylor Horton
1 × $69.00 -
×
 The Indices Orderflow Masterclass with The Forex Scalpers
1 × $23.00
The Indices Orderflow Masterclass with The Forex Scalpers
1 × $23.00 -
×
 The Handbook of Pairs Trading with Douglas Ehrman
1 × $6.00
The Handbook of Pairs Trading with Douglas Ehrman
1 × $6.00 -
×
 Trade The Price Action with Thomas Wood (Valuecharts)
1 × $15.00
Trade The Price Action with Thomas Wood (Valuecharts)
1 × $15.00 -
×
 High Probability Trading Using Elliott Wave And Fibonacci Analysis withVic Patel - Forex Training Group
1 × $10.00
High Probability Trading Using Elliott Wave And Fibonacci Analysis withVic Patel - Forex Training Group
1 × $10.00

Stock Traders Almanac 2010 with Jeffrey Hirsch & Yale Hirsch
$6.00
File Size: Coming soon!
Delivery Time: 1–12 hours
Media Type: Online Course
Stock Traders Almanac 2010 with Jeffrey Hirsch & Yale Hirsch
Introduction
The “Stock Traders Almanac 2010” by Jeffrey Hirsch and Yale Hirsch is a treasure trove of insights, data, and strategies designed to help traders navigate the complex world of stock markets. This edition continues the legacy of providing invaluable information for both novice and experienced traders. In this article, we explore the key features and benefits of the 2010 Almanac, highlighting how it can enhance your trading strategy.
The Legacy of the Stock Traders Almanac
The Origins of the Almanac
The Stock Traders Almanac was first published in 1967 by Yale Hirsch. It quickly gained a reputation for its detailed market analysis and historical data.
Evolution of the Almanac
Over the years, the Almanac has evolved to include modern trading strategies and tools. Jeffrey Hirsch, Yale’s son, has carried forward this tradition, ensuring the Almanac remains relevant in changing market conditions.
The 2010 Edition
The 2010 edition of the Almanac is particularly significant, offering strategies tailored to the post-2008 financial crisis market landscape.
Key Features of the 2010 Almanac
Historical Market Data
- Monthly and Daily Data: The Almanac provides detailed historical data for each month and day, helping traders identify patterns and trends.
- Seasonal Trends: Analysis of seasonal patterns and their impact on market performance.
Market Analysis
- Technical Indicators: Tools and indicators for technical analysis, such as moving averages and RSI.
- Fundamental Analysis: Insights into economic indicators and their influence on the market.
Trading Strategies
- Best Six Months Strategy: Focuses on the most profitable months of the year for stock trading.
- Santa Claus Rally: Examination of the year-end rally phenomenon.
The Best Six Months Strategy
Understanding the Strategy
The Best Six Months Strategy suggests that the stock market performs best from November to April. This strategy is based on historical performance data.
Historical Performance
Historically, the market has shown higher returns during these six months compared to the rest of the year.
Implementing the Strategy
- Buy in November: Enter the market in November.
- Sell in April: Exit positions in April to avoid the traditionally weaker months.
The Santa Claus Rally
What is the Santa Claus Rally?
The Santa Claus Rally refers to the tendency for the stock market to rise in the last week of December and the first two trading days of January.
Historical Analysis
Historical data supports the existence of this rally, with positive returns in most years.
How to Capitalize on the Rally
- Timing: Enter the market in late December.
- Exit: Consider exiting positions after the first two trading days of January.
Utilizing Technical Indicators
Moving Averages
- Simple Moving Average (SMA): Averages the closing prices over a specified period.
- Exponential Moving Average (EMA): Gives more weight to recent prices for a more responsive indicator.
Relative Strength Index (RSI)
- Overbought/Oversold Conditions: Identifies potential reversal points by measuring the speed and change of price movements.
MACD (Moving Average Convergence Divergence)
- Trend Following: Indicates bullish or bearish trends by comparing short-term and long-term moving averages.
Fundamental Analysis Insights
Economic Indicators
- GDP Growth: A key indicator of economic health.
- Unemployment Rate: Impacts consumer spending and economic stability.
Corporate Earnings
- Earnings Reports: Quarterly earnings reports provide insights into a company’s financial health.
- Earnings Per Share (EPS): Measures a company’s profitability on a per-share basis.
Seasonal Patterns and Trends
January Effect
The January Effect refers to the tendency for small-cap stocks to outperform in January.
Sell in May and Go Away
This adage suggests that the market tends to underperform from May to October.
Holiday Effect
The market often experiences positive returns on trading days preceding a holiday.
Risk Management Strategies
Stop-Loss Orders
Implementing stop-loss orders can help limit potential losses by automatically selling a security when it reaches a predetermined price.
Diversification
Diversify your portfolio to spread risk across various asset classes and sectors.
Hedging
Use options and other derivative instruments to hedge against potential market downturns.
Behavioral Finance
What is Behavioral Finance?
Behavioral finance examines how psychological factors affect market outcomes and investment decisions.
Common Behavioral Biases
- Overconfidence
- Herding
- Loss Aversion
Understanding Financial News
Importance of Financial News
Staying informed about financial news helps you make timely and informed investment decisions.
Reliable Sources of Financial News
- Financial Times
- Wall Street Journal
- Bloomberg
Building a Strong Portfolio
Components of a Strong Portfolio
A well-balanced portfolio includes a mix of stocks, bonds, and other asset classes.
Portfolio Rebalancing
Regularly review and adjust your portfolio to maintain your desired asset allocation.
Evaluating Portfolio Performance
Measure your portfolio’s performance against relevant benchmarks to ensure it meets your financial goals.
Conclusion
The “Stock Traders Almanac 2010” by Jeffrey Hirsch and Yale Hirsch remains an essential tool for traders and investors looking to make informed decisions. By leveraging historical data, market analysis, and strategic insights, you can enhance your trading performance and achieve your financial goals. Stay ahead of the market trends, and let the Almanac guide you through the complexities of stock trading.
FAQs
What is the main focus of the “Stock Traders Almanac 2010”?
The main focus is on providing historical market data, seasonal trends, and strategic insights to aid traders and investors in making informed decisions.
How can the Best Six Months Strategy benefit traders?
The Best Six Months Strategy can help traders capitalize on the historically strong performance of the market from November to April.
What is the Santa Claus Rally?
The Santa Claus Rally refers to the tendency for the stock market to rise during the last week of December and the first two trading days of January.
How important are technical indicators in trading?
Technical indicators are crucial for analyzing market trends, identifying potential entry and exit points, and making informed trading decisions.
Why is risk management important in trading?
Risk management is essential to protect your investment capital and minimize potential losses in the volatile stock market.
Be the first to review “Stock Traders Almanac 2010 with Jeffrey Hirsch & Yale Hirsch”
You must be logged in to post a review.
Related products

Forex Trading
Original price was: $249.00.$15.00Current price is: $15.00.
Forex Trading
Original price was: $397.00.$31.00Current price is: $31.00.
Original price was: $1,800.00.$54.00Current price is: $54.00.
Forex Trading
Original price was: $125.00.$17.00Current price is: $17.00.
Forex Trading
Original price was: $2,997.00.$23.00Current price is: $23.00.
Forex Trading
Original price was: $499.00.$15.00Current price is: $15.00.

Original price was: $649.00.$20.00Current price is: $20.00.
Forex Trading
Original price was: $550.00.$5.00Current price is: $5.00.
Original price was: $299.00.$8.00Current price is: $8.00.

Original price was: $497.00.$31.00Current price is: $31.00.
Original price was: $999.00.$5.00Current price is: $5.00.
Original price was: $1,849.00.$15.00Current price is: $15.00.
Original price was: $310.00.$23.00Current price is: $23.00.

Original price was: $700.00.$39.00Current price is: $39.00.

Forex Trading
Original price was: $2,995.00.$31.00Current price is: $31.00.
Forex Trading
Original price was: $999.00.$15.00Current price is: $15.00.
Original price was: $895.00.$15.00Current price is: $15.00.
Original price was: $695.00.$41.00Current price is: $41.00.
Original price was: $4,995.00.$15.00Current price is: $15.00.
Forex Trading
Original price was: $239.00.$8.00Current price is: $8.00.
Reviews
There are no reviews yet.