-
×
 Forecast 2024 Clarification with Larry Williams
1 × $15.00
Forecast 2024 Clarification with Larry Williams
1 × $15.00 -
×
 Quantamentals - The Next Great Forefront Of Trading and Investing with Trading Markets
1 × $8.00
Quantamentals - The Next Great Forefront Of Trading and Investing with Trading Markets
1 × $8.00 -
×
 Intra-Day Trading Techniques CD with Greg Capra
1 × $6.00
Intra-Day Trading Techniques CD with Greg Capra
1 × $6.00 -
×
 TRADING NFX Course with Andrew NFX
1 × $5.00
TRADING NFX Course with Andrew NFX
1 × $5.00 -
×
 The Prop Trading Code with Brannigan Barrett - Axia Futures
1 × $23.00
The Prop Trading Code with Brannigan Barrett - Axia Futures
1 × $23.00 -
×
 Best of the Best: Collars with Amy Meissner & Scott Ruble
1 × $15.00
Best of the Best: Collars with Amy Meissner & Scott Ruble
1 × $15.00 -
×
 Crystal Ball Pack PLUS bonus Live Trade By Pat Mitchell - Trick Trades
1 × $20.00
Crystal Ball Pack PLUS bonus Live Trade By Pat Mitchell - Trick Trades
1 × $20.00 -
×
 Compass Trading System with Right Line Trading
1 × $39.00
Compass Trading System with Right Line Trading
1 × $39.00 -
×
 The Best Option Trading Course with David Jaffee - Best Stock Strategy
1 × $15.00
The Best Option Trading Course with David Jaffee - Best Stock Strategy
1 × $15.00 -
×
 Home Run Options Trading Course with Dave Aquino - Base Camp Trading
1 × $11.00
Home Run Options Trading Course with Dave Aquino - Base Camp Trading
1 × $11.00 -
×
 Order flow self-study training program with iMFtracker
1 × $10.00
Order flow self-study training program with iMFtracker
1 × $10.00 -
×
 One-way Formula for Trading in Stocks and Commodities with William Dunnigan
1 × $6.00
One-way Formula for Trading in Stocks and Commodities with William Dunnigan
1 × $6.00 -
×
 Matrix Spread Options Trading Course with Base Camp Trading
1 × $31.00
Matrix Spread Options Trading Course with Base Camp Trading
1 × $31.00 -
×
 Options Trading & Ultimate MasterClass With Tyrone Abela - FX Evolution
1 × $54.00
Options Trading & Ultimate MasterClass With Tyrone Abela - FX Evolution
1 × $54.00 -
×
 White Phoenix’s The Smart (Money) Approach to Trading with Jayson Casper
1 × $39.00
White Phoenix’s The Smart (Money) Approach to Trading with Jayson Casper
1 × $39.00 -
×
 Forex Strategies Guide for Day and Swing Traders with Cory Mitchell - Vantage Point Trading
1 × $4.00
Forex Strategies Guide for Day and Swing Traders with Cory Mitchell - Vantage Point Trading
1 × $4.00 -
×
 W. D Gann 's Square Of 9 Applied To Modern Markets with Sean Avidar - Hexatrade350
1 × $23.00
W. D Gann 's Square Of 9 Applied To Modern Markets with Sean Avidar - Hexatrade350
1 × $23.00 -
×
 The Four Biggest Mistakes in Futures Trading (1st Edition) with Jay Kaeppel
1 × $6.00
The Four Biggest Mistakes in Futures Trading (1st Edition) with Jay Kaeppel
1 × $6.00 -
×
 The A14 Weekly Option Strategy Workshop with Amy Meissner
1 × $23.00
The A14 Weekly Option Strategy Workshop with Amy Meissner
1 × $23.00 -
×
 iMF Tracker – Order Flow Program 2023
1 × $5.00
iMF Tracker – Order Flow Program 2023
1 × $5.00 -
×
 Algo Trading Masterclass with Ali Casey - StatOasis
1 × $23.00
Algo Trading Masterclass with Ali Casey - StatOasis
1 × $23.00 -
×
 Monster IPO with Trick Trades
1 × $23.00
Monster IPO with Trick Trades
1 × $23.00 -
×
 Trading Connors VIX Reversals Tradestation Files with Laurence A. Connors & Gregory J. Che
1 × $6.00
Trading Connors VIX Reversals Tradestation Files with Laurence A. Connors & Gregory J. Che
1 × $6.00 -
×
 Scalp Strategy and Flipping Small Accounts with Opes Trading Group
1 × $5.00
Scalp Strategy and Flipping Small Accounts with Opes Trading Group
1 × $5.00 -
×
 0 DTE Options Trading Workshop with Aeromir Corporation
1 × $15.00
0 DTE Options Trading Workshop with Aeromir Corporation
1 × $15.00 -
×
 Essentials in Quantitative Trading QT01 By HangukQuant's
1 × $23.00
Essentials in Quantitative Trading QT01 By HangukQuant's
1 × $23.00 -
×
 How I Make A Living Daytrading Stocks with David Floyd
1 × $4.00
How I Make A Living Daytrading Stocks with David Floyd
1 × $4.00 -
×
 TradeCraft: Your Path to Peak Performance Trading By Adam Grimes
1 × $15.00
TradeCraft: Your Path to Peak Performance Trading By Adam Grimes
1 × $15.00 -
×
 The Complete Guide to Multiple Time Frame Analysis & Reading Price Action with Aiman Almansoori
1 × $13.00
The Complete Guide to Multiple Time Frame Analysis & Reading Price Action with Aiman Almansoori
1 × $13.00 -
×
 Advanced Spread Trading with Guy Bower - MasterClass Trader
1 × $15.00
Advanced Spread Trading with Guy Bower - MasterClass Trader
1 × $15.00 -
×
 Forex Libra Code Software
1 × $31.00
Forex Libra Code Software
1 × $31.00 -
×
 Master The Art of Technical Analysis with Raul Gonzalez
1 × $31.00
Master The Art of Technical Analysis with Raul Gonzalez
1 × $31.00 -
×
 ICT Prodigy Trading Course – $650K in Payouts with Alex Solignani
1 × $15.00
ICT Prodigy Trading Course – $650K in Payouts with Alex Solignani
1 × $15.00 -
×
 High Probability Trading Using Elliott Wave And Fibonacci Analysis withVic Patel - Forex Training Group
1 × $10.00
High Probability Trading Using Elliott Wave And Fibonacci Analysis withVic Patel - Forex Training Group
1 × $10.00 -
×
 $20 – 52k 20 pips a day challange with Rafał Zuchowicz - TopMasterTrader
1 × $5.00
$20 – 52k 20 pips a day challange with Rafał Zuchowicz - TopMasterTrader
1 × $5.00 -
×
 Hawkeye Indicators for eSignal + Manual (janarps.com)
1 × $6.00
Hawkeye Indicators for eSignal + Manual (janarps.com)
1 × $6.00 -
×
 Schooloftrade - SOT Beginners Course (May 2014)
1 × $23.00
Schooloftrade - SOT Beginners Course (May 2014)
1 × $23.00 -
×
 Ultimate Trading Course with Dodgy's Dungeon
1 × $8.00
Ultimate Trading Course with Dodgy's Dungeon
1 × $8.00 -
×
 The Naked Eye: Raw Data Analytics with Edgar Torres - Raw Data Analytics
1 × $8.00
The Naked Eye: Raw Data Analytics with Edgar Torres - Raw Data Analytics
1 × $8.00 -
×
 SQX Mentorship with Tip Toe Hippo
1 × $23.00
SQX Mentorship with Tip Toe Hippo
1 × $23.00 -
×
 Master Market Movement – Elite Course with Refocus Trading
1 × $5.00
Master Market Movement – Elite Course with Refocus Trading
1 × $5.00 -
×
 Dan Sheridan Butterfly Course + Iron Condor Class Bundle Pack
1 × $23.00
Dan Sheridan Butterfly Course + Iron Condor Class Bundle Pack
1 × $23.00 -
×
 Deep Dive Butterfly Trading Strategy Class with SJG Trades
1 × $41.00
Deep Dive Butterfly Trading Strategy Class with SJG Trades
1 × $41.00 -
×
 AI For Traders with Trading Markets
1 × $31.00
AI For Traders with Trading Markets
1 × $31.00 -
×
 Level 2 Trading Warfare
1 × $6.00
Level 2 Trading Warfare
1 × $6.00 -
×
 How To Read The Market Professionally with TradeSmart
1 × $27.00
How To Read The Market Professionally with TradeSmart
1 × $27.00 -
×
 Trading Short TermSame Day Trades Sep 2023 with Dan Sheridan & Mark Fenton - Sheridan Options Mentoring
1 × $31.00
Trading Short TermSame Day Trades Sep 2023 with Dan Sheridan & Mark Fenton - Sheridan Options Mentoring
1 × $31.00 -
×
 Frank Paul – Fibonacci Swing Trader Foundation Course 2011 (Video, Manuals, 5.1 GB) with Forexmentor
1 × $6.00
Frank Paul – Fibonacci Swing Trader Foundation Course 2011 (Video, Manuals, 5.1 GB) with Forexmentor
1 × $6.00 -
×
 Module 4 Elliot Wave and Identify Wave Count
1 × $31.00
Module 4 Elliot Wave and Identify Wave Count
1 × $31.00 -
×
 Introduction To The STRAT Course with Rob Smith
1 × $8.00
Introduction To The STRAT Course with Rob Smith
1 × $8.00 -
×
 Trading Futures for Dummies with Joe Duarte
1 × $6.00
Trading Futures for Dummies with Joe Duarte
1 × $6.00 -
×
 How To Trade Fundamental News Release 2022 with Patrick Muke
1 × $6.00
How To Trade Fundamental News Release 2022 with Patrick Muke
1 × $6.00 -
×
 WondaFX Signature Strategy with WondaFX
1 × $5.00
WondaFX Signature Strategy with WondaFX
1 × $5.00 -
×
 Forex 800k Workshop with Spartan Trader
1 × $23.00
Forex 800k Workshop with Spartan Trader
1 × $23.00 -
×
 Hit The Mark Trading - Boot Camp 2016 Courses
1 × $23.00
Hit The Mark Trading - Boot Camp 2016 Courses
1 × $23.00 -
×
 The Indices Orderflow Masterclass with The Forex Scalpers
1 × $23.00
The Indices Orderflow Masterclass with The Forex Scalpers
1 × $23.00 -
×
 The Orderflows Trade Opportunities Encyclopedia with Michael Valtos
1 × $8.00
The Orderflows Trade Opportunities Encyclopedia with Michael Valtos
1 × $8.00 -
×
 Divergence Trading – Mastering Market Reversals
1 × $31.00
Divergence Trading – Mastering Market Reversals
1 × $31.00 -
×
 Options University - FX Options Trading Course 2008
1 × $6.00
Options University - FX Options Trading Course 2008
1 × $6.00 -
×
 The 2021 TraderLion Stock Trading Conference with Trader Lion
1 × $5.00
The 2021 TraderLion Stock Trading Conference with Trader Lion
1 × $5.00 -
×
 How I Trade Major First-Hour Reversals For Rapid Gains with Kevin Haggerty
1 × $6.00
How I Trade Major First-Hour Reversals For Rapid Gains with Kevin Haggerty
1 × $6.00 -
×
 Strategies of a Winning Trader 2023 with Gareth Soloway
1 × $209.00
Strategies of a Winning Trader 2023 with Gareth Soloway
1 × $209.00 -
×
 Cobra (aka Viper Crude)
1 × $23.00
Cobra (aka Viper Crude)
1 × $23.00 -
×
 Redler Ultimate Access
1 × $54.00
Redler Ultimate Access
1 × $54.00 -
×
 Fundamental Analysis with CA Rachana Ranade
1 × $5.00
Fundamental Analysis with CA Rachana Ranade
1 × $5.00 -
×
 WinXgo + Manual (moneytide.com)
1 × $6.00
WinXgo + Manual (moneytide.com)
1 × $6.00 -
×
 Intermarket Technical Analysis with John J.Murphy
1 × $6.00
Intermarket Technical Analysis with John J.Murphy
1 × $6.00 -
×
 The Bollinger Bands Swing Trading System 2004 with Larry Connors
1 × $6.00
The Bollinger Bands Swing Trading System 2004 with Larry Connors
1 × $6.00 -
×
 Footprint Deep Dive
1 × $15.00
Footprint Deep Dive
1 × $15.00 -
×
 Forex Essentials in 15 Trades with John Bland, Jay Meisler & Michael Archer
1 × $6.00
Forex Essentials in 15 Trades with John Bland, Jay Meisler & Michael Archer
1 × $6.00 -
×
 Bond Market Course with The Macro Compass
1 × $15.00
Bond Market Course with The Macro Compass
1 × $15.00 -
×
 Forex Powerband Dominator
1 × $6.00
Forex Powerband Dominator
1 × $6.00 -
×
 Option Screening. Finding Profitable Trades with Lawrence Gavanagh
1 × $6.00
Option Screening. Finding Profitable Trades with Lawrence Gavanagh
1 × $6.00 -
×
 Crypto Trading Academy with Cheeky Investor - Aussie Day Trader
1 × $13.00
Crypto Trading Academy with Cheeky Investor - Aussie Day Trader
1 × $13.00 -
×
 Learn Before you Loose
1 × $6.00
Learn Before you Loose
1 × $6.00 -
×
 Takeover Talk The Q.U.I.C.K. Strategy to High Return, Low Risk Investing with Lou Bass
1 × $6.00
Takeover Talk The Q.U.I.C.K. Strategy to High Return, Low Risk Investing with Lou Bass
1 × $6.00 -
×
 Butterfly and Condor Workshop with Aeromir
1 × $15.00
Butterfly and Condor Workshop with Aeromir
1 × $15.00 -
×
 Foundation Options - Time Decay, Implied Volatility, Greeks
1 × $6.00
Foundation Options - Time Decay, Implied Volatility, Greeks
1 × $6.00 -
×
 Cycle Trends Professional 2.3 Rear Time with Esignal cycletrends.co.za
1 × $6.00
Cycle Trends Professional 2.3 Rear Time with Esignal cycletrends.co.za
1 × $6.00 -
×
 Options Trading Course with Consistent Options Income
1 × $5.00
Options Trading Course with Consistent Options Income
1 × $5.00 -
×
 The Orderflow Masterclass with PrimeTrading
1 × $17.00
The Orderflow Masterclass with PrimeTrading
1 × $17.00 -
×
 AnswerStock with Timothy Sykes
1 × $5.00
AnswerStock with Timothy Sykes
1 × $5.00 -
×
 Mastering The Markets
1 × $4.00
Mastering The Markets
1 × $4.00 -
×
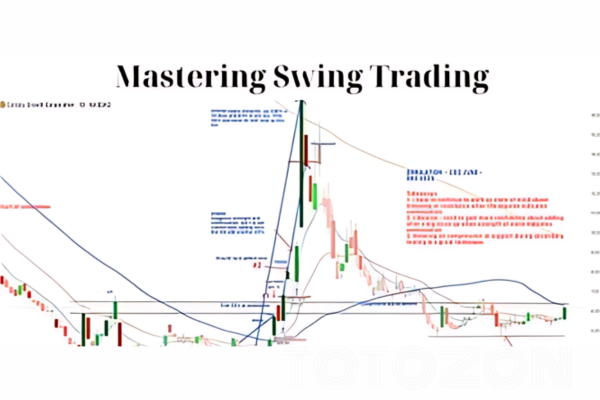 MASTERING SWING TRADING May 2024 with Roman Bogomazov
1 × $194.00
MASTERING SWING TRADING May 2024 with Roman Bogomazov
1 × $194.00 -
×
 Complete Stockmarket Trading and Forecasting Course
1 × $6.00
Complete Stockmarket Trading and Forecasting Course
1 × $6.00 -
×
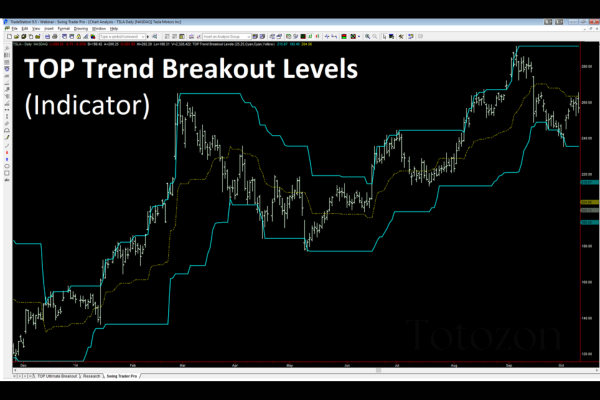 TopTradeTools - Trend Breakout Levels
1 × $15.00
TopTradeTools - Trend Breakout Levels
1 × $15.00 -
×
 DApp Mastermind (Crypto DApps) – Passive Income with DApps and SMART Contracts with Jason BTO
1 × $6.00
DApp Mastermind (Crypto DApps) – Passive Income with DApps and SMART Contracts with Jason BTO
1 × $6.00 -
×
 The Trading Blueprint with Brad Goh - The Trading Geek
1 × $5.00
The Trading Blueprint with Brad Goh - The Trading Geek
1 × $5.00 -
×
 Rapid Results Method with Russ Horn
1 × $6.00
Rapid Results Method with Russ Horn
1 × $6.00 -
×
 NYC REPLAYS 2018
1 × $6.00
NYC REPLAYS 2018
1 × $6.00 -
×
 Trading Psychology with Barry Burns
1 × $4.00
Trading Psychology with Barry Burns
1 × $4.00 -
×
 Netpicks - The Ultimate Trading Machine Complete Set of Courses, TS Indicators & Daily Updates
1 × $6.00
Netpicks - The Ultimate Trading Machine Complete Set of Courses, TS Indicators & Daily Updates
1 × $6.00 -
×
 Lit Trading Course
1 × $15.00
Lit Trading Course
1 × $15.00 -
×
 FX GOAT FOREX TRADING ACADEMY
1 × $8.00
FX GOAT FOREX TRADING ACADEMY
1 × $8.00 -
×
 Bear Market Strategies eLearning Course - Kirk - Van Tharp Institute
1 × $85.00
Bear Market Strategies eLearning Course - Kirk - Van Tharp Institute
1 × $85.00 -
×
 Winning with Options with Michael Thomsett
1 × $6.00
Winning with Options with Michael Thomsett
1 × $6.00 -
×
 Video Course with Trading Template
1 × $54.00
Video Course with Trading Template
1 × $54.00 -
×
 Donchian’s 20 Guides to Trading Commodities with Barbara S.Dixon
1 × $4.00
Donchian’s 20 Guides to Trading Commodities with Barbara S.Dixon
1 × $4.00 -
×
 Option Trader Magazine (optionstradermag.com) with Magazine
1 × $6.00
Option Trader Magazine (optionstradermag.com) with Magazine
1 × $6.00 -
×
 Rate of Change Indicator with Alphashark
1 × $31.00
Rate of Change Indicator with Alphashark
1 × $31.00 -
×
 Insider Signal Exclusive Forex Course with Andy X
1 × $7.00
Insider Signal Exclusive Forex Course with Andy X
1 × $7.00 -
×
 6 Dynamic Trader Real Time and End Of Day
1 × $39.00
6 Dynamic Trader Real Time and End Of Day
1 × $39.00 -
×
 FX Accelerator 2
1 × $31.00
FX Accelerator 2
1 × $31.00 -
×
 Mindful Trading e-Workbook with Traders State Of Mind
1 × $6.00
Mindful Trading e-Workbook with Traders State Of Mind
1 × $6.00 -
×
 Strategy Factory Workshop
1 × $23.00
Strategy Factory Workshop
1 × $23.00 -
×
 Trend Forecasting with Technical Analysis with Louis Mendelsohn & John Murphy
1 × $6.00
Trend Forecasting with Technical Analysis with Louis Mendelsohn & John Murphy
1 × $6.00

Stock Traders Almanac 2008 with Jeffrey Hirsch & Yale Hirsch
$6.00
File Size: Coming soon!
Delivery Time: 1–12 hours
Media Type: Online Course
Stock Traders Almanac 2008 with Jeffrey Hirsch & Yale Hirsch
Introduction
Navigating the complexities of the stock market requires reliable resources and insightful analysis. The “Stock Traders Almanac 2008” by Jeffrey Hirsch and Yale Hirsch offers precisely that, providing traders with a wealth of historical data, market strategies, and valuable insights. This article explores the key features of the 2008 edition and how it can enhance your trading strategy.
The Legacy of the Stock Traders Almanac
The Origins of the Almanac
The Stock Traders Almanac was first published by Yale Hirsch in 1967, quickly becoming a go-to resource for market analysis and historical trends.
Evolution Over Time
Jeffrey Hirsch, continuing his father’s legacy, has ensured that each edition remains relevant by incorporating contemporary market strategies and data.
The Significance of the 2008 Edition
The 2008 edition is particularly noteworthy for its insights into the pre-financial crisis market, offering lessons that remain valuable today.
Key Features of the 2008 Almanac
Historical Market Data
- Monthly and Daily Data: Comprehensive historical data for each month and day, helping traders identify recurring patterns.
- Seasonal Trends: Analysis of seasonal patterns and their impact on market performance.
Market Analysis
- Technical Indicators: Essential tools for technical analysis, including moving averages and the Relative Strength Index (RSI).
- Fundamental Analysis: Insights into economic indicators and their influence on market trends.
Trading Strategies
- Best Six Months Strategy: Focuses on the most profitable months of the year for stock trading.
- Santa Claus Rally: Examination of the year-end rally phenomenon.
The Best Six Months Strategy
Understanding the Strategy
The Best Six Months Strategy suggests that the stock market performs best from November to April, based on historical performance data.
Historical Performance
Historical data shows that these six months generally yield higher returns compared to the rest of the year.
Implementing the Strategy
- Buy in November: Enter the market in November.
- Sell in April: Exit positions in April to avoid the traditionally weaker months.
The Santa Claus Rally
What is the Santa Claus Rally?
The Santa Claus Rally refers to the tendency for the stock market to rise in the last week of December and the first two trading days of January.
Historical Analysis
Historical data supports the existence of this rally, with positive returns in most years.
How to Capitalize on the Rally
- Timing: Enter the market in late December.
- Exit: Consider exiting positions after the first two trading days of January.
Utilizing Technical Indicators
Moving Averages
- Simple Moving Average (SMA): Averages the closing prices over a specified period.
- Exponential Moving Average (EMA): Gives more weight to recent prices for a more responsive indicator.
Relative Strength Index (RSI)
- Overbought/Oversold Conditions: Identifies potential reversal points by measuring the speed and change of price movements.
MACD (Moving Average Convergence Divergence)
- Trend Following: Indicates bullish or bearish trends by comparing short-term and long-term moving averages.
Fundamental Analysis Insights
Economic Indicators
- GDP Growth: A key indicator of economic health.
- Unemployment Rate: Impacts consumer spending and economic stability.
Corporate Earnings
- Earnings Reports: Quarterly earnings reports provide insights into a company’s financial health.
- Earnings Per Share (EPS): Measures a company’s profitability on a per-share basis.
Seasonal Patterns and Trends
January Effect
The January Effect refers to the tendency for small-cap stocks to outperform in January.
Sell in May and Go Away
This adage suggests that the market tends to underperform from May to October.
Holiday Effect
The market often experiences positive returns on trading days preceding a holiday.
Risk Management Strategies
Stop-Loss Orders
Implementing stop-loss orders can help limit potential losses by automatically selling a security when it reaches a predetermined price.
Diversification
Diversify your portfolio to spread risk across various asset classes and sectors.
Hedging
Use options and other derivative instruments to hedge against potential market downturns.
Behavioral Finance
What is Behavioral Finance?
Behavioral finance examines how psychological factors affect market outcomes and investment decisions.
Common Behavioral Biases
- Overconfidence
- Herding
- Loss Aversion
Understanding Financial News
Importance of Financial News
Staying informed about financial news helps you make timely and informed investment decisions.
Reliable Sources of Financial News
- Financial Times
- Wall Street Journal
- Bloomberg
Building a Strong Portfolio
Components of a Strong Portfolio
A well-balanced portfolio includes a mix of stocks, bonds, and other asset classes.
Portfolio Rebalancing
Regularly review and adjust your portfolio to maintain your desired asset allocation.
Evaluating Portfolio Performance
Measure your portfolio’s performance against relevant benchmarks to ensure it meets your financial goals.
Conclusion
The “Stock Traders Almanac 2008” by Jeffrey Hirsch and Yale Hirsch remains an essential tool for traders and investors looking to make informed decisions. By leveraging historical data, market analysis, and strategic insights, you can enhance your trading performance and achieve your financial goals. Stay ahead of the market trends, and let the Almanac guide you through the complexities of stock trading.
FAQs
What is the main focus of the “Stock Traders Almanac 2008”?
The main focus is on providing historical market data, seasonal trends, and strategic insights to aid traders and investors in making informed decisions.
How can the Best Six Months Strategy benefit traders?
The Best Six Months Strategy can help traders capitalize on the historically strong performance of the market from November to April.
What is the Santa Claus Rally?
The Santa Claus Rally refers to the tendency for the stock market to rise during the last week of December and the first two trading days of January.
How important are technical indicators in trading?
Technical indicators are crucial for analyzing market trends, identifying potential entry and exit points, and making informed trading decisions.
Why is risk management important in trading?
Risk management is essential to protect your investment capital and minimize potential losses in the volatile stock market.
Be the first to review “Stock Traders Almanac 2008 with Jeffrey Hirsch & Yale Hirsch”
You must be logged in to post a review.
Related products
Original price was: $799.00.$15.00Current price is: $15.00.
Forex Trading
Original price was: $550.00.$5.00Current price is: $5.00.
Forex Trading
Original price was: $2,000.00.$23.00Current price is: $23.00.
Original price was: $4,995.00.$15.00Current price is: $15.00.
Forex Trading
Original price was: $249.00.$15.00Current price is: $15.00.
Forex Trading
Original price was: $1,098.00.$39.00Current price is: $39.00.
Original price was: $197.00.$5.00Current price is: $5.00.
Forex Trading
Original price was: $499.00.$15.00Current price is: $15.00.
Forex Trading
Original price was: $799.00.$15.00Current price is: $15.00.
Original price was: $1,800.00.$54.00Current price is: $54.00.
Original price was: $497.00.$31.00Current price is: $31.00.
Original price was: $497.00.$11.00Current price is: $11.00.
Forex Trading
Original price was: $239.00.$8.00Current price is: $8.00.
Forex Trading
Quantamentals – The Next Great Forefront Of Trading and Investing with Trading Markets
Original price was: $1,495.00.$8.00Current price is: $8.00.
Original price was: $997.00.$8.00Current price is: $8.00.
Forex Trading
Original price was: $1,898.00.$10.00Current price is: $10.00.
Original price was: $695.00.$41.00Current price is: $41.00.
Forex Trading
Original price was: $999.00.$15.00Current price is: $15.00.
Original price was: $1,849.00.$15.00Current price is: $15.00.
Original price was: $649.00.$20.00Current price is: $20.00.
Reviews
There are no reviews yet.