-
×
 Dynamic Time Cycles with Peter Eliades
1 × $6.00
Dynamic Time Cycles with Peter Eliades
1 × $6.00 -
×
 Futures Trading (German)
1 × $6.00
Futures Trading (German)
1 × $6.00 -
×
 ABC Waves TOS Indicator & Live Class with Simpler Options
1 × $6.00
ABC Waves TOS Indicator & Live Class with Simpler Options
1 × $6.00 -
×
 Crypto Trading Academy with Cheeky Investor - Aussie Day Trader
1 × $13.00
Crypto Trading Academy with Cheeky Investor - Aussie Day Trader
1 × $13.00 -
×
 Planetary Harmonics of Speculative Markets with Larry Pesavento
1 × $6.00
Planetary Harmonics of Speculative Markets with Larry Pesavento
1 × $6.00 -
×
 Gann’s Scientific Methods Unveiled (Vol I, II)
1 × $6.00
Gann’s Scientific Methods Unveiled (Vol I, II)
1 × $6.00 -
×
 The MMXM Traders Course - The MMXM Trader
1 × $5.00
The MMXM Traders Course - The MMXM Trader
1 × $5.00 -
×
 Trading Hub 4.0 with Mr. Khan
1 × $27.00
Trading Hub 4.0 with Mr. Khan
1 × $27.00 -
×
 Futures Spread Trading Intro Course with Thetradingframework
1 × $6.00
Futures Spread Trading Intro Course with Thetradingframework
1 × $6.00 -
×
 Swing Trading Futures & Commodities with the COT
1 × $93.00
Swing Trading Futures & Commodities with the COT
1 × $93.00 -
×
 SOT Advanced Course (May 2014)
1 × $23.00
SOT Advanced Course (May 2014)
1 × $23.00 -
×
 Sell Premium & Minimize Risk Class with Don Kaufman
1 × $6.00
Sell Premium & Minimize Risk Class with Don Kaufman
1 × $6.00 -
×
 Pablo Order Flow Education with Pablo
1 × $6.00
Pablo Order Flow Education with Pablo
1 × $6.00 -
×
 Pattern Picking with Charles Drummond
1 × $6.00
Pattern Picking with Charles Drummond
1 × $6.00 -
×
 Fierce 10 On Demand Coaching Program with High Performance Trading
1 × $5.00
Fierce 10 On Demand Coaching Program with High Performance Trading
1 × $5.00 -
×
 Picking the Best Stocks & Strategies for every Option Trade with James Bittman
1 × $6.00
Picking the Best Stocks & Strategies for every Option Trade with James Bittman
1 × $6.00 -
×
 High Powered Investing with Amine Bouchentouf
1 × $6.00
High Powered Investing with Amine Bouchentouf
1 × $6.00 -
×
 Starting Out in Futures Trading with Mark Powers
1 × $6.00
Starting Out in Futures Trading with Mark Powers
1 × $6.00 -
×
 Investing with Exchange Traded Funds Made Easy with Marvin Appel
1 × $6.00
Investing with Exchange Traded Funds Made Easy with Marvin Appel
1 × $6.00 -
×
 Fed Balance Sheet 201 with Joseph Wang - Central Banking 101
1 × $10.00
Fed Balance Sheet 201 with Joseph Wang - Central Banking 101
1 × $10.00 -
×
 The Crash of 1997 (Article) with Hans Hannula
1 × $6.00
The Crash of 1997 (Article) with Hans Hannula
1 × $6.00 -
×
 Essential Stock Picking Strategies with Daniel Strachman
1 × $6.00
Essential Stock Picking Strategies with Daniel Strachman
1 × $6.00 -
×
 Letal Forex System with Alex Seeni
1 × $6.00
Letal Forex System with Alex Seeni
1 × $6.00 -
×
 Profiletraders - MARKET PROFILE TACTICAL STRATEGIES FOR DAY TRADING
1 × $23.00
Profiletraders - MARKET PROFILE TACTICAL STRATEGIES FOR DAY TRADING
1 × $23.00 -
×
 The 4 Horsemen CD with David Elliott
1 × $6.00
The 4 Horsemen CD with David Elliott
1 × $6.00 -
×
 Scalp Strategy and Flipping Small Accounts with Opes Trading Group
1 × $5.00
Scalp Strategy and Flipping Small Accounts with Opes Trading Group
1 × $5.00 -
×
 Pre-Previews. 23 Articles and Forecasts
1 × $6.00
Pre-Previews. 23 Articles and Forecasts
1 × $6.00 -
×
 The 10%ers with Trader Mike
1 × $5.00
The 10%ers with Trader Mike
1 × $5.00 -
×
 Investing Guide For New Investor with Alfred Scillitani
1 × $6.00
Investing Guide For New Investor with Alfred Scillitani
1 × $6.00 -
×
 Stock Trading Simplified - 3 DVD + PDF Workbook with John Person
1 × $6.00
Stock Trading Simplified - 3 DVD + PDF Workbook with John Person
1 × $6.00 -
×
 The Bare Essentials Of Investing: Teaching The Horse To Talk with Harold Bierman
1 × $6.00
The Bare Essentials Of Investing: Teaching The Horse To Talk with Harold Bierman
1 × $6.00 -
×
 Forex Power Strategy Course with Jason Steele
1 × $6.00
Forex Power Strategy Course with Jason Steele
1 × $6.00 -
×
 How To Create Your Own Trading Strategy with Simon Klein - Trade Smart
1 × $5.00
How To Create Your Own Trading Strategy with Simon Klein - Trade Smart
1 × $5.00 -
×
 Fundamentals of Futures & Options Markets (4th Ed.)
1 × $6.00
Fundamentals of Futures & Options Markets (4th Ed.)
1 × $6.00 -
×
 Trading For A Living Course with Yvan Byeajee - Trading Composure
1 × $6.00
Trading For A Living Course with Yvan Byeajee - Trading Composure
1 × $6.00 -
×
 DaVinci FX Course
1 × $6.00
DaVinci FX Course
1 × $6.00 -
×
 Trading For Busy People with Josias Kere
1 × $6.00
Trading For Busy People with Josias Kere
1 × $6.00 -
×
 Divorcing the Dow: Using Revolutionary Market Indicators to Profit from the Stealth Boom Ahead - Jim Troup & Sharon Michalsky
1 × $6.00
Divorcing the Dow: Using Revolutionary Market Indicators to Profit from the Stealth Boom Ahead - Jim Troup & Sharon Michalsky
1 × $6.00 -
×
 AstroScan Regulus 4.1E newastro.net
1 × $6.00
AstroScan Regulus 4.1E newastro.net
1 × $6.00 -
×
 Quantitative Trading: How to Build Your Own Algorithmic Trading Business (1st Edition) with Ernest Chan
1 × $6.00
Quantitative Trading: How to Build Your Own Algorithmic Trading Business (1st Edition) with Ernest Chan
1 × $6.00 -
×
 Trading Full Circle the Complete Underground Trader System for Timing with Jea Yu
1 × $6.00
Trading Full Circle the Complete Underground Trader System for Timing with Jea Yu
1 × $6.00 -
×
 Mutual Funds: Fifty Years of Research Findings by Seth C. Anderson
1 × $6.00
Mutual Funds: Fifty Years of Research Findings by Seth C. Anderson
1 × $6.00 -
×
 EFT – The Art of Delivery with Gary Craig
1 × $5.00
EFT – The Art of Delivery with Gary Craig
1 × $5.00 -
×
 Trading Economic Data System with CopperChips
1 × $6.00
Trading Economic Data System with CopperChips
1 × $6.00 -
×
 W. D Gann 's Square Of 9 Applied To Modern Markets with Sean Avidar - Hexatrade350
1 × $23.00
W. D Gann 's Square Of 9 Applied To Modern Markets with Sean Avidar - Hexatrade350
1 × $23.00 -
×
 Million Dollar Stock Market Idea with Larry Williams
1 × $6.00
Million Dollar Stock Market Idea with Larry Williams
1 × $6.00 -
×
 Systems Mastery Course with Chris Dover - Pollinate Trading
1 × $5.00
Systems Mastery Course with Chris Dover - Pollinate Trading
1 × $5.00 -
×
 Volatile Markets Made Easy: Trading Stocks and Options for Increased Profits with Guy Cohen
1 × $6.00
Volatile Markets Made Easy: Trading Stocks and Options for Increased Profits with Guy Cohen
1 × $6.00 -
×
 How to Trade Forex & Cryptocurrency with Bitraged
1 × $5.00
How to Trade Forex & Cryptocurrency with Bitraged
1 × $5.00 -
×
 Cheatcode Trend System with Dominique Woodson
1 × $15.00
Cheatcode Trend System with Dominique Woodson
1 × $15.00 -
×
 Option Insanity Strategy with PDS Trader
1 × $69.00
Option Insanity Strategy with PDS Trader
1 × $69.00 -
×
 Master Class Recording 2019 with Oil Trading Academy
1 × $17.00
Master Class Recording 2019 with Oil Trading Academy
1 × $17.00 -
×
 Profiletraders - Market Profile Day Trading
1 × $15.00
Profiletraders - Market Profile Day Trading
1 × $15.00 -
×
 Get Rich with Dividends
1 × $6.00
Get Rich with Dividends
1 × $6.00 -
×
 Euro Fractal Trading System with Cynthia Marcy, Erol Bortucene
1 × $6.00
Euro Fractal Trading System with Cynthia Marcy, Erol Bortucene
1 × $6.00 -
×
 3 Volatility Strategies with Quantified Strategies
1 × $23.00
3 Volatility Strategies with Quantified Strategies
1 × $23.00 -
×
 Evolve MasterClass with Irek Piekarski
1 × $13.00
Evolve MasterClass with Irek Piekarski
1 × $13.00 -
×
 Trading for a Bright Future with Martin Cole
1 × $6.00
Trading for a Bright Future with Martin Cole
1 × $6.00 -
×
 Pattern Recognition: A Fundamental Introduction to Japanese Candlestick Charting Techniques Class with Jeff Bierman
1 × $6.00
Pattern Recognition: A Fundamental Introduction to Japanese Candlestick Charting Techniques Class with Jeff Bierman
1 × $6.00 -
×
 Option Greeks Class with Don Kaufman
1 × $6.00
Option Greeks Class with Don Kaufman
1 × $6.00 -
×
 Sovereign Man Confidential
1 × $6.00
Sovereign Man Confidential
1 × $6.00 -
×
 ETFs for the Long Run: What They Are, How They Work, and Simple Strategies for Successful Long-Term Investing - Lawrence Carrel
1 × $6.00
ETFs for the Long Run: What They Are, How They Work, and Simple Strategies for Successful Long-Term Investing - Lawrence Carrel
1 × $6.00 -
×
 Gap Trading for Stock and Options Traders with Damon Verial
1 × $6.00
Gap Trading for Stock and Options Traders with Damon Verial
1 × $6.00 -
×
 Building Your E-Mini Trading Strategy with Daniel Gramza
1 × $6.00
Building Your E-Mini Trading Strategy with Daniel Gramza
1 × $6.00 -
×
 Geometric Angles Applied To Modern Markets with Sean Avidar
1 × $39.00
Geometric Angles Applied To Modern Markets with Sean Avidar
1 × $39.00 -
×
 Lazy Emini Trader Master Class Course - David Frost
1 × $10.00
Lazy Emini Trader Master Class Course - David Frost
1 × $10.00 -
×
 Smart Money Trading Course with Prosperity Academy
1 × $5.00
Smart Money Trading Course with Prosperity Academy
1 × $5.00 -
×
 Trading the Post with Ron Friedman
1 × $5.00
Trading the Post with Ron Friedman
1 × $5.00 -
×
 PFAZoneSuite [Trading Indicator] 2017
1 × $109.00
PFAZoneSuite [Trading Indicator] 2017
1 × $109.00 -
×
 7 Day FX Mastery Course with Market Masters
1 × $6.00
7 Day FX Mastery Course with Market Masters
1 × $6.00 -
×
 Forecast, Filings, & News with Jtrader
1 × $6.00
Forecast, Filings, & News with Jtrader
1 × $6.00 -
×
 TradeWithChris - TWC Forex Trading Course
1 × $6.00
TradeWithChris - TWC Forex Trading Course
1 × $6.00 -
×
 Secret Day - Swing Trading Strategy For Stock, Forex, Crypto with Value Stocks
1 × $5.00
Secret Day - Swing Trading Strategy For Stock, Forex, Crypto with Value Stocks
1 × $5.00 -
×
 Super Structure Trading Home Study Course
1 × $23.00
Super Structure Trading Home Study Course
1 × $23.00 -
×
 Inefficient Markets with Andrei Shleifer
1 × $6.00
Inefficient Markets with Andrei Shleifer
1 × $6.00 -
×
 Strategy Factory Workshop with Kevin Davey - KJ Trading Systems
1 × $5.00
Strategy Factory Workshop with Kevin Davey - KJ Trading Systems
1 × $5.00 -
×
 Essentials Course & Day Trading Strategies with Bear Bull Traders
1 × $13.00
Essentials Course & Day Trading Strategies with Bear Bull Traders
1 × $13.00 -
×
 Home Run Options Trading Course with Dave Aquino - Base Camp Trading
1 × $11.00
Home Run Options Trading Course with Dave Aquino - Base Camp Trading
1 × $11.00 -
×
 The Trading Blueprint with Brad Goh - The Trading Geek
1 × $5.00
The Trading Blueprint with Brad Goh - The Trading Geek
1 × $5.00 -
×
 AI For Traders with Trading Markets
1 × $31.00
AI For Traders with Trading Markets
1 × $31.00 -
×
 $20 – 52k 20 pips a day challange with Rafał Zuchowicz - TopMasterTrader
1 × $5.00
$20 – 52k 20 pips a day challange with Rafał Zuchowicz - TopMasterTrader
1 × $5.00 -
×
 Boomer Quick Profits Day Trading Course
1 × $23.00
Boomer Quick Profits Day Trading Course
1 × $23.00 -
×
 SQX Mentorship with Tip Toe Hippo
1 × $23.00
SQX Mentorship with Tip Toe Hippo
1 × $23.00 -
×
 Matrix Spread Options Trading Course with Base Camp Trading
1 × $31.00
Matrix Spread Options Trading Course with Base Camp Trading
1 × $31.00 -
×
 TradeCraft: Your Path to Peak Performance Trading By Adam Grimes
1 × $15.00
TradeCraft: Your Path to Peak Performance Trading By Adam Grimes
1 × $15.00 -
×
 The A14 Weekly Option Strategy Workshop with Amy Meissner
1 × $23.00
The A14 Weekly Option Strategy Workshop with Amy Meissner
1 × $23.00 -
×
 The Orderflow Masterclass with PrimeTrading
1 × $17.00
The Orderflow Masterclass with PrimeTrading
1 × $17.00 -
×
 Bond Market Course with The Macro Compass
1 × $15.00
Bond Market Course with The Macro Compass
1 × $15.00 -
×
 Algo Trading Masterclass with Ali Casey - StatOasis
1 × $23.00
Algo Trading Masterclass with Ali Casey - StatOasis
1 × $23.00 -
×
 White Phoenix’s The Smart (Money) Approach to Trading with Jayson Casper
1 × $39.00
White Phoenix’s The Smart (Money) Approach to Trading with Jayson Casper
1 × $39.00 -
×
 The Complete Guide to Multiple Time Frame Analysis & Reading Price Action with Aiman Almansoori
1 × $13.00
The Complete Guide to Multiple Time Frame Analysis & Reading Price Action with Aiman Almansoori
1 × $13.00 -
×
 TRADING NFX Course with Andrew NFX
1 × $5.00
TRADING NFX Course with Andrew NFX
1 × $5.00 -
×
 Best of the Best: Collars with Amy Meissner & Scott Ruble
1 × $15.00
Best of the Best: Collars with Amy Meissner & Scott Ruble
1 × $15.00 -
×
 How To Read The Market Professionally with TradeSmart
1 × $27.00
How To Read The Market Professionally with TradeSmart
1 × $27.00 -
×
 High Probability Trading Using Elliott Wave And Fibonacci Analysis withVic Patel - Forex Training Group
1 × $10.00
High Probability Trading Using Elliott Wave And Fibonacci Analysis withVic Patel - Forex Training Group
1 × $10.00 -
×
 Trading Non-Farm Payroll Report
1 × $6.00
Trading Non-Farm Payroll Report
1 × $6.00 -
×
 Compass Trading System with Right Line Trading
1 × $39.00
Compass Trading System with Right Line Trading
1 × $39.00 -
×
 Butterfly and Condor Workshop with Aeromir
1 × $15.00
Butterfly and Condor Workshop with Aeromir
1 × $15.00 -
×
 Crystal Ball Pack PLUS bonus Live Trade By Pat Mitchell - Trick Trades
1 × $20.00
Crystal Ball Pack PLUS bonus Live Trade By Pat Mitchell - Trick Trades
1 × $20.00 -
×
 0 DTE Options Trading Workshop with Aeromir Corporation
1 × $15.00
0 DTE Options Trading Workshop with Aeromir Corporation
1 × $15.00 -
×
 WondaFX Signature Strategy with WondaFX
1 × $5.00
WondaFX Signature Strategy with WondaFX
1 × $5.00 -
×
 The Indices Orderflow Masterclass with The Forex Scalpers
1 × $23.00
The Indices Orderflow Masterclass with The Forex Scalpers
1 × $23.00 -
×
 Master The Art of Technical Analysis with Raul Gonzalez
1 × $31.00
Master The Art of Technical Analysis with Raul Gonzalez
1 × $31.00 -
×
 Advanced Spread Trading with Guy Bower - MasterClass Trader
1 × $15.00
Advanced Spread Trading with Guy Bower - MasterClass Trader
1 × $15.00 -
×
 The Orderflows Trade Opportunities Encyclopedia with Michael Valtos
1 × $8.00
The Orderflows Trade Opportunities Encyclopedia with Michael Valtos
1 × $8.00 -
×
 Essentials in Quantitative Trading QT01 By HangukQuant's
1 × $23.00
Essentials in Quantitative Trading QT01 By HangukQuant's
1 × $23.00 -
×
 ICT Prodigy Trading Course – $650K in Payouts with Alex Solignani
1 × $15.00
ICT Prodigy Trading Course – $650K in Payouts with Alex Solignani
1 × $15.00 -
×
 Quantamentals - The Next Great Forefront Of Trading and Investing with Trading Markets
1 × $8.00
Quantamentals - The Next Great Forefront Of Trading and Investing with Trading Markets
1 × $8.00 -
×
 The Prop Trading Code with Brannigan Barrett - Axia Futures
1 × $23.00
The Prop Trading Code with Brannigan Barrett - Axia Futures
1 × $23.00

Simple Methods for Detecting Buying and Selling Points in Securities with James Liveright
$6.00
File Size: Coming soon!
Delivery Time: 1–12 hours
Media Type: Online Course
Simple Methods for Detecting Buying and Selling Points in Securities with James Liveright
Investing in securities can be a daunting task. Knowing when to buy and when to sell is critical to maximizing returns and minimizing losses. In this article, we will delve into the wisdom shared by James Liveright, a renowned expert in the field, on simple methods for detecting buying and selling points in securities. Let’s explore these strategies that can help you make informed decisions in the volatile world of securities trading.
Understanding Market Trends
What Are Market Trends?
Market trends are the general direction in which the market is moving. Understanding these trends is crucial for detecting optimal buying and selling points.
Types of Market Trends
- Uptrends: When the market consistently moves upward.
- Downtrends: When the market consistently moves downward.
- Sideways Trends: When the market shows no clear upward or downward direction.
Technical Analysis Basics
What is Technical Analysis?
Technical analysis involves evaluating securities by analyzing statistics generated by market activity, such as past prices and volume.
Key Indicators in Technical Analysis
- Moving Averages: Helps smooth out price action to identify the direction of the trend.
- Relative Strength Index (RSI): Measures the speed and change of price movements.
- Bollinger Bands: Provides a range within which a security typically trades.
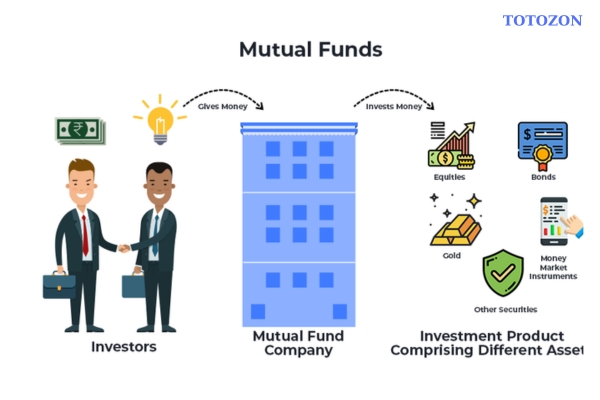
Fundamental Analysis
Understanding Fundamental Analysis
Fundamental analysis involves evaluating a security by attempting to measure its intrinsic value. This is done by examining related economic, financial, and other qualitative and quantitative factors.
Key Components of Fundamental Analysis
- Earnings Reports: Company earnings are a critical factor.
- Revenue Growth: A strong indicator of a company’s potential.
- Profit Margins: Higher margins often indicate a good investment.
Sentiment Analysis
What is Sentiment Analysis?
Sentiment analysis is the process of using natural language processing, text analysis, and computational linguistics to identify and extract subjective information from source materials.
How to Use Sentiment Analysis in Trading
- News and Social Media: Analyzing news articles and social media posts to gauge market sentiment.
- Analyst Ratings: Considering the opinions of industry experts.
Using Moving Averages
Simple Moving Average (SMA)
The SMA is calculated by adding the closing prices of a security for a period and then dividing this total by the number of days in that period.
Exponential Moving Average (EMA)
The EMA gives more weight to the most recent prices, making it more responsive to new information.
Identifying Support and Resistance Levels
Support Levels
Support levels are price points where a security tends to stop falling due to a concentration of demand.
Resistance Levels
Resistance levels are price points where a security tends to stop rising due to a concentration of supply.
Using the Relative Strength Index (RSI)
Understanding RSI
The RSI is a momentum oscillator that measures the speed and change of price movements on a scale of 0 to 100.
Using RSI to Detect Buying and Selling Points
- Overbought Conditions: When RSI is above 70, indicating a potential sell point.
- Oversold Conditions: When RSI is below 30, indicating a potential buy point.
Bollinger Bands Strategy
What are Bollinger Bands?
Bollinger Bands consist of a middle band (SMA) and two outer bands that are standard deviations away from the middle band.
Using Bollinger Bands to Detect Points
- Bouncing off the Bands: When prices touch the lower band, it’s a buy signal; when they touch the upper band, it’s a sell signal.
MACD Indicator
What is MACD?
The Moving Average Convergence Divergence (MACD) is a trend-following momentum indicator that shows the relationship between two moving averages of a security’s price.
Using MACD for Signals
- MACD Line Crosses Signal Line: When the MACD line crosses above the signal line, it’s a buy signal; when it crosses below, it’s a sell signal.
Candlestick Patterns
Understanding Candlestick Charts
Candlestick charts are used to describe price movements of securities, derivatives, and currencies.
Key Candlestick Patterns
- Doji: Indicates indecision in the market.
- Hammer: A bullish reversal pattern.
- Shooting Star: A bearish reversal pattern.
Volume Analysis
Importance of Volume in Trading
Volume refers to the number of shares or contracts traded in a security or market.
Using Volume to Confirm Trends
- Increasing Volume: Confirms the trend.
- Decreasing Volume: Indicates a potential reversal.
Combining Multiple Indicators
The Power of Confluence
Combining multiple indicators can provide more reliable signals. For example, using RSI with Bollinger Bands and moving averages can increase the accuracy of detecting buying and selling points.
The Psychological Aspect of Trading
Controlling Emotions
Trading can be emotional. Learning to control emotions and stick to your analysis is crucial.
Avoiding Common Psychological Traps
- Fear of Missing Out (FOMO): Avoid jumping into trades impulsively.
- Overconfidence: Don’t rely solely on a single successful trade.
Conclusion
Detecting buying and selling points in securities is both an art and a science. By leveraging the methods shared by James Liveright, including technical, fundamental, and sentiment analyses, as well as understanding psychological factors, you can enhance your trading strategy and make more informed decisions. Remember, the key to successful trading is continuous learning and adapting to market changes.
FAQs
1. What is the best indicator for detecting buy and sell points?
The best indicator varies for each trader, but commonly used ones include moving averages, RSI, and MACD.
2. How reliable is sentiment analysis in trading?
Sentiment analysis can be a powerful tool, especially when combined with other forms of analysis. However, it is not infallible and should be used as part of a broader strategy.
3. Can fundamental analysis be used alone to detect buy and sell points?
While fundamental analysis is important, it is usually more effective when combined with technical analysis to time the market better.
4. How do I control my emotions when trading?
Developing a solid trading plan and sticking to it, regardless of market fluctuations, can help in controlling emotions. Practice and experience also play crucial roles.
5. Are candlestick patterns reliable for detecting buying and selling points?
Candlestick patterns can be very reliable when used correctly and in conjunction with other indicators.
Be the first to review “Simple Methods for Detecting Buying and Selling Points in Securities with James Liveright”
You must be logged in to post a review.
Related products

Forex Trading
Original price was: $249.00.$15.00Current price is: $15.00.
Forex Trading
Original price was: $125.00.$17.00Current price is: $17.00.
Forex Trading
Original price was: $1,898.00.$10.00Current price is: $10.00.
Original price was: $139.00.$23.00Current price is: $23.00.

Original price was: $1,849.00.$15.00Current price is: $15.00.
Original price was: $999.00.$5.00Current price is: $5.00.
Forex Trading
Original price was: $550.00.$5.00Current price is: $5.00.

Forex Trading
Original price was: $397.00.$31.00Current price is: $31.00.

Original price was: $695.00.$41.00Current price is: $41.00.
Original price was: $4,995.00.$15.00Current price is: $15.00.
Original price was: $649.00.$20.00Current price is: $20.00.
Original price was: $497.00.$11.00Current price is: $11.00.
Original price was: $895.00.$15.00Current price is: $15.00.
Original price was: $310.00.$23.00Current price is: $23.00.
Original price was: $2,120.00.$15.00Current price is: $15.00.

Original price was: $1,800.00.$54.00Current price is: $54.00.
Original price was: $497.00.$31.00Current price is: $31.00.
Forex Trading
Original price was: $697.00.$5.00Current price is: $5.00.
Original price was: $1,200.00.$23.00Current price is: $23.00.
Forex Trading
Original price was: $799.00.$15.00Current price is: $15.00.
Reviews
There are no reviews yet.